Power BI gives you many options to create reports that end users can engage with. Using field parameters, viewers can interact directly with visuals in the report. Let’s dig deeper and learn how you can use filed parameters for your reporting.
What are field parameters in Power BI?
In simple terms, field parameters let users select the columns they want to analyze in a visual using a slicer. This means users can dynamically modify the visual to show only specific dimensions or metrics from the dataset.
Power BI field parameters are helpful when the report is based on a dataset with many columns. Report viewers can customize visuals and interact with them without needing to change the data model.
Note: The field parameters are a preview feature in Power BI. Microsoft adds new features in the preview mode for testing purposes before releasing them. You may need to enable them in the settings if you can’t find them.
Why should you use this feature?
Field parameters help you:
- Make highly interactive reports by offering dropdowns, checkboxes, and buttons to select columns
- Declutter reports and improve performance by reducing the number of visuals
- Improve the user experience of the report by allowing users to access the data they want
Overall, field parameters help you improve the user experience, flexibility, and interactivity of your report.
An example of how to use field parameters in Power BI
Let’s say you’re building a sales performance report for an online store. You want to analyze the revenue figure by products, categories, locations, and quarters.
In this case, instead of building multiple charts in the report, you can create a field parameter containing all these columns and plot it against the sales value column to build an interactive chart.

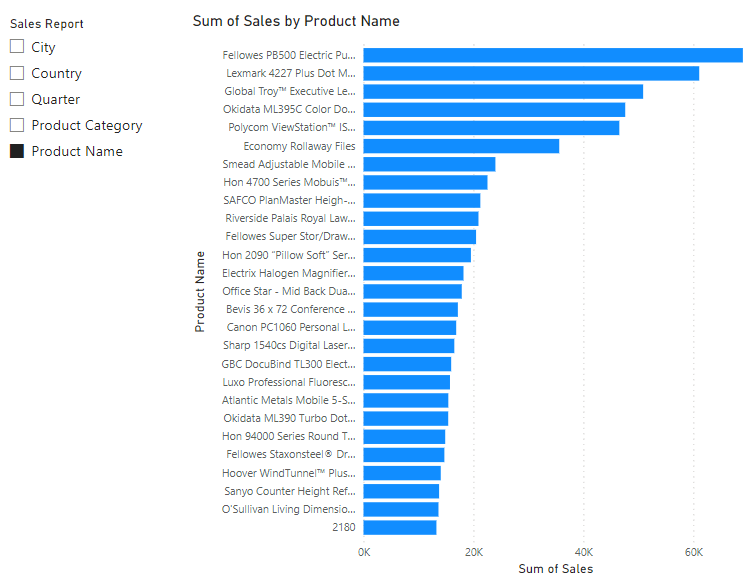
Result: End-users of the report can quickly toggle between revenue figures by products, categories, locations, and timeframes in a single chart.
How to create field parameters in Power BI?
In Power BI Desktop, you can create new field parameters and include the columns from existing datasets. Then, use the generated table to create visuals and load the columns dynamically.
Here’s the step-wise tutorial on how to create and use field parameters in Power BI.
Step 1: Enable field parameters in settings
if you can’t find the “Fields“ option at Modeling > New Parameter, you may need to enable it in the settings.
To do so, open Power BI Desktop and go to Options and settings.
Go to Options > Global > Preview features and tick the checkbox against “Field parameters.”
Click Ok to save the settings.

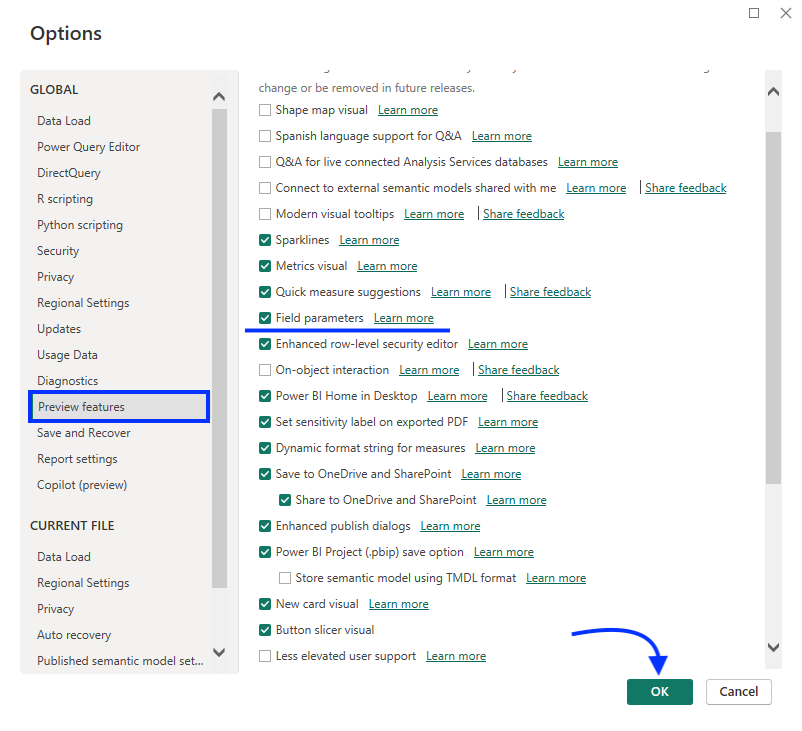
Once done, the Power BI field parameters feature will become available in the Modeling tab.
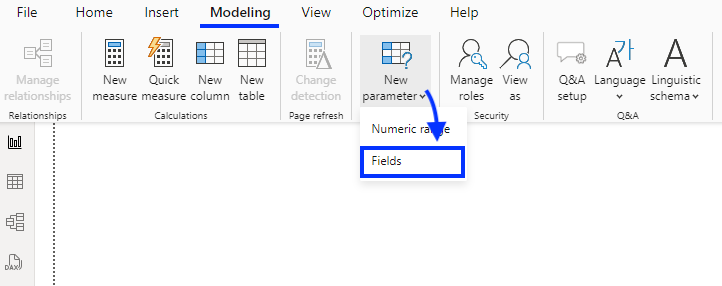
Step 2: Define a new field parameter
First, you need to add data to your report. Power BI supports a few native connectors and lets you import data manually. However, if you want to load data from cloud apps and schedule refresh, you can use no-code connectors by Coupler.io – a reporting automation platform that connects 60+ business apps to Power BI and allows you to create dynamic reports and dashboards.
Try it yourself right away. Select your data source in the form below and click Proceed.

Sign up for a Coupler.io account (it’s free) and finish the importer setup by following the provided instructions.
Once your data is loaded, you can create new field parameters in Power BI by going to the Modeling tab, clickingk New parameter, and selecting Fields from the drop-down.

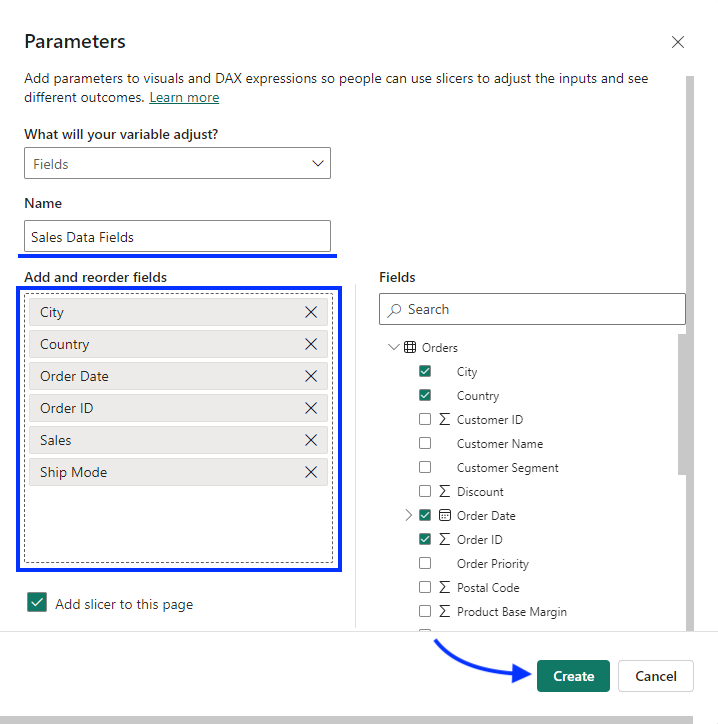
Now, enter a name for the parameter (it will be displayed in the data pane.)
Select the dimensions and metrics from the Fields section. You can also rename the field names and change their order in the field parameters.
Keep the checkbox at the bottom ticked to add a slicer to the report.
Click the Create button to add the field parameter.

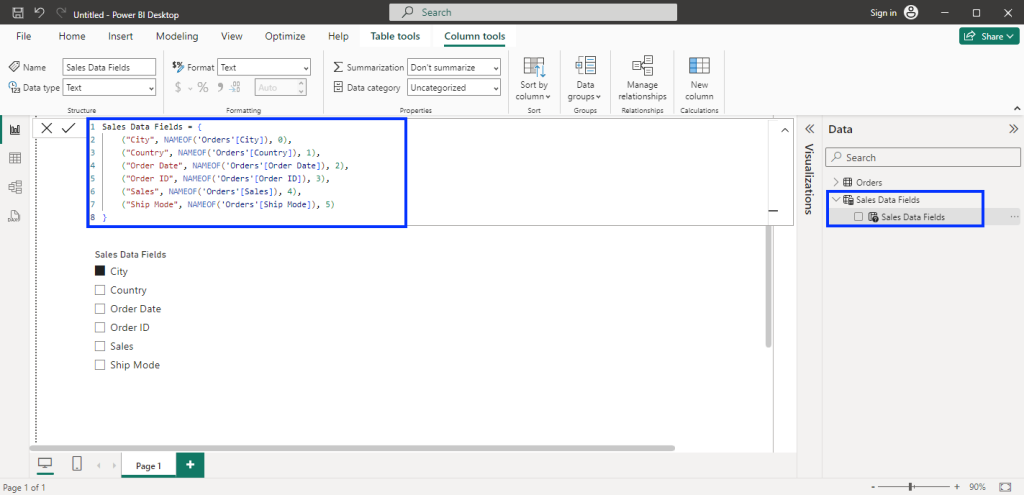
This will generate a Power BI field parameter table in the data pane using DAX expressions, as shown below.

Step 3: Interact with visuals using the field parameter
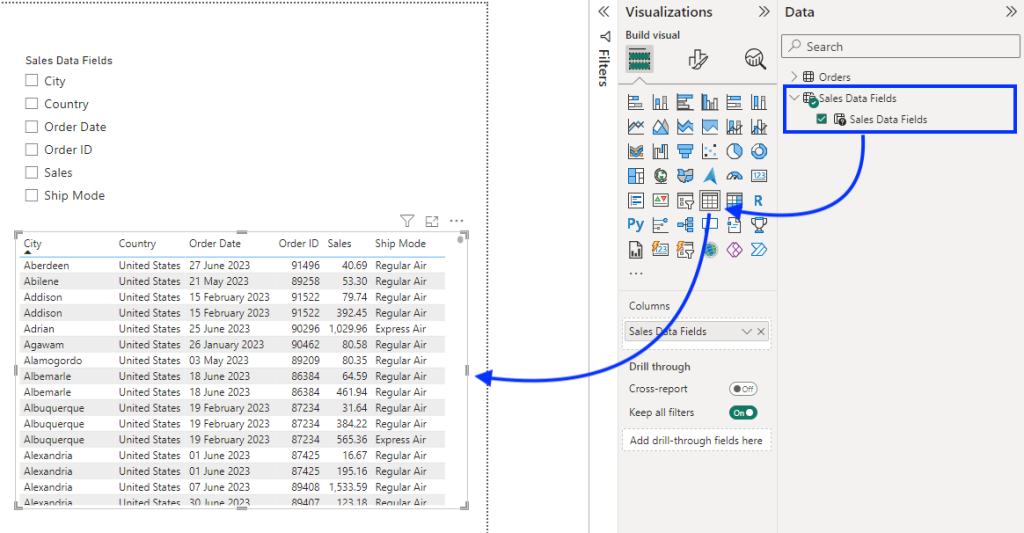
You can use the created field parameter to build a dynamic visual. For example, here we built a new table visual using the field parameter.

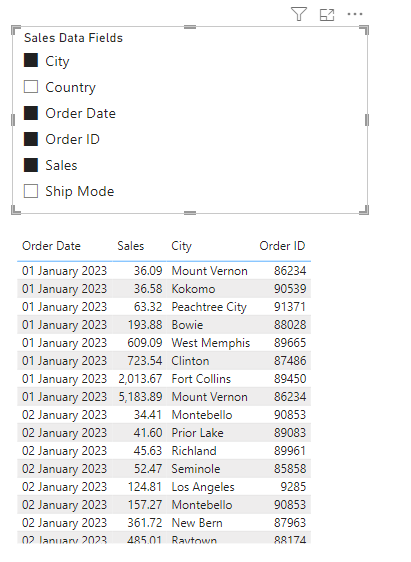
Now, you can use the parameter slicer to interact with the Power BI visuals. For example, we used it to display only certain fields in the table visual.

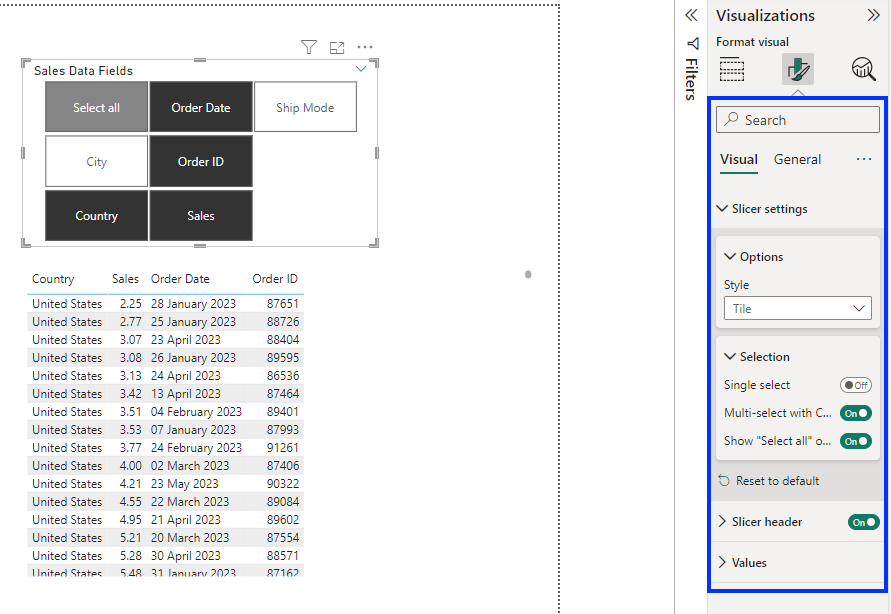
You can make the slicer more user-friendly by changing its appearance. Select the slicer and go to Visualizations > Format visual to adjust the visual appearance.
For example, we’ve selected the Tile style for the slicer.

You can also apply conditional formatting to the slicer to change its appearance dynamically.
How to edit field parameters in Power BI if you need to tweak them
The field parameters are generated using DAX (data analysis expressions) queries from existing data models. Select the field parameter table in the data pane to see its DAX queries.

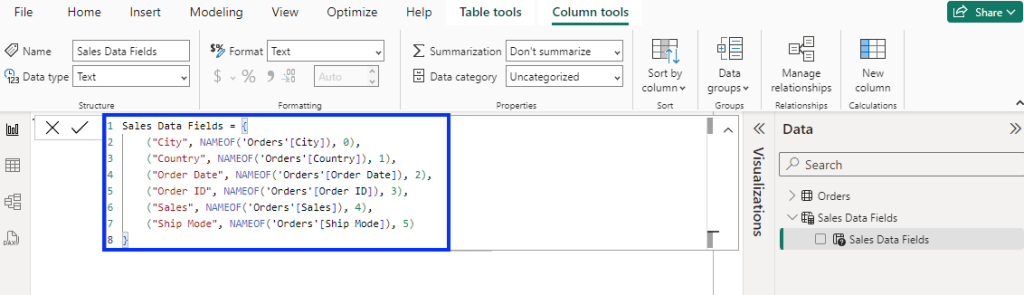
The DAX query for field parameters follows an easy-to-interpret structure. For example:
Sales Data Fields = {
("City", NAMEOF ('Orders' [City]), 0),
("Country", NAMEOF ('Orders' [Country]), 1),
("Order Date", NAMEOF ('Orders' [Order Date]), 2)
}
Here, “Sales Data Fields” refers to the field parameter table name. Each row inside the curly bracket represents individual fields. For example, for the first row:
- “City” – The name of the field that appears in the field parameter table
- NAMEOF(‘Orders’[City]) – The location of the reference column used from the data model
- 0 – The sort order of the field that decides its position
You can modify the desired component to edit the field parameters. For example, you can rename existing field names, change sort orders, and remove or add new fields.
How to group multiple columns in a single field?
You can group related fields together using the data groups feature.
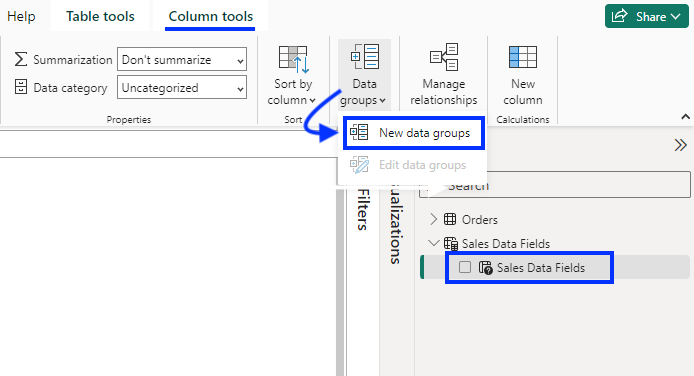
Select the field parameters table in the data pane and go to the Column tools tab. Click Data groups and click New data groups from the dropdown menu.

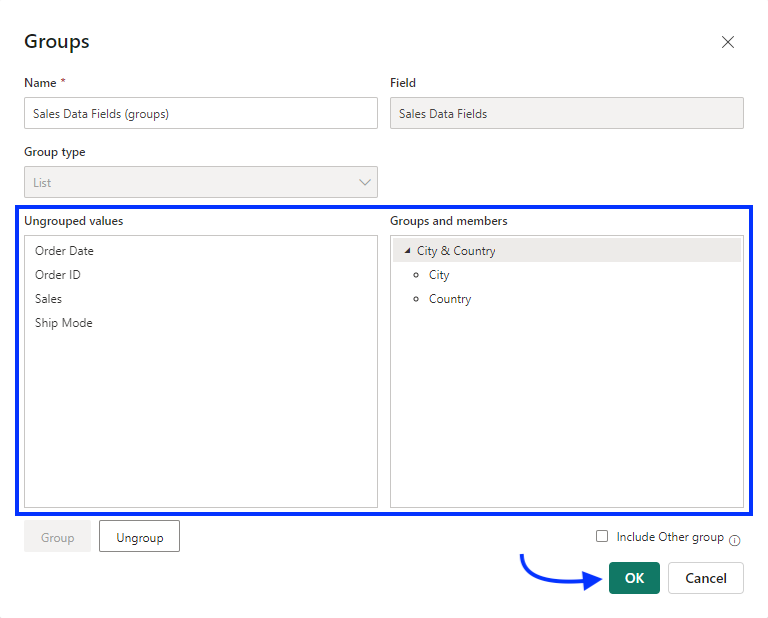
From the Ungrouped values, select and group the fields. You can select multiple fields by pressing the Ctrl button.
For example, here, we’re grouping columns for the city and country names.
Click OK.

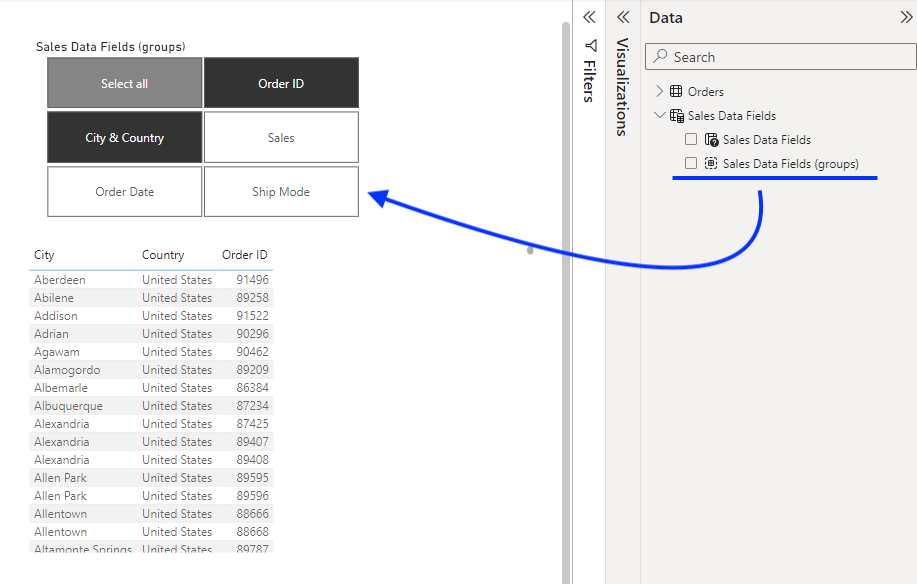
The column group will appear in the data pane on the right, which you can use in the data slicer to interact with the visual. In this example, you can see the grouped columns are combined in the slicer.

Limitations of field parameters
The field parameters feature comes with certain limitations:
- No support for AI and Q&A visuals
- No option for users to select “none” fields; selecting no field is the same as selecting all
- It can not used with live connections without a local model
- It can not be used with the implicit (autogenerated) measures; you’ll need to create new measures using DAX for that
Furthermore, editing a field parameter requires you to modify the DAX query, which can be tricky for business users to understand.
Extra tips
By now, I feel you’re ready to build dynamic reports using Power BI field parameters. Here are some best practices for using them:
- Use descriptive names for the fields to help users easily understand your field parameters
- Limit the number of field parameters. Too many slicers on a report page can be overwhelming for end-users.
- Create separate parameter fields for metrics and dimensions to allow users to customize their reports using various combinations of metrics with dimensions
- Use the visual-level filter for the slicer to display only the required fields
Lastly, if you’re working with dynamic data sources, it’s important to keep the Power BI report updated. You can try Coupler.io to import data from various sources and keep your reports up to date.