
Power BI allows you to represent and analyze data from various sources using different types of charts, such as bar charts, line charts, etc. However, it does not have a native feature to create a histogram chart!
Nevertheless, you can create a histogram in Power BI. In this article, we’ll cover multiple ways you can make histogram charts in Power BI.

Understanding/What is a Power BI histogram
A histogram is a kind of visualization chart to show how numbers are distributed or spread out in a dataset. For example, tracking the sales or KPI of a certain product over a month, display heights in a sample population, etc.
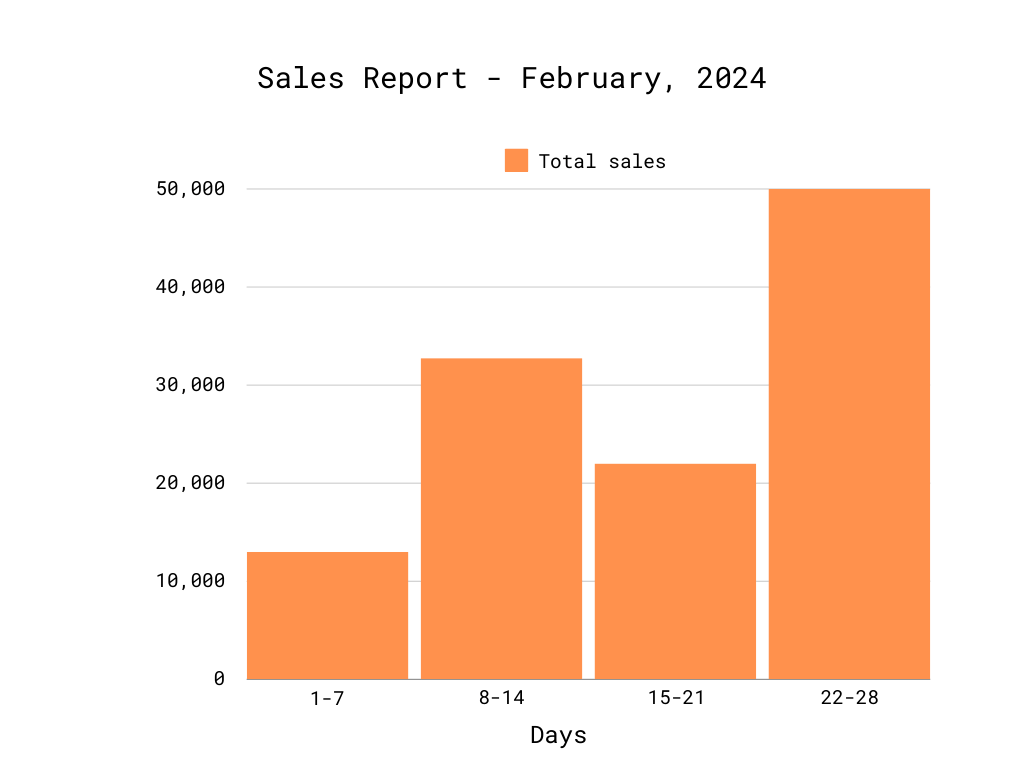
The histogram consists of a series of horizontal ranges and vertical bars. The horizontal axis(x-axis) is divided into ranges of values called bins like [1-7], [8-14], [15-21].
Again, the height of each bar(Y-axis) corresponds to the frequency or count of data points falling within that range. For instance, the bin [15-21] has a frequency of 22,500. That means there are 22,500 data points within that particular range.

How users can add histograms in Power BI
In Power BI, people create charts to visually represent data for data analysis, communication, and informed business intelligence. Histograms can be a useful tool for identifying patterns, outliers, and trends within a dataset in Power BI reports.
However, as we already mentioned, Power BI lacks a native histogram creation feature like, for example, Power BI Matrix. There was once a Histogram Chart custom visual by Microsoft available. It was removed from AppSource in 2022 without official comments.
Despite the lack of a built-in histogram chart, you can add it in Power BI using third-party options. In that case, you have 3 ways to create a custom Power BI histogram chart:
- Marketplace apps: You can use other histogram apps(free +pro) from the marketplace.
- GitHub repositories: Another way is to use a GitHub repository. You can access the extracted custom visual file (.pbiviz) from an old Power BI file containing the custom Microsoft histogram visual.
- DAX expressions: You can also create histograms using custom DAX expressions combined with helper tables.
How to make histogram in Power BI using the Marketplace App
Step 1: Load Your Data into Power BI
To create any Power BI report with charts like histograms, users need data. Power BI offers in-built connectors to load data from various sources like Excel, CSV, SQL server databases, etc. However, Power BI doesn’t support PPC platforms, marketing tools, accounting software, and others.
In that case, you can opt for Coupler.io. It’s a reporting automation solution that offers over 60 data sources, including Google Analytics, Hubspot, Salesforce, and more, to connect to Power BI. You can blend data from multiple sources, transform data before loading, and automate data refresh on a schedule. Try it right away!
Select your source application in the form below and click Proceed. You’ll be prompted to create a Coupler.io account for free. Then, you’ll need to complete a couple of simple steps to collect and organize your data.

Once the data is loaded, you can proceed with creating your histogram charts in the Power BI report.
Step 2: Import histogram app in Power BI
Now, you are ready to install a histogram application in the Power BI. To do so,
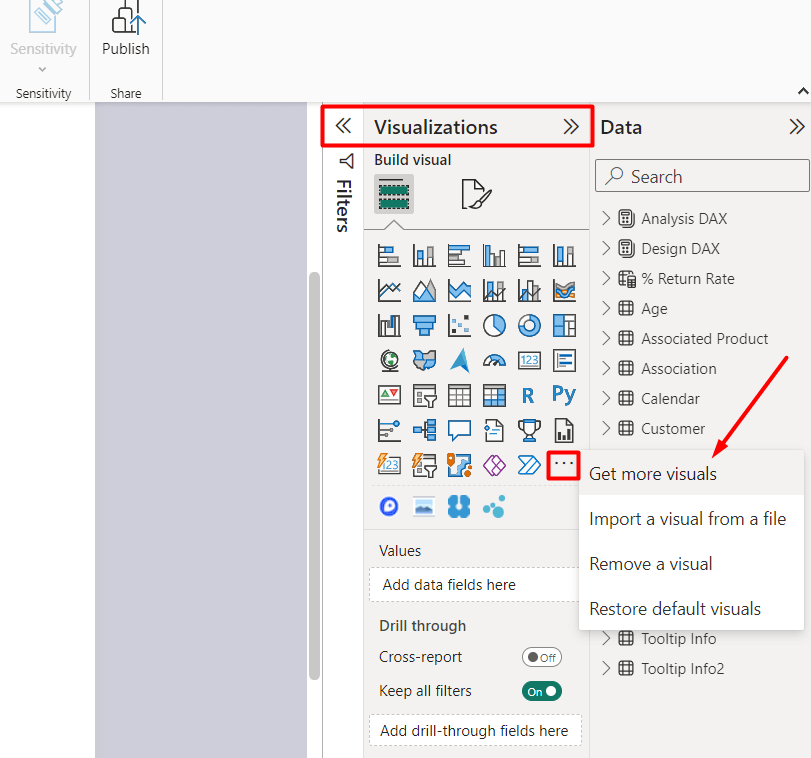
- Navigate the “Visualizations” tab. You can see the default Power BI charts here
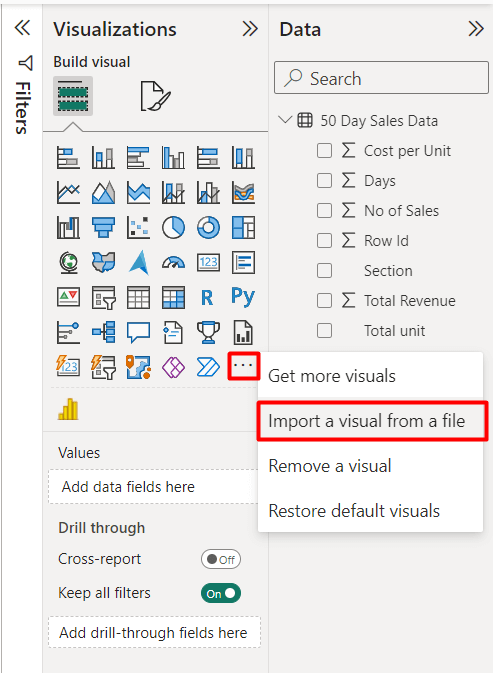
- Click on the 3-dot (…) option – It will show 4 options for adding/removing and modifying any third-party visuals from the report
- Click on the “Get more visuals” option

It will redirect you to the Power BI AppStore. Search for “Histogram”. You can see multiple Histogram chart add-ons (Free and Pro) for Power BI here

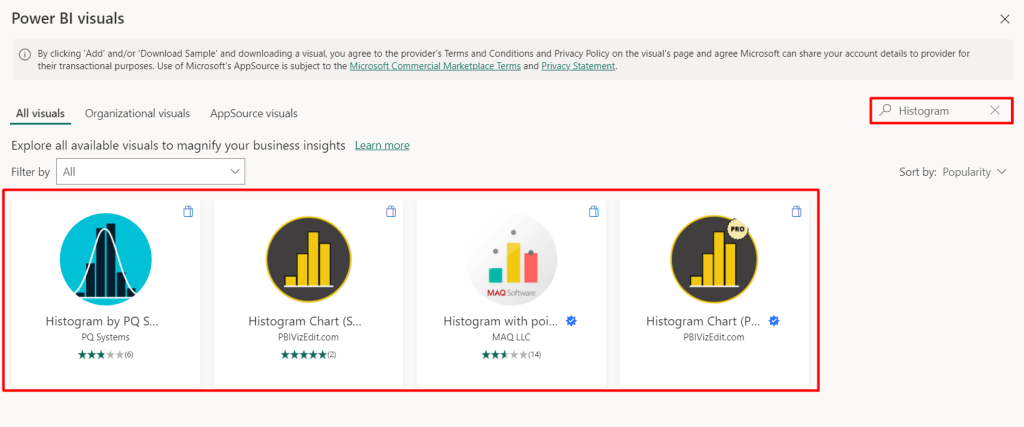
- Click on the preferred one. For our case, we’ve used the Histogram Chart of the PBIVizEdit
- Next, click on “Add” to include the chart in your Power BI visualizations section

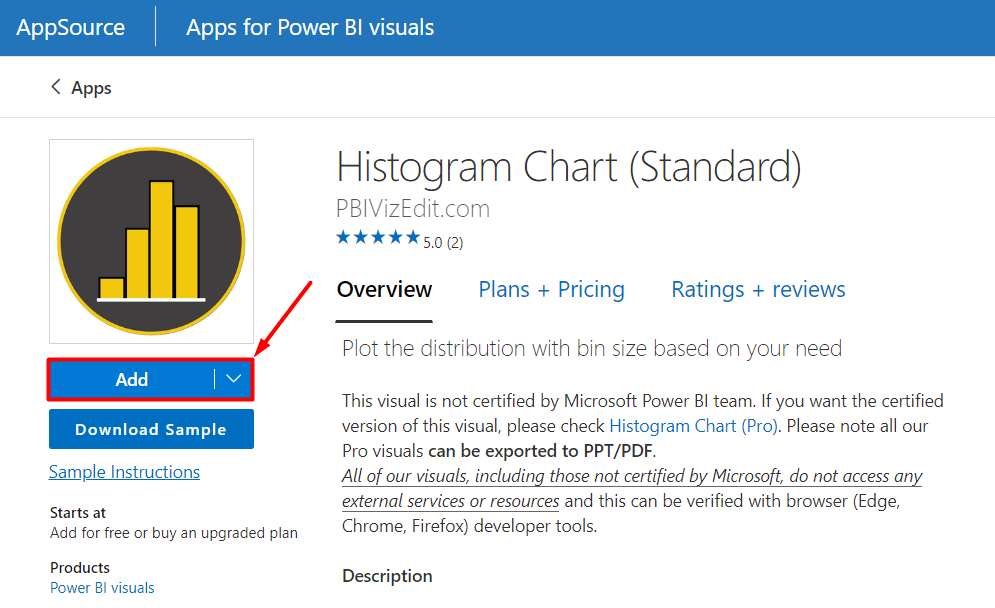
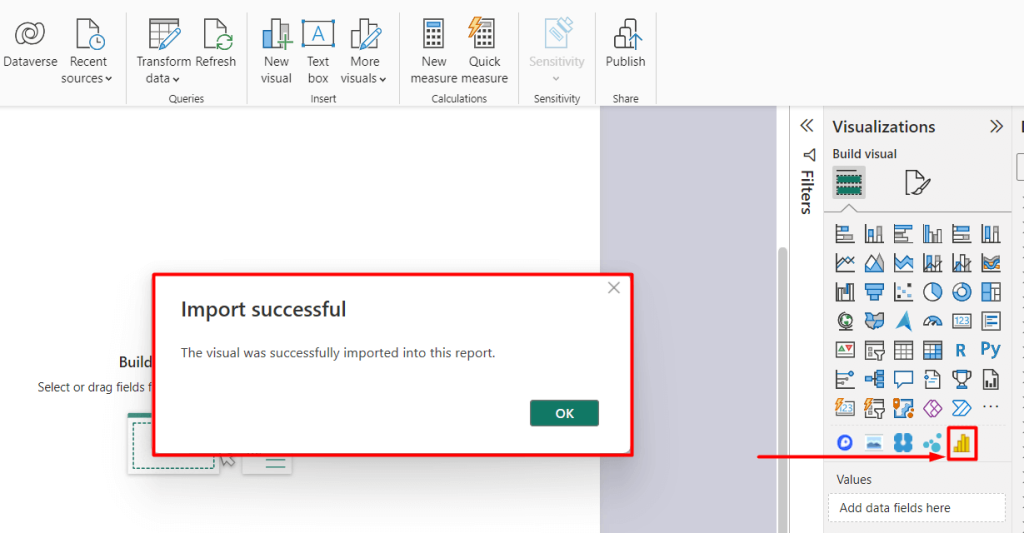
You can also download their pre-made dataset as well as get the sample instructions here. Within seconds, it will be added and show a success message like in the image below.

Note: Instructions for adding values and frequencies may vary depending on the chosen app.
Step 3: Create a histogram in the Power BI Report
Now, you are all set to create a histogram in your Power BI report.
- Select the “Report View” mode
- Then, simply click on the “Histogram” icon. It will be added to the report

- Next, you need to choose 2 parameters for the range (x-axis) and the frequency (y-axis)
- Drag-and-drop the data range table at the “Value 1” section
- Next, add the frequency data at the “Value 1 weight” option
- And boom! Your Power BI histogram is ready!

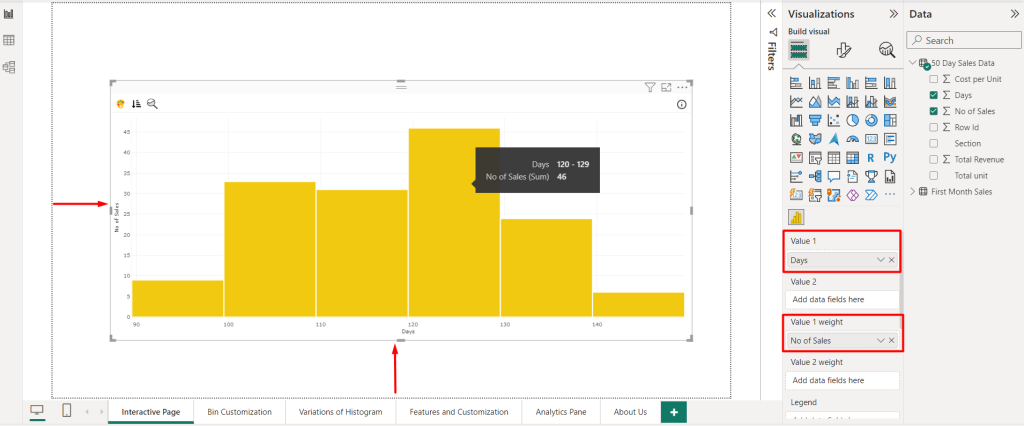
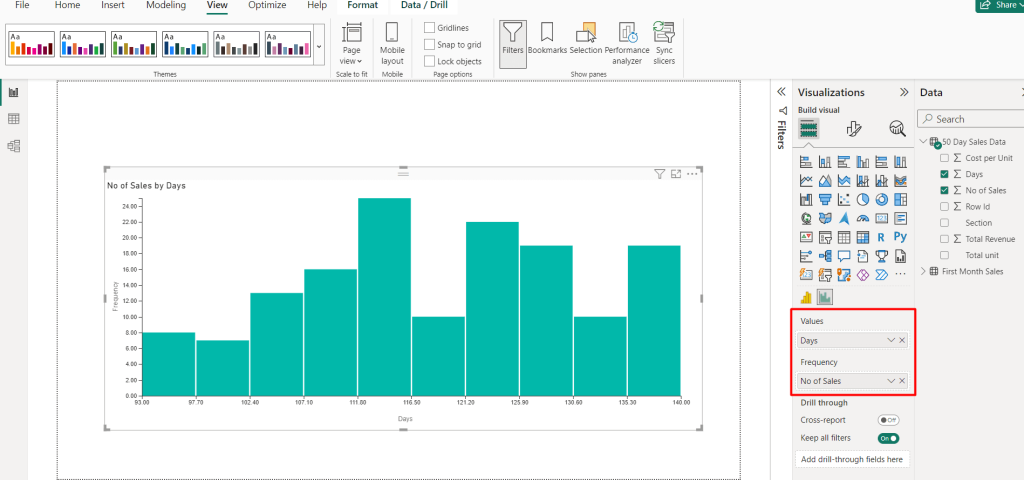
For our case, we’ve used a 50-day sales report. For Value 1, we’ve put the “Days” ranging from 90 to 140. For its frequency parameter, we’ve inserted the No. of Sales data. And, we’ve created a histogram in Power BI containing the sales frequency for this particular range.
Create histogram in Power BI using the GitHub repository
Mircosoft Hisgram app was available on the marketplace till 2022. When it was removed, data enthusiasts filled the gap by creating a GitHub repository named “power-bi-histogram-chart-visual-by-microsoft-legacy”. It’s an open-source custom histogram visuals and an efficient way to import histograms into Power BI.
Now, you can use this GitHub repository, instead of using Power BI add-ons for making histograms. This option will help you to create histogram charts in Power BI, just like the Microsoft app, even though it’s not officially supported anymore.
Step 1: Download the GitHub (.pbiviz) file
First, you need to download the .pbiviz GitHub file of the Microsoft Power BI histogram. For this,
- Go to this GitHub repository
- Click on “Code” and it will show drop-downs
- Click on “Download ZIP”

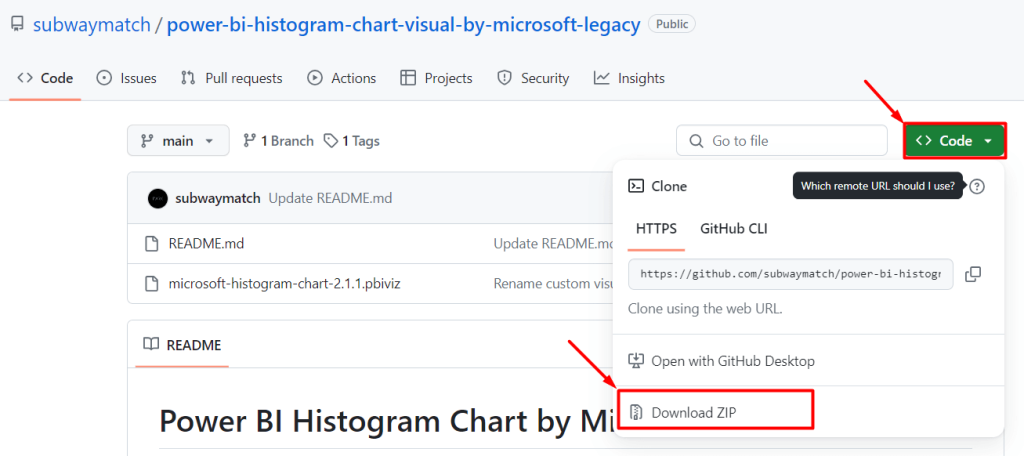
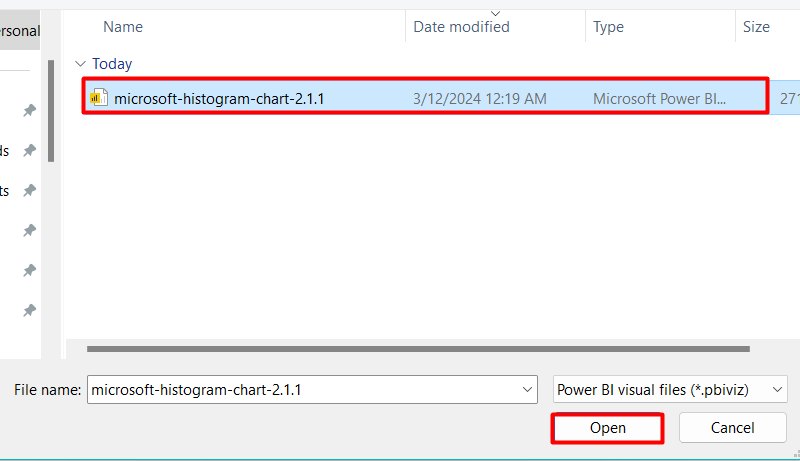
- After downloading, unzip the folder and you will see a .pbiviz file named “microsoft-histogram-chart-2.1.1”
Step 2: Load and import the custom visual in Power BI
The next step is quite the same as using the histogram app. You need to load your data source into the Power BI report.
- After that, you need to import the downloaded .pbiviz histogram chart file
- Click on the 3-dot(…) option in the data visualization pane
- Select the “Import a visual from a file” option

- Click “Load” and choose the downloaded .pbiviz file

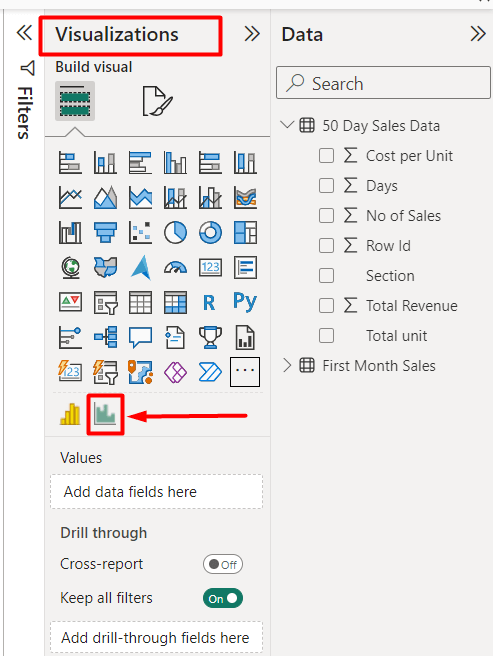
- Now, you will see the successful message and an icon for the “Hisogram 2.1.1” is added to the visualizations section.

Step 3: Make a histogram chart in Power BI
Now, you can make a histogram based on your data.
- Drag the custom histogram visual from the Visualizations pane onto your report canvas
- Select the values for the range and frequency. You will see the desired histogram inside your Power BI report

How to customize your histogram in Power BI
Once you have your histogram, you can customize the color, theme, labels, etc, according to your needs. You can also modify the bins or data buckets and even add overlay trendlines or distribution lines inside your Power BI reports. Let’s see how you can customize a histogram chart.
Use color theme
To create a more stunning and personalized histogram, you can use different themes. You’ll find a wide range of readymade themes in Power BI.
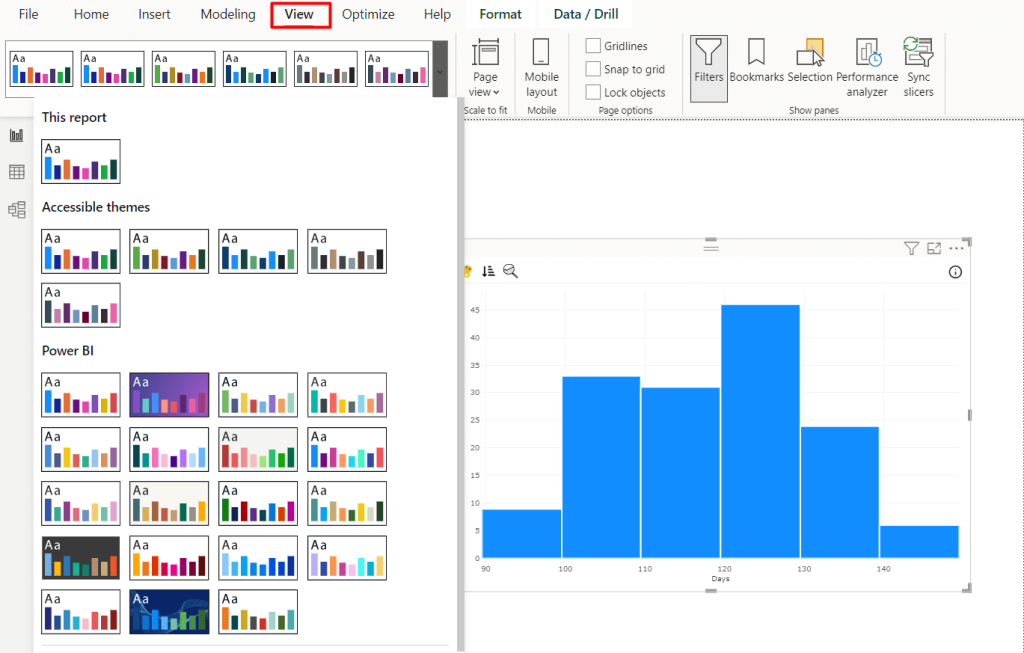
- Go to the “View” option
- You can see multiple color-based themes here
- Select one and it will be applied instantly
- You can also use the theme gallery as well as add custom themes inside Power BI

Add titles and annotations
Next, to make the histogram chart easy to understand, you should use the appropriate title and annotations.
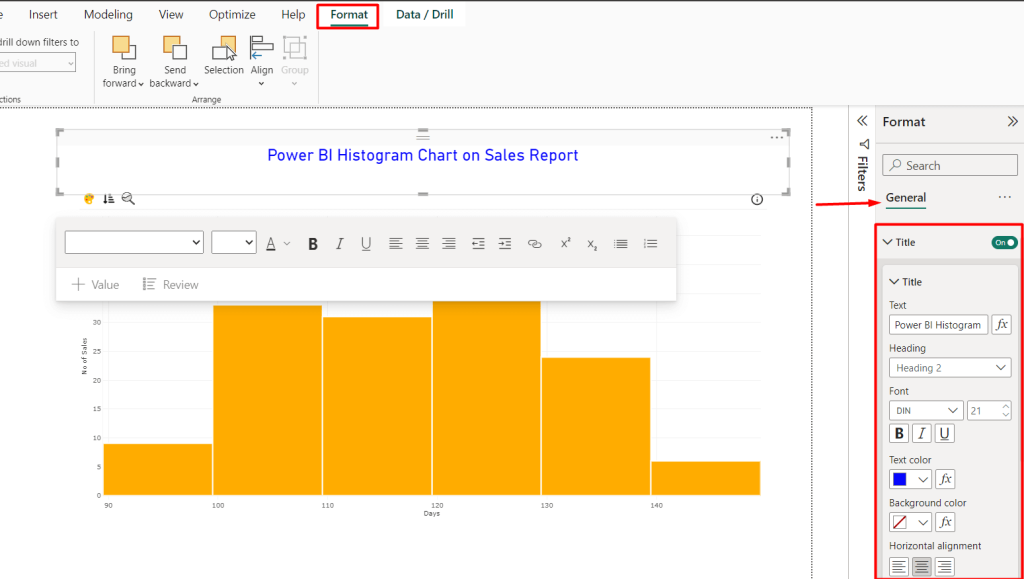
- Navigate to Format ? General
- Turn on the title toggle option
- Write the title text such as “Power BI Histogram Chart on Sales Report”
- You can customize the title heading, font family, size, color, alignment and more!

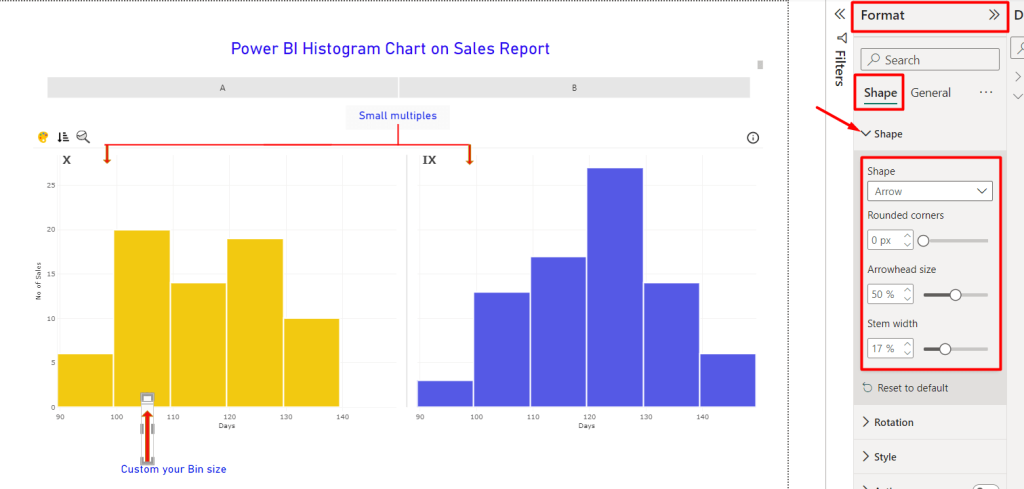
Additionally, you can use annotations to show the flows or directions. Annotations are useful when you have 2 or more histogram charts in your Power BI canvas. You can simply use different shapes like lines, and arrows for annotations. You can also use these shapes for adding labels/subheadings and tooltips as well.
- For this, go to the Format ? Shape
- Select the required shape from the dropdown
- Modify its color, size, width, and other properties

Adjust Power BI histogram bins
The bin size or data bucket in a histogram determines the width of each interval on the x-axis. The value can be divided automatically. However, you can simply customize the bin size if required.
For example, you have a dataset with a wide range of values such as age distribution in a population. You have to increase the bin size for better visualization of data patterns and insights. Similarly, you can also shrink the size to capture the finer details in a dataset.
For histogram bin size customization in Power BI,
- Go to the “Format your visual” tab
- Scroll down and you can see the “Determine bins by” drop-down section
- Here 3 options are available: Auto, Size, and Count
- Select the preferred option, e.g. Size
- Put the value for the custom bin size
- It will instantly show the histogram with the given bin size

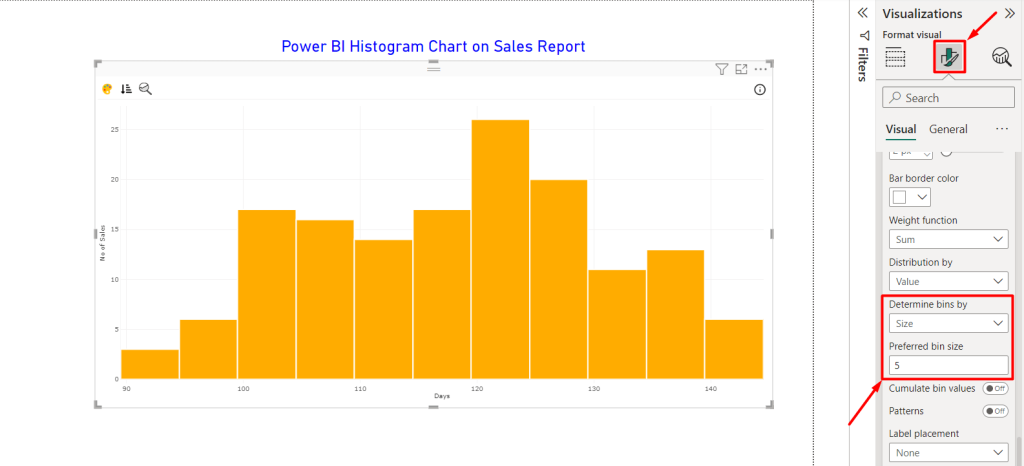
In the given example, the bin size was automatically 10, we reduced it to the frequency distribution range of 5, and here is the final output with more precise insights.
Include data labels
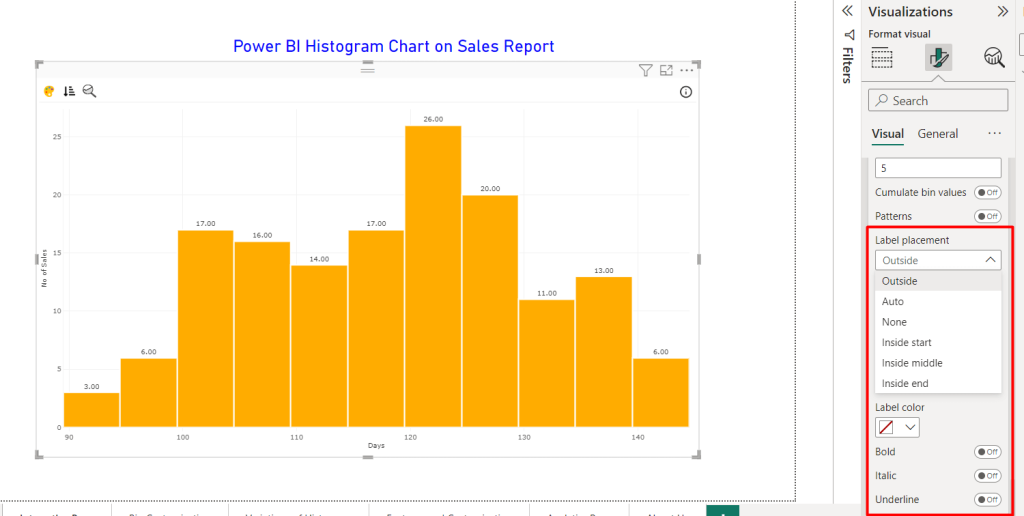
It’s a good practice to use the data labels in the Power BI histogram. Labels provide precise information about the frequency or count of data points within each bin. It will also enhance the clarity and interpretability of the report for users.
- You can see the “Label placement option” below the bin customization option
- Choose the preferred placement of the data label among 6 options – outsize, auto, none, inside start, inside middle, and inside end.
- You can also customize the decimal places, label angle, color, and styling properties such as bold, italic, or underlined labels.

Add trendlines/distribution lines
Adding trendlines/distribution lines in a histogram in Power BI helps to present the expected distribution of the data. It can be normal or skewed distributions, providing insights into its shape and characteristics.
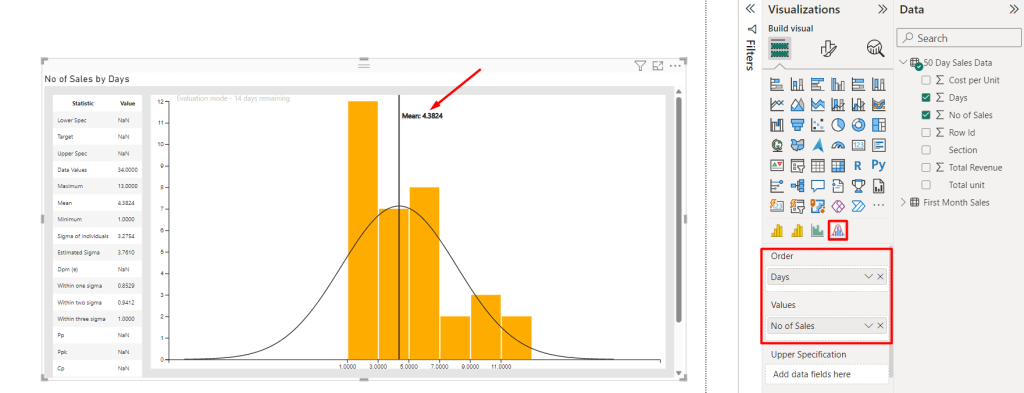
Using a third-party Power BI histogram add-on is the easiest way to add distribution lines. To do so, install the “Histogram by PQ system” app following the previous process.
- Click on the histogram app icon
- Drag and drop the 2 tables to determine the order and values
- It will automatically show the “Mean” value of the dataset with the distribution lines
- At the left side, you also find a tab containing all other values, including maximum, minimum, mean, data values, etc.

Important Note: You need to add/install the histogram app when loading a new data source every time!
For more tips, check our guide on how to visualize data in Power BI.
Can you create a histogram using a combination of DAX and helper tables?
You can also create a histogram in Power BI using DAX and helper tables. For this, you’ll need to write a DAX expression or Power Query to define bins. Also, you need to calculate frequencies, and potentially create additional tables to manage bin data.
However, it’s not an efficient or recommended approach. As it may lead to unnecessary complexity in the data model. Plus, it can make it harder for users to maintain and understand the underlying data structure.
Moreover, histograms are best presented visually in reports, rather than being part of the large data model itself.
Learn more about another types of visualizations, including Power BI maps and Power BI gauge chart.
So, you can create and add histogram charts in Power BI using the marketplace apps or the GitHub repository as depicted in the steps above. These methods offer more flexibility and efficiency in data analysis and visualization within Power BI.
Connect your data source to Power BI with Coupler.io
Get started for free