Simply reporting what happened in the past is no longer enough to stay ahead of the competition. Predictive analytics has become an operational necessity for anticipating future trends and planning for what’s to come. It’s no longer just for big companies and enterprises. Thanks to modern tools like Microsoft Power BI, predictive analytics is now accessible to everyone.
This article will show you how to use Power BI data visualization and other features for predictive analytics.
What is predictive analytics?
By definition, predictive analytics is a type of data analysis that uses historical and current data to predict future events.
Organizations employ several levels/types of analytics. Here are the types of analytics you’ll find in most literature:
- Descriptive analytics: Understanding what happened.
- Diagnostic analytics: Identifying why it happened.
- Predictive analytics: Predicting what might happen next.
- Prescriptive analytics: Identifying what to do next.
Descriptive and diagnostic analytics focus on the past (and present). On the other hand, predictive and prescriptive analytics focus on the future.
While analyzing historical data is valuable for understanding past business performance and spotting areas that need improvements, this type of analysis is limited to the past and can’t predict future outcomes.
Predictive analysis, on the other hand, looks to the future. Its purpose is to use data to understand the business better and produce actionable insights that will lead to prescriptive analytics.
Power BI for predictive analytics
Making simple predictions, such as determining if something will happen, can often be achieved through manual data analysis. This involves checking past trends and patterns without using complex algorithms.
In cases involving complex and large datasets, advanced techniques come into play. These include data mining, statistics, predictive data modeling, algorithms, and machine learning. Power BI is well-equipped to support these advanced analytics needs, providing a powerful tool for predictive data analytics.
Power BI predictive analytics allows you to make predictions by using the following options:
- Data Analysis Expressions (DAX)
- R and Python scripts
- Power BI built-in visuals
- Azure ML integration
We’ll explore each of these options in more detail below.
Data Analysis Expressions (DAX)
For simple predictive tasks, you can use DAX in Power BI to create calculated columns and measures to predict future events. For example, functions like LINEST and LINESTX are especially useful for linear regression, helping you understand relationships between variables in order to forecast future trends.
R and Python scripts
You can write R and Python scripts directly in Power BI. These are two powerful languages for data analysis and machine learning. For example, you may write an R script for regression analysis or use Python packages to build predictive models.
To get started, you need to install R or Python first, then configure a setting in Power BI Desktop. There are three places where you can write the scripts:
- Get data: Use the ‘Get data’ button and choose R or Python script from the connector list.
- Power Query Editor: Find the Scripts section in the Transform tab.
- R or Python visual: In the Visualization pane, look for the R or Python script option.
For more detailed steps, we’ll provide examples of using Python visual in Power BI later in this article.
Power BI built-in visuals
Visualizing data trends and patterns is crucial for deriving predictive insights. Some Power BI’s built-in visuals are designed for this purpose such as scatter plots which you can use to identify clusters.
The forecasting features in line charts are also helpful in predicting future values based on historical trends and seasonality.
Azure ML integration
For more advanced requirements, Power BI’s integration with Azure Machine Learning is highly advantageous. You can train complex models in Azure ML and directly embed them into your Power BI reports. This seamless integration enables the use of sophisticated machine-learning algorithms within the Power BI environment.
How to do predictive analytics in Power BI: Step-by-step overview
Predictive analytics in Power BI gives organizations a strategic advantage by enabling them to anticipate future outcomes and make informed decisions. The basic steps of implementing it consist of the following steps:
Step 1: Define goal
The key to a successful predictive analytics project lies in establishing a clear goal. Identify what you want to predict, whether it’s sales forecasts, customer retention, or product demand. A well-defined goal will guide the selection of data and analytical models, ensuring that the analysis supports your business objectives.
Step 2: Prepare the data
Data preparation is critical to the success of predictive analytics. Begin by gathering data from various sources relevant to your goal. Power BI enables you to collect data from multiple platforms. Once collected, you can use Power Query to transform and clean the data. Properly prepared data is crucial for accurate model training and reliable results.
Step 3: Implement the predictive model
Once you have prepared your data, the next step is to choose a suitable predictive model. The choice of model—be it regression, classification, or clustering—depends on the data characteristics and the project’s objective. Power BI supports the integration of advanced analytics models, enabling you to train the model using historical data. Monitor and refine the model periodically to maintain its accuracy and relevance as new data becomes available.
Step 4: Visualize the model
Visualization is vital in making complex data insights understandable. After training your predictive model, use Power BI’s visualization capabilities to craft interactive dashboards and reports. These visualizations help stakeholders easily interpret data insights and predictions. Utilize charts, graphs, and slicers to present the results in a clear and engaging manner, facilitating data-driven decision-making.
Step 5: Deploy and monitor
The final step is to deploy the predictive model and establish a system for continuous monitoring.
In Power BI, deployment involves publishing your reports and dashboards to the Power BI Service. It allows you to share the analytic results with team members and stakeholders. They will be able to interact with the dashboards in real-time.
You can set up scheduled data refresh to keep your reports up-to-date. Power BI also allows you to set up alerts and performance metrics to track the model’s accuracy and effectiveness over time.
Preparing data for predictive analytics using Power BI
When it comes to predictive analytics, preparing your data is a critical first step. The quality of your predictions heavily depends on the quality and reliability of the data you feed into your model.
Gathering data from multiple sources
Predictive analytics starts with collecting data from the relevant places. In marketing, for example, this typically includes data from CRM systems, web analytics, social media, and ad platforms.
Power BI provides a wide range of connectors to import data from Excel, SQL databases, various online services and platforms, and many more. It connects seamlessly with Microsoft data sources, which is one of Power BI’s strengths. However, it does have some limitations in terms of built-in connectors for cloud marketing sources.
This is where Coupler.io comes in handy. It’s a reporting automation solution that acts as a multi-source connector, allowing you to manage data transfers in one place. Coupler.io connects over 60 cloud data sources to Power BI, including those not natively supported, like Google Search Console and Facebook Ads.
Getting started with Coupler.io is easy. Choose your data source, click Proceed, and set up your connection. You’ll need a free Coupler.io account to begin.

Here’s a quick overview of how to use Coupler.io:
- Collect data: Configure the connection to the selected data and specify which data to load.
- Transform data: Organize and transform your data to make it analysis-ready. You can rename columns, apply filters, or add new columns with formulas.
- Load and refresh: Load your data into Power BI and schedule automatic data refresh to keep your data up-to-date.
Once your data is loaded, you can start analyzing it for predictive insights. Coupler.io’s data transformation features make it easy to fix data issues along the way, ensuring smooth analysis.
Cleaning and transforming data
Real-world data comes in all shapes and sizes and is often riddled with errors. Data cleaning and transformation are essential for preparing your data for predictive analytics models.
If you are transforming data using Power BI, Power Query, and DAX are excellent tools for handling common data problems, such as:
- Combining data from multiple sources.
- Handling missing values by replacing empty data.
- Removing outliers.
- Performing feature engineering by creating new calculated columns from existing ones to help in segmentation.
When your data is cleaned and ready, you can select features and train your predictive models.
How do you implement a predictive analytics model in Power BI?
Once your data is prepared, you can start building your predictive analytics model. You will need to split your data into different sets and apply a different process to each set. To facilitate data splitting, Power BI predictive analytics supports integration with Azure Machine Learning, or you can use R and Python scripts.
The model stage
There are two common approaches for data splitting: “training-testing” and “training-validation-testing”.
“Training-testing” split
Using this approach, you split your data into two sets:
- Training: Contains the largest chunk of the data, typically 70% or more. This set is used to train the model.
- Testing (evaluation): Used after training to evaluate the model’s ability to generalize to new, unseen data.
This method provides a quick assessment of model performance in real-world scenarios. However, it may not allow for extensive parameter optimization, potentially limiting model accuracy.
To further enhance model evaluation, consider using cross-validation. This technique involves splitting the dataset into multiple subsets (folds), training the model on a combination of these folds, and validating it on the remaining part. By repeating this process multiple times, each fold serves as a validation set, providing a comprehensive evaluation.
“Training-validation-testing” split
This method is considered the best practice. It includes an additional validation set that is used during the training process to tune the model.
- Training: Used for training the model, just like in the training-testing split.
- Validation: Used during the training process to tune model parameters and refine model architecture. It helps in hyperparameter tuning and selecting the best model version based on its performance on unseen data.
- Testing (evaluation): Used to evaluate the model’s final performance. It provides an unbiased assessment of its accuracy and generalization capabilities in real-world scenarios. If the model meets performance targets, it can be deployed in production; otherwise, further refinement is necessary.
A typical split is 70-80% for training, 10-15% for validation, and 10-20% for testing. For example, you might use an 80/10/10 split: 80% for training the model, 10% for validation, and 10% for testing.
How to choose the right model
Selecting the right model is crucial for ensuring accurate predictions. Here are the key factors to consider:
- Complexity vs. performance: Choose simpler models if they achieve performance similar to complex ones. Complex models may capture detailed patterns but can overfit by learning noise, making them less effective on new data.
- Interpretability: Simple models are easier to understand, which is important in areas like finance and healthcare, where knowing how predictions are made is essential. Complex models might make this transparency difficult.
- Generalization: Simple models tend to generalize better to new data, capturing consistent patterns without overfitting. It’s important to try multiple algorithms and compare their performance to find one that predicts well and generalizes effectively.
- Computational efficiency: Simple models require fewer resources and less time to train and predict, which is beneficial if resources are limited or real-time decision-making is needed.
By focusing on these factors, you can create a predictive model in Power BI that is accurate, efficient, and aligned with your business needs.
Predictive analytics example with Python visual in Power BI
In this section, we’ll show you how to use Python with Power BI for predictive analytics.
Getting started
Before you write any Python script, follow the steps below to install and configure Python in Power BI Desktop.
- Download Python from python.org and install it on your computer.
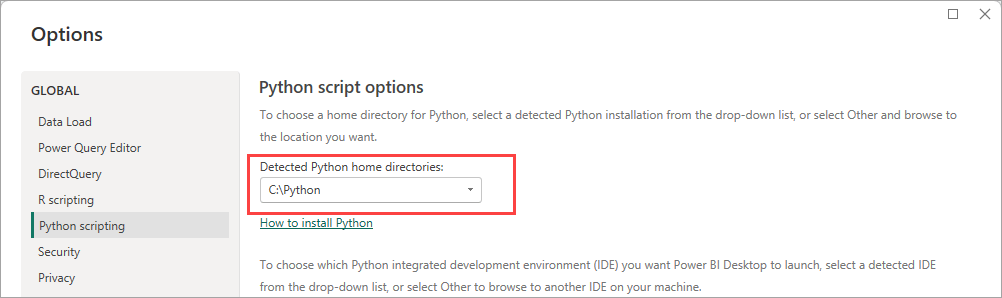
- Enable Python scripting by going to File > Options and settings > Options. Look for Python scripting in the left pane. If necessary, edit your local Python installation path under Detected Python home directories.

- Install the necessary libraries for your script. The following shows the commands to install Pandas, scikit-learn, and matplotlib for our examples.
pip install pandas
pip install scikit-learn
pip install matplotlib
Using the Python visual for predictive analytics in Power BI
In this example, we will focus on using the Python visual. However, as explained previously, you can also add a script using the ‘Get data’ button and Power Query Editor.
Using a Python visual in Power BI:
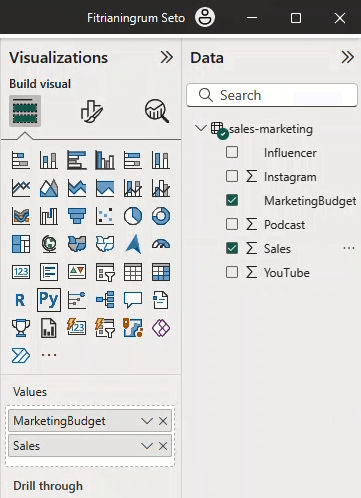
- Once your data is prepared, select the Python visual icon in the Visualizations pane.
- In the Enable script visuals dialog box that appears, select Enable.
- Select the checkboxes next to the fields that you use as dependent and independent variables for prediction. In the following screenshot, we select MarketingBudget and Sales as we will predict the sales value based on the marketing budget.

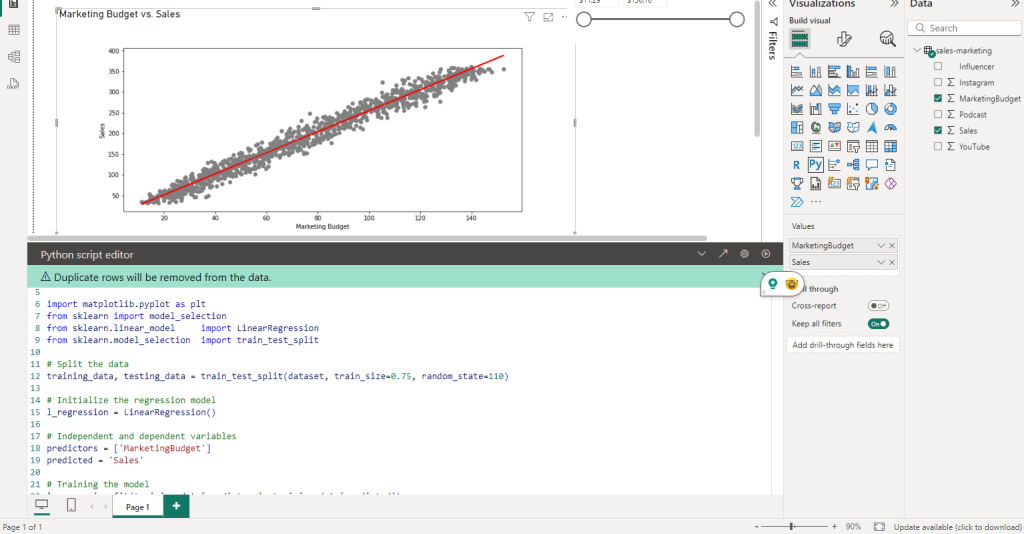
- Write the script in the Python script editor. Below is our example script to train and predict using linear regression:
import matplotlib.pyplot as plt
from sklearn import model_selection
from sklearn.linear_model     import LinearRegression
from sklearn.model_selection  import train_test_split

# Split the data
training_data, testing_data = train_test_split(dataset, train_size=0.75, random_state=110)

# Initialize the regression model
l_regression = LinearRegression()

# Independent and dependent variables
predictors = ['MarketingBudget']
predicted = 'Sales'

# Training the model
l_regression.fit(training_data[predictors], training_data[predicted])

# Predictions on the test data
predictions_sales = l_regression.predict(testing_data[predictors])

# Actual sales values from the test data
actual_sales = testing_data['Sales']

# Plot Marketing Budget vs Sales
plt.scatter(testing_data[predictors], testing_data[predicted], color="gray")

# Plot the predicted Sales values
plt.plot(testing_data[predictors], predictions_sales, color="red", linewidth=2)

plt.xlabel("Marketing Budget")
plt.ylabel("Sales")
plt.show()
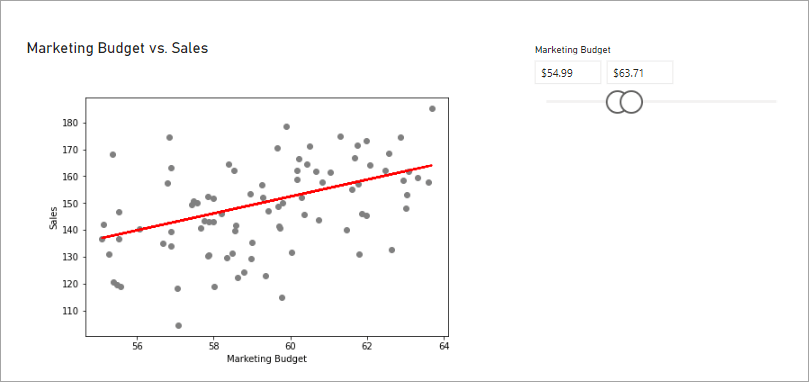
- Run the code. You’ll see a visual showing the actual versus predicted values.

- For simple interactivity in your dashboard, you can add a slicer to allow users to explore the data and predictions.

Can Power BI be used for forecasting?
Absolutely! Forecasting in Power BI predicts future trends by analyzing historical data using a time-series model. It also incorporates seasonality into predictions.
But what exactly is forecasting, and how does it differ from predictive analytics?
Simply put, predictive analytics is broader and more complex than forecasting.
- Forecasting predicts future values based on historical data and analysis. In the context of Microsoft Power BI, forecasting analyzes time-series data to project future values.
- Predictive analytics, however, uses a broader range of techniques, including machine learning and complex statistical algorithms. It analyzes patterns and relationships in data, often considering multiple variables and data sources, which makes it applicable to more complex scenarios.
What is the default forecasting model used in Power BI?
Power BI uses exponential smoothing as the built-in forecasting model, integrated within the line chart forecasting options. It automatically detects seasonal patterns in your data as you start a forecast using a line chart. This model uses two different algorithms to accommodate different data characteristics:
- ETS AAA (also known as the Holt-Winters algorithm) for seasonal data.
- ETS ANN for non-seasonal data.
Based on the analysis of your data, Power BI then uses the appropriate algorithm to forecast.
While ES is the default model, you have the flexibility to implement other forecasting models, such as linear regression and ARIMA. Power BI supports integrating these models through DAX for simpler cases or R/Python scripts for more advanced analysis.
How to do forecasting in Power BI?
Here’s a quick guide on how to forecast in Power BI. For more details, check out our article on forecasting: Forecasting in Power BI.
- Get data: Use the ‘Get data’ button. Or, try Coupler.io for marketing cloud data that is not directly supported by Power BI connectors.
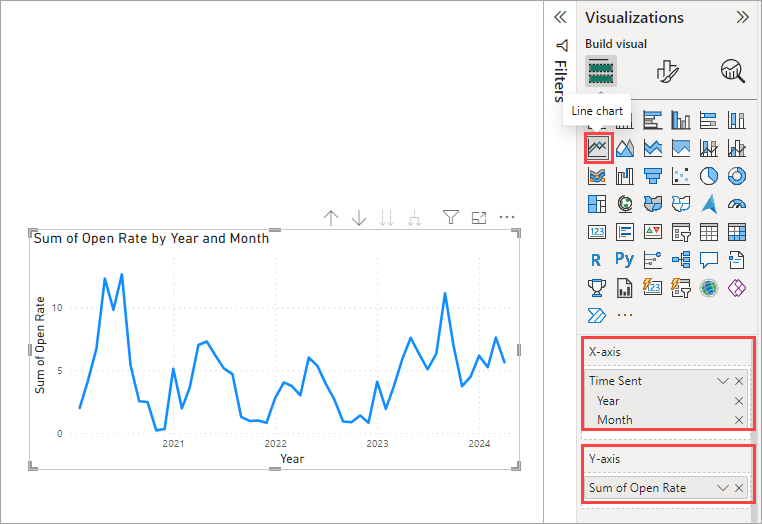
- Create a line chart: Select the line chart icon from the Visualization pane. For the X-axis, select your time-series data. On the Y-axis, add your metric, like website users, ad clicks, or click-through rates.

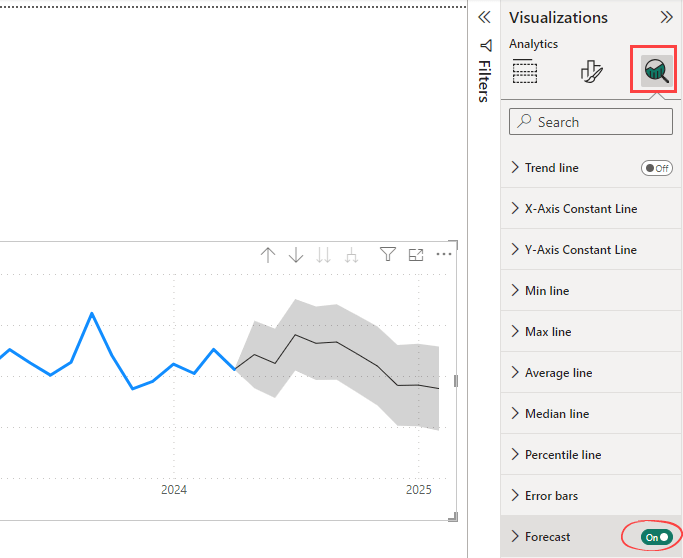
- Apply forecast: Select your line chart, then click the Analytics pane in the Visualization area. In the Forecast section, toggle the forecast button to On.

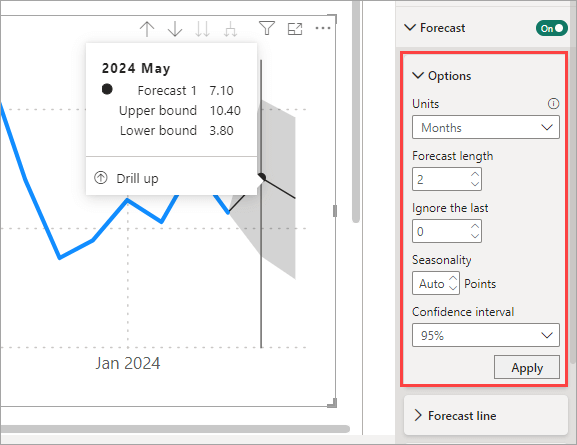
- Adjust forecast: Fine-tune its accuracy by adjusting Units, Seasonality, Confidence Interval, and other options.

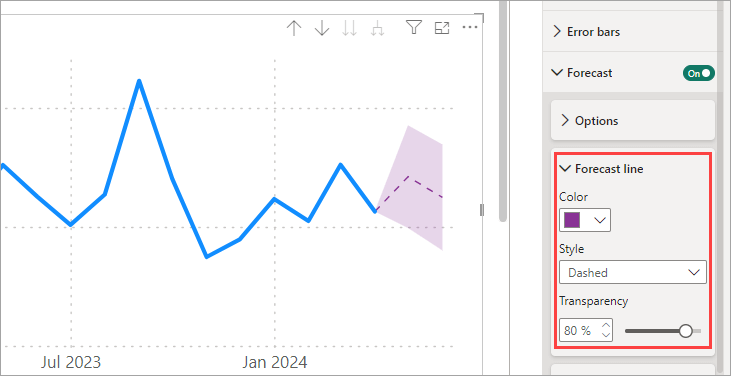
- Customize the forecast line: If you want, change the line style, color, and transparency, allowing for a more tailored visual representation of your forecast data.

That’s it! You’re now set to create insightful forecasts with Power BI.
Power BI predictive analytics examples in different industries
Predictive analytics is a powerful tool, but it’s not suitable for everyone. Businesses selling products that people buy on impulse might not benefit much. These tools work best when purchases happen through deliberate, planned decisions. So, if your business involves thoughtful buying decisions, predictive analytics can be a game-changer.
With Power BI, you can apply predictive analytics that can be useful in many use cases across different industries.
Marketing
Predictive analytics can help forecast customer behavior and optimize marketing campaigns. Using algorithms like regression analysis, you can analyze trends to predict which customers are likely to convert. Clustering models help segment customers, allowing for tailored marketing strategies that effectively reach the right audience.
Finance
Time-series forecasting in Power BI can be used to predict stock movements or interest rates. This helps financial analysts make smart decisions by anticipating market changes. Algorithms such as decision trees and random forests assess credit risk and detect fraudulent activities, enhancing security and decision-making processes.
Healthcare
Predictive analytics in healthcare improve patient outcomes and operational efficiency. Classification models are employed to predict patient readmission rates and potential disease outbreaks. Hospitals can better plan resources and improve patient care by analyzing historical data.
Additional applications include:
- Mental health management.
- Fall prediction and prevention.
- Early detection of sepsis.
- Identifying high-risk groups for targeted interventions and testing.
Entertainment
In the entertainment industry, predictive analytics helps to understand audience preferences and optimize content delivery. By using recommendation algorithms, platforms can suggest shows or movies based on users’ viewing history and interactions. This enhances the user experience with personalized content recommendations.
Should you do predictive analytics in Power BI or another tool?
There are a large number of ML frameworks and other analytics tools/services available for building applications that operationalize predictive analytics. We’ll cover the most common tools and provide a quick comparison.
1: Power BI
The Power BI platform is known for its user-friendly interface, which makes it suitable for both beginners and experienced users. It is particularly strong in data visualization, making it easy to interpret complex data. Check out our Power BI guide to learn more.
Additionally, its seamless integration with other Microsoft products makes it the top choice for those already familiar with this ecosystem. Advanced users can leverage R and Python scripts for deeper analytics. Moreover, its integration with Azure ML enhances machine learning capabilities.
If you’re working with big data, you can connect Power BI with Azure’s robust cloud infrastructure. Azure Synapse Analytics, for example, provides powerful data integration and analysis capabilities, enabling Power BI predictive analytics to perform at scale.
2: GCP services
Looker Studio offers similar features to Power BI, particularly regarding visualization capabilities and an intuitive user interface. This similarity makes Looker Studio a competitive choice for organizations familiar with Google’s ecosystem.
Looker Studio’s strength lies in its seamless integration with other Google services, such as BigQuery and Vertex AI, which significantly enhance its predictive capabilities. BigQuery provides robust data warehousing solutions for managing and analyzing large datasets, while Vertex AI offers a comprehensive platform for building, deploying, and scaling machine learning models. These integrations enable users to perform complex predictive analytics tasks efficiently.
3: AWS services
AWS services offer powerful tools for predictive analytics, particularly through Amazon SageMaker and Amazon Forecast.
Amazon SageMaker is a comprehensive machine learning service that enables developers to build, train, and deploy predictive models at scale. It simplifies the entire machine learning workflow, from data labeling and preparation to model training and tuning, making it suitable for organizations looking to manage large datasets and complex analytical requirements.
Amazon Forecast, on the other hand, is designed specifically for time series forecasting. It uses machine learning to deliver highly accurate predictions, allowing businesses to anticipate future trends and make informed business decisions. This service is particularly valuable for industries reliant on precise demand planning and inventory management.
4: Python and scikit-learn
Scikit-learn is an ML library in Python known for its easy-to-use API and powerful machine-learning algorithms. Python libraries such as NumPy and Pandas are also crucial for data preparation and manipulation, allowing you to clean and analyze data efficiently. This combination makes Python and scikit-learn a great choice for tackling data science projects.
5: TensorFlow and Keras
TensorFlow is an open-source platform for machine learning that excels at handling large-scale computations. Built on top of TensorFlow, Keras is a deep learning API that simplifies building neural networks. Together, they are great for creating complex models like deep neural networks and linear regression. With strong community support, they offer a solid framework for predictive analytics projects.
Effective data preparation with Power BI and Coupler.io
Microsoft Power BI is a powerful business intelligence tool with robust predictive analytics features. With predictive analytics in Power BI, you can predict future events using DAX, R/Python integration, built-in visuals, and Azure ML connectivity. While building models is critical, preparing high-quality, reliable data is equally crucial.
Coupler.io can serve as a valuable data integration tool in this process, helping you pull data from cloud sources into Power BI. This is especially useful if you’re working with marketing platforms that are not natively supported by Power BI’s default connectors.
Automate reporting in Power BI with Coupler.io
Get started for free