

Picture this: You want to analyze a table, but some columns are missing, which are present in another table. In Excel, you can use the VLOOKUP function to get those values.
But what about Power BI?
This beginner-friendly article covers how to replicate the same function in Power BI, along with examples.
Can you use the VLOOKUP formula in Power BI?
No, the platform does not support the VLOOKUP formula by default. Therefore, you can not use it directly in Power BI in the same way as in Excel. However, you can recreate the same formula in other ways to perform VLOOKUP in Power BI.
Other options to perform VLOOKUP
In Power BI, you can substitute the VLOOKUP function in such ways:
- Use DAX formulas – Create a calculated column using the RELATED and LOOKUPVALUE functions to get the required values. This method works on top of the existing dataset and may take time to load on each data refresh.
- Merge tables using Power Query – You can merge tables with a common column and extract the required data. The value look-up works at the query level, and the new column is created during data load.
- Perform VLOOKUP before loading data – You can do this using Coupler.io, a reporting automation platform. It allows you to export data from 60+ apps and perform various transformations (such as joining datasets) before loading data into Power BI. Therefore, it does not affect the reporting performance.
In the following sections, we’ll explain each method with examples.
How to do VLOOKUP in Power BI using DAX?
In Power BI, you can use DAX (data analysis expressions) formulas to create new calculated columns in existing datasets. In particular, use the built-in functions in DAX to reference other tables and retrieve values.
For example, let’s say we have loaded two datasets: one containing sales records and the other containing order status. Both tables have a common column (i.e., order ID), as shown below.

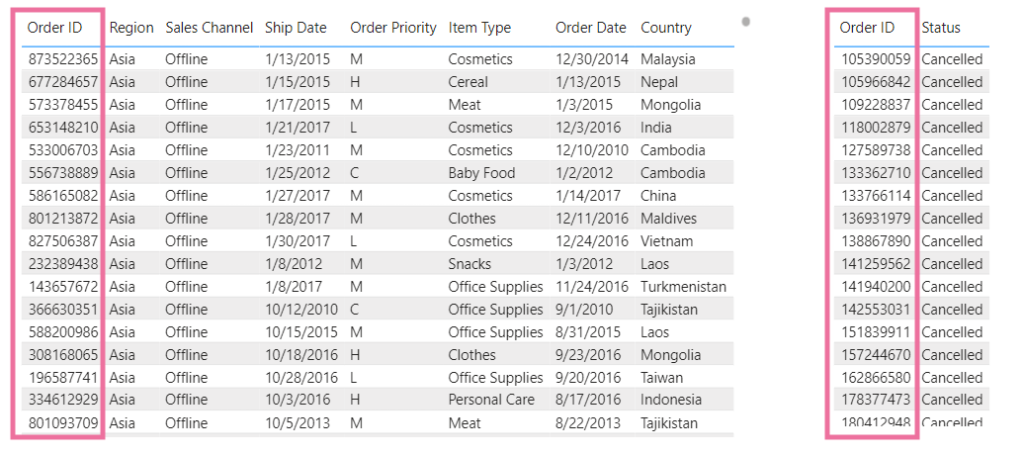
Now, let’s see how to use DAX functions to get the order status from the other table.
RELATED function
You can use it as a vertical lookup function for tables that are related. This requires a common column included in both tables with unique values.
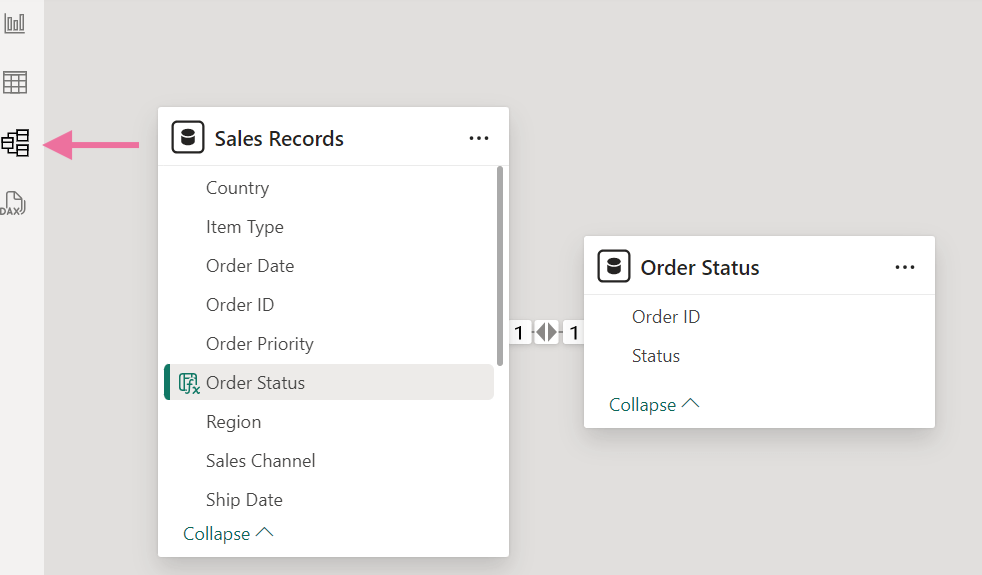
You can view and define relationships between tables from the Model tab on the left. Power BI automatically created relationships between the tables in this example since they share a common column.

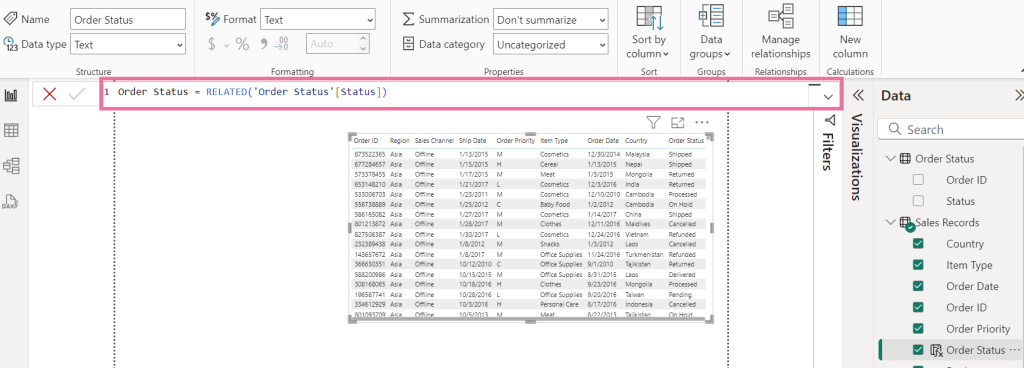
Once the relationship is established, select the dataset you want to add a new column to. Go to the Table tools tab and click the New column.


In the formula bar, enter the following:
Order Status = RELATED(‘Order Status’[Status])
This will create a new calculated column for Order Status with values from another table. Modify the above formula as per the table and column name you want to look up.

LOOKUPVALUE function
You can use the LOOKUPVALUE function for tables with no relationship between them. It helps you get columns’ values that match certain criteria.
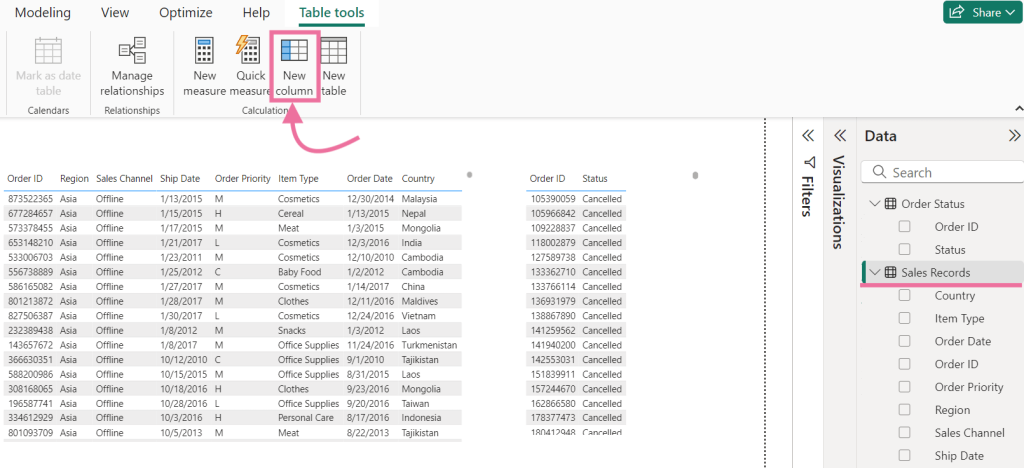
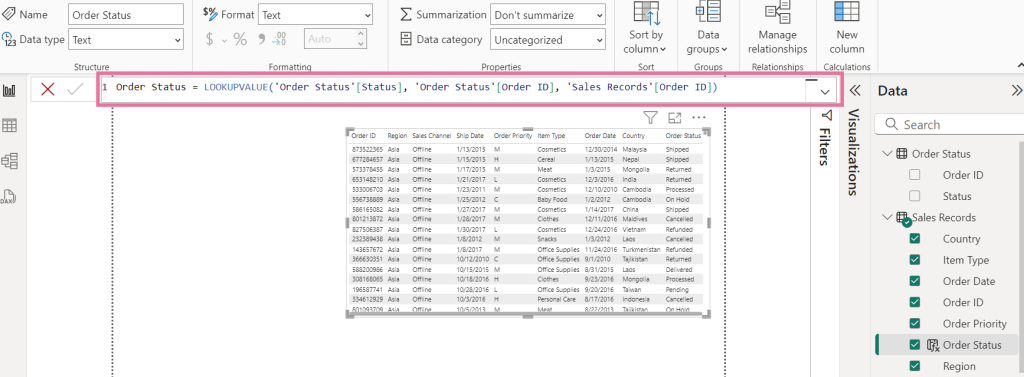
To use this alternative VLOOKUP function in Power BI, select the dataset and go to Table tools > New column.
Now, use this formula:
Order Status = LOOKUPVALUE(‘Order Status’[Status], ‘Order Status’[Order ID], ‘Sales Records’[Order ID] )
Let’s break down its syntax:
- The first parameter is the [result_columnname] containing the required value (i.e., order status value)
- The second parameter is [search_columnname] that you want to search for (i.e., order ID in Order Status)
- The third parameter is the [search_value] that you want to search for (i.e., order ID from Sales Records)
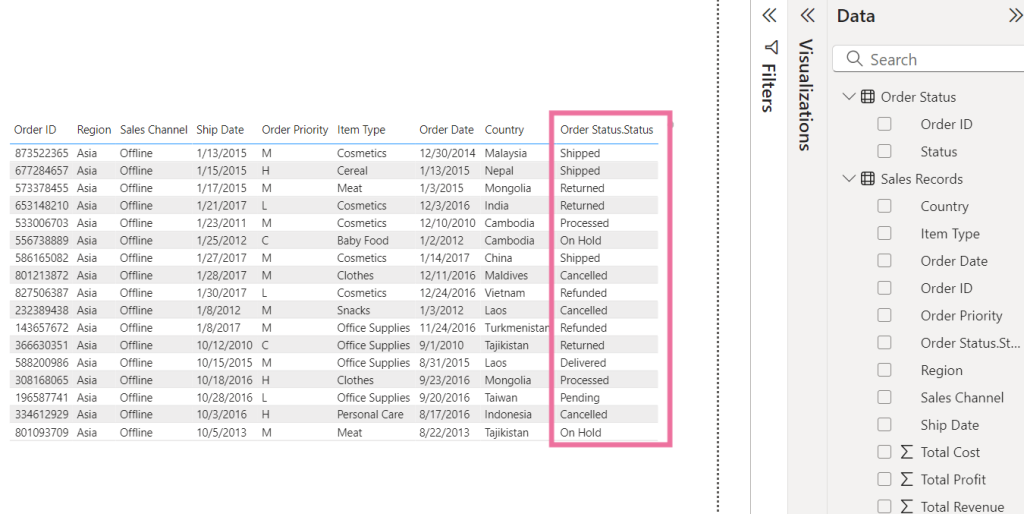
It will look for exact matches for Order ID columns between the table and get the status values as shown below.

Optionally, you can also define an alternate result to handle errors in cases of multiple matches. This is useful in tables containing duplicate values.
Further, you can use this method to perform lookups with multiple criteria. To learn more about it, follow this detailed tutorial on Power BI LOOKUPVALUE.
How to use Power Query to merge tables and lookup values?
One good way to perform Power BI VLOOKUP is to merge tables and extract the required values. You can do this by opening the existing dataset in the Power Query editor.
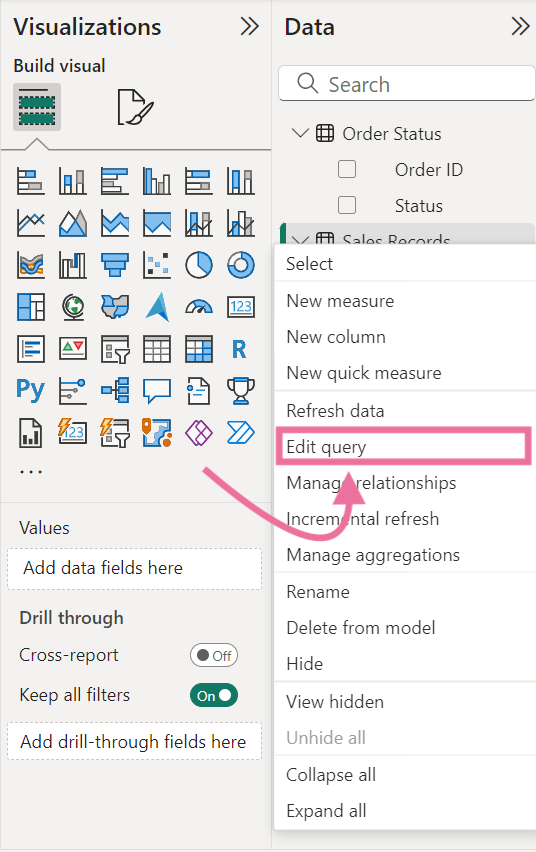
In the data pane, click on three dots beside the dataset name and select Edit query.

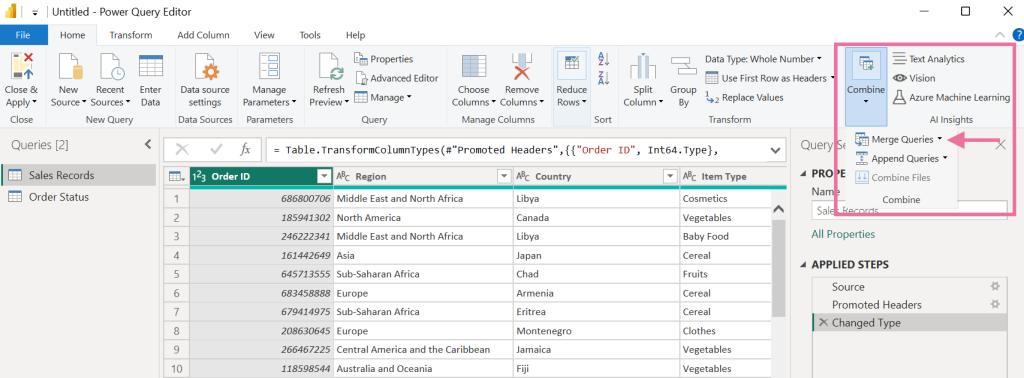
Now, the Power Query editor interface will open with the existing queries in the data model. In the Home tab, click on Combine and select Merge Queries.

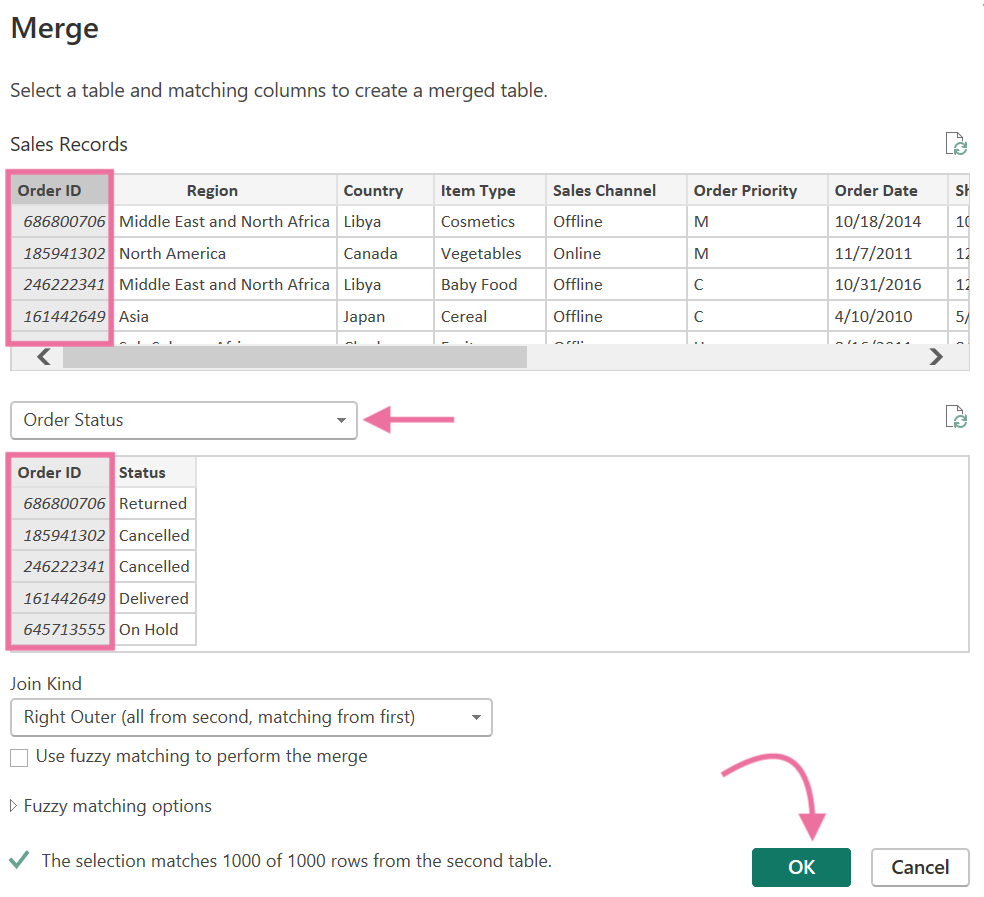
Now, you’ll need to select the matching columns and table you want to merge.
For example, here, we have selected the Order Status table to be merged with the existing dataset and selected Order ID as the matching column in both tables.
You can also choose the table join type, depending on the columns you want to get as a result. For example, here, we have selected Right outer so that all columns from the Order Status table are displayed.
Click OK to save.

Now, this will add a column to the existing dataset with values as nested tables. To extract the required values from the table, click the expand icon next to the column name (as shown below) and choose the value to keep.

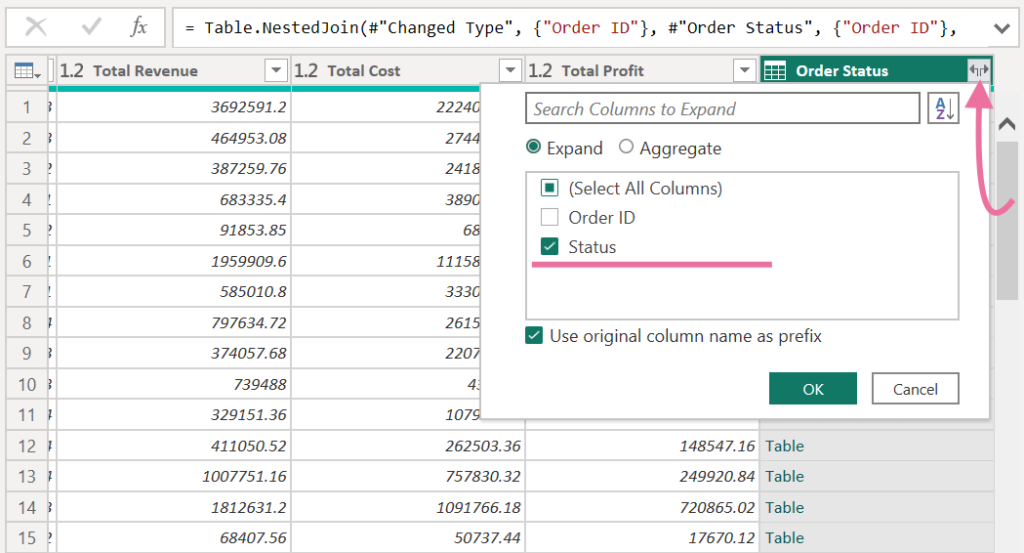
This will add the required value to the existing dataset, and you can use it directly without any formulas.

Merge and VLOOKUP data before loading it into Power BI
You can export data from your cloud sources using Coupler.io, join them to perform VLOOKUP within the platform’s ETL interface, and then load the analysis-ready dataset into Power BI.
To get started, select your data source in the form below and click Proceed.

Sign up for a Coupler.io account (no credit card is required).
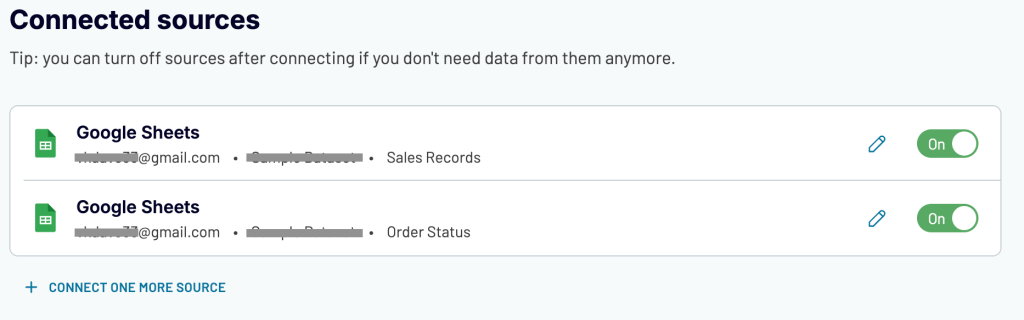
Follow the in-app instructions to complete the data source setup. Then connect additional data sources to the importer. For example, we connected two Google Sheets spreadsheet data from which we need to aggregate and look up vertically.

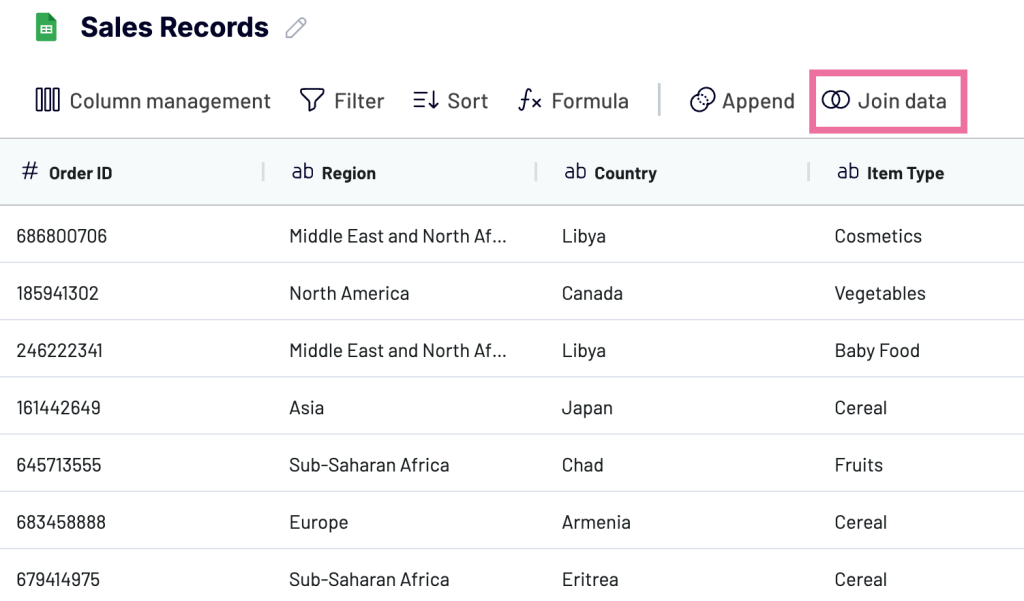
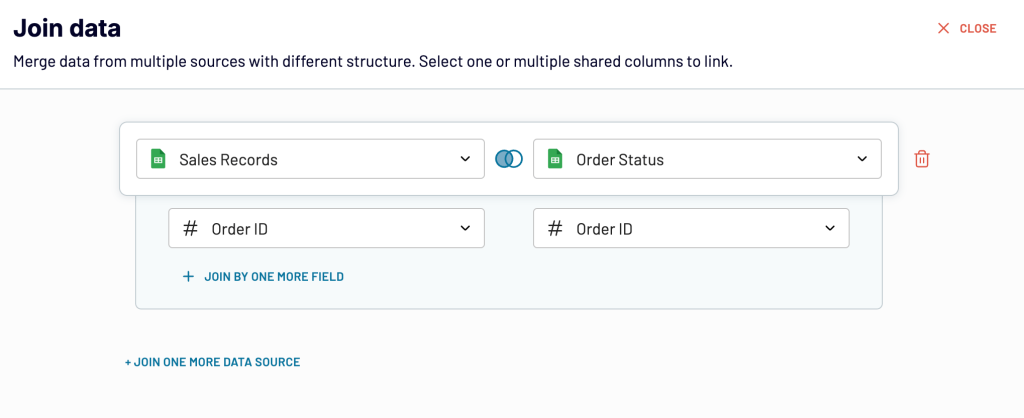
In the data transformation module, you’ll get a preview of the information from each connected data source. Click the Join data option to merge the datasets from different sources.

Now, select the data sources you want to merge and the columns that are shared between them. In this example, the Order ID column is common to both data sources.

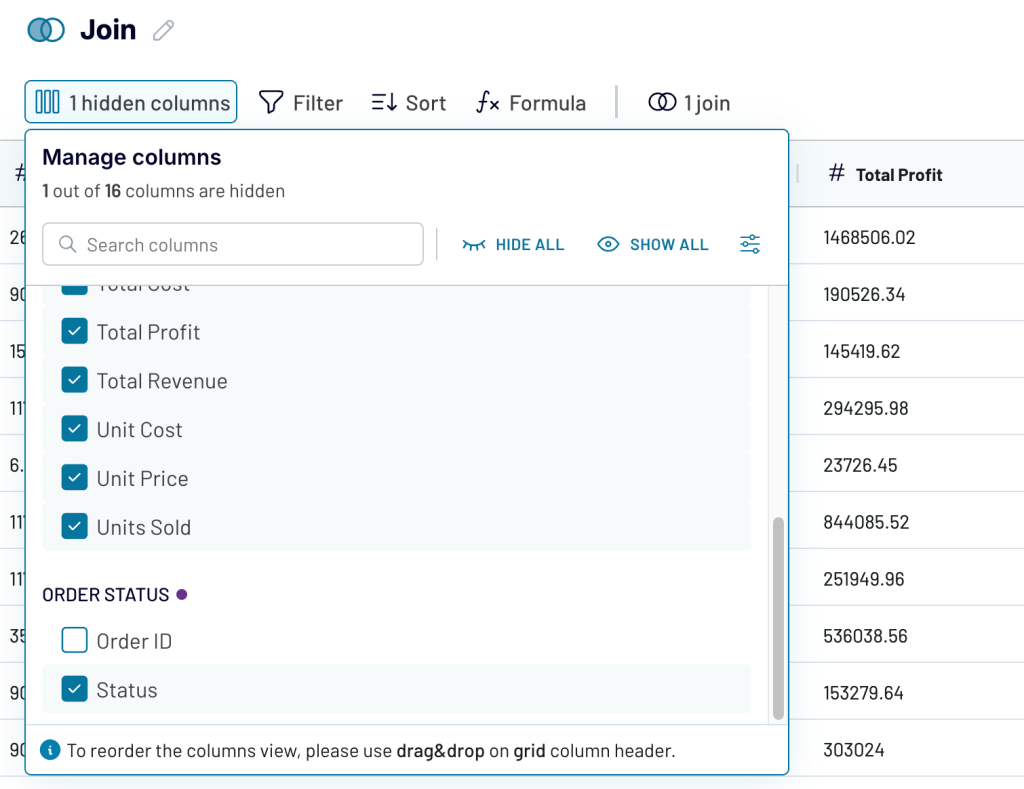
Once done, you’ll see the merged data containing columns from both tables. You can find formatting options like:
- Hiding specific columns
- Filtering or sorting data
- Renaming columns
- Creating calculated columns
In this example, we removed the Order ID column from the second sheet since it was duplicated.

Once everything looks good, select the data view and copy its importer URL.
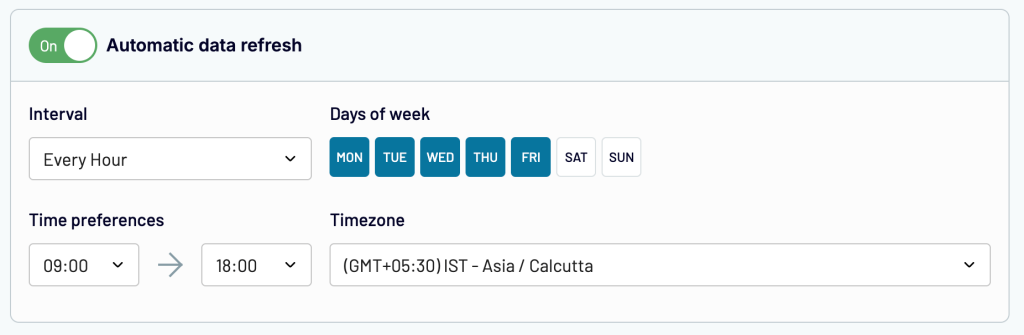
Optionally, you can set up a schedule to auto-refresh this data in Power BI as often as every 15 minutes. This allows you to keep your Power BI reports and dashboards up-to-date.

Run the importer. Go to Power BI Desktop, navigate to Get data > Web and use the copied URL to load the data. Here’s the final result:

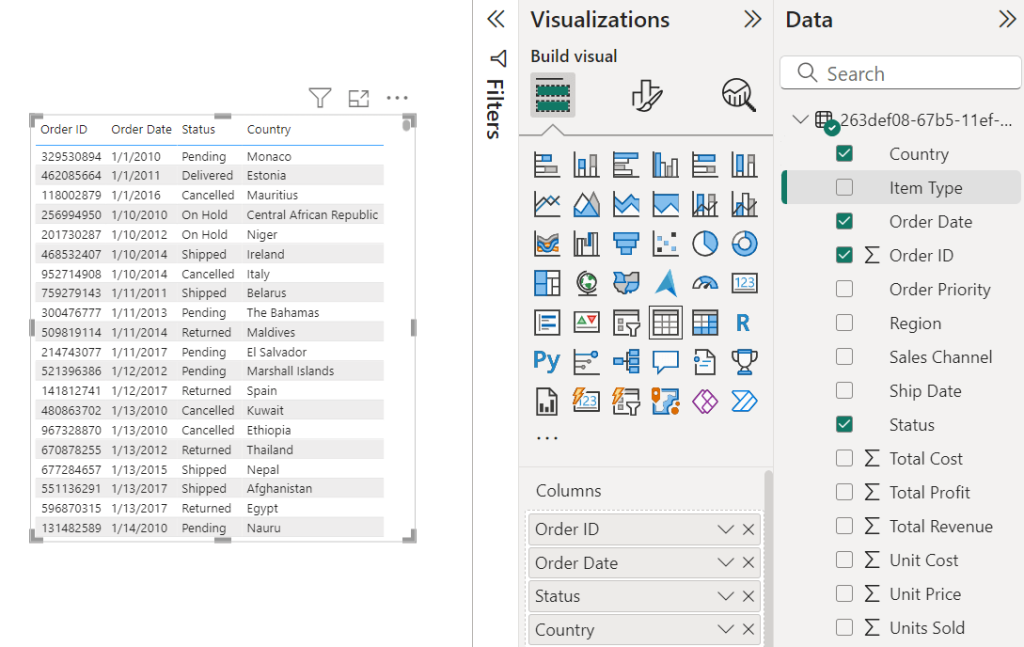
The good part is that data merging occurs outside Power BI. Plus, this method makes it easy to connect to various data sources that are not natively supported.
Which method should you use in special scenarios?
In Power BI, there are various ways to achieve results similar to what you can get with the VLOOKUP formula in Excel. Let’s see which method is the best for specific scenarios.
Perform Power BI VLOOKUP from another table
You can use the RELATED DAX function if the tables have a shared column.
However, the best practice is to avoid calculated columns using DAX with large datasets since they can slow down the reports. Therefore, it’s recommended to merge tables using Power Query or platforms like Coupler.io for efficient reporting. We’ve already explained how to do this in the previous sections.
Perform Power BI VLOOKUP with multiple criteria
You can use the LOOKUPVALUE function. It supports multiple conditions inside it to find the matching rows.
FAQs
What is VLOOKUP in Power BI?
The VLOOKUP is a function used in spreadsheet apps like Excel or Google Sheets that searches for a value in one column to get the value of another in the same row. It helps search for specific data in a table using a single row value. There is no default support for the VLOOKUP formula in Power BI.
What is the VLOOKUP equivalent in DAX?
In Power BI, the LOOKUPVALUE DAX function is equivalent to VLOOKUP. You can use it to look up a column value in any table by matching conditions. RELATED is also a good option, but it only works for tables with relationships (at least one shared column).
What is the difference between RELATED and LOOKUPVALUE?
The RELATED function can only be used to get values from related tables. On the other hand, you can use LOOKUPVALUE to find values that match any specified conditions, e.g., matching another column value.
VLOOKUP in Power BI: Summary
You rarely have all the columns you need to analyze in one dataset. Thankfully, you can use various methods in Power BI to get those missing values (similar to using VLOOKUP in Excel).
One important point: the method you choose for replicating VLOOKUP could directly affect reporting performance. For example, the DAX formulas can slow down reports since they’re calculated on top of the dataset.
Therefore, if you’re working with large datasets, you should merge them to get the desired values. You can use Coupler.io to join the data outside Power BI and improve the reporting efficiency. It also helps you automate connections with 60+ apps.
Automate reporting with Coupler.io
Get started for free