Data isn’t always pretty. Although it would be best to have clean data, real-world data is often messy and disorganized. Most of us work with a chaotic jumble of text files, Excel sheets, and other scattered sources.
Before you even start to think about crafting stunning visuals and insightful dashboards, you need to prepare your data. This is where Power Query comes in — it can transform wild, messy data into clean, structured, and analysis-ready formats.
This guide will walk you through the essential steps of using Power Query in Power BI, from importing data to performing crucial data transformations.
What is Power Query in Power BI?
Power Query is the ETL engine within Microsoft Power BI. It allows you to Extract, Transform, and Load data from various sources, enabling efficient data cleaning, shaping, and integration for analysis and reporting.
- Extract: Power Query’s ability to connect to a wide range of data sources is simply unparalleled. It seamlessly integrates with Microsoft products such as Azure, Sharepoint, and SQL Server, which is a significant advantage. But that’s just the beginning. Power Query also works well with non-Microsoft data sources including IBM DB2, MySQL, and Google BigQuery, as well as various online services like Salesforce, Google Analytics, and Databricks.
- Transform: Your real-world data is often scattered across numerous files when what you need is a single, unified file. Your data might be incomplete, contain duplicates, or contain unnecessary rows and columns. However, once you’ve got your data into Power Query, the real magic begins. This tool enables you to easily apply both simple and complex data transformations. These operations are made possible by the M language, a scripting language created specifically for data manipulation in Power Query.
- Load: After you’ve transformed your data, the next step is loading it into the Power BI data model. Your data is compressed and stored efficiently in memory, ensuring your reports and dashboards run smoothly, even when you’re dealing with large datasets.
Now that we understand what Power Query can do, let’s see how to open it in Power BI.
How to open Power Query in Power BI
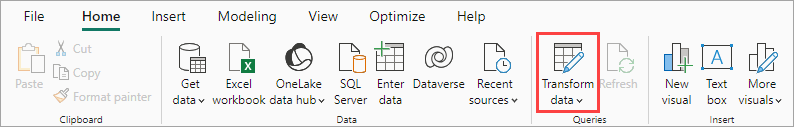
Power Query for data transformation is mainly used through the Power Query Editor. To access it in Power BI Desktop, click Transform data in the Home tab.

The Power Query Editor will open in a separate window. Its ribbon contains various groups of commands for managing and transforming your data.

Before we go further into the Power Query Editor, let’s import data into Power BI.
How to get data
Getting data from your data sources is typically your first step with Power Query.
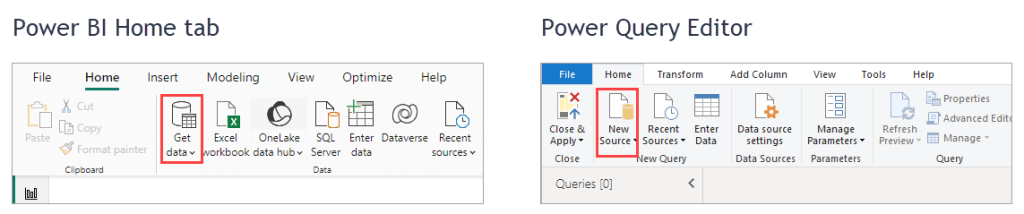
To start, you can either click the Get data button in the Power BI Home tab, or the New Source button in the Power Query Editor.

Note: Both buttons provide access to Power Query’s “Get Data” features, which allow you to connect to a wide range of data sources, from files and databases to online services and other types.
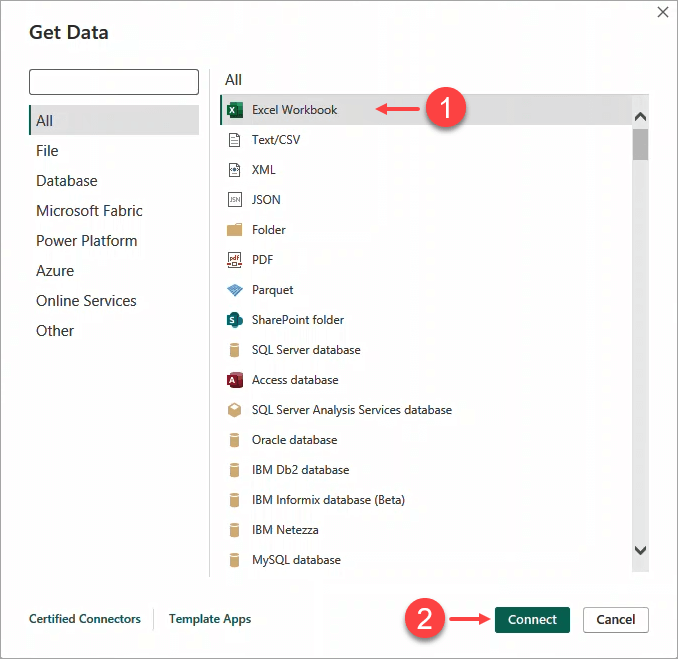
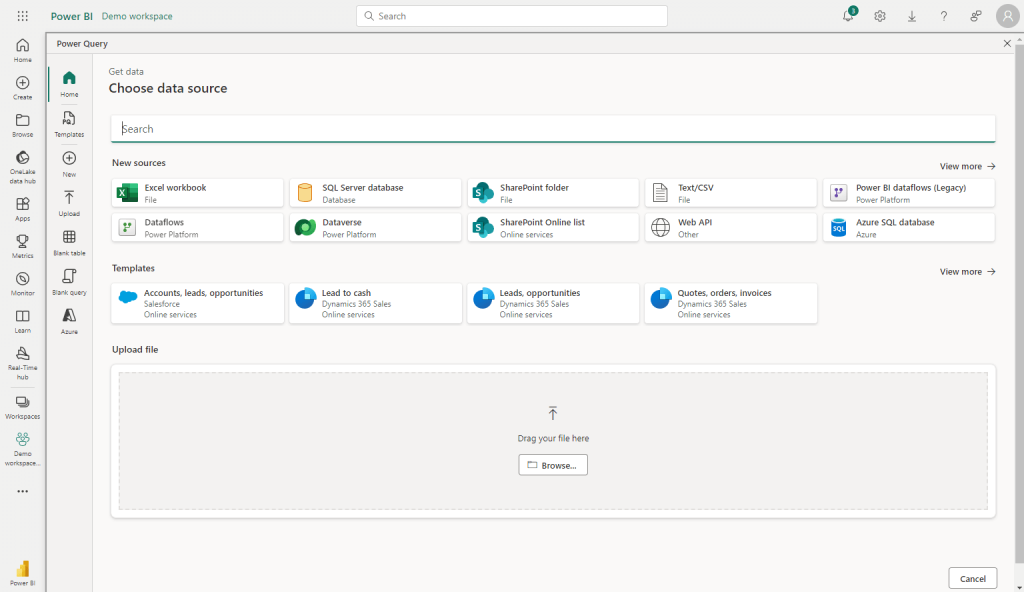
In the Get Data window that appears, select your data source. For example, if you want to import data from an Excel file, select Excel Workbook and click Connect.

For loading data from cloud apps and sources, consider using Coupler.io. It’s a reporting automation solution that supports connecting to many marketing apps like Facebook Ads, Mailchimp, Google Search Console, and other sources that are not natively supported by Power Query.
Try it yourself. Select the data source you need from the drop-down list below and follow the in-app instructions to set up the connection and automate data load to Power BI.

Moreover, it offers dynamic dashboard templates in Power BI that can be a game-changer for your reporting efficiency.
With your data source connected, a Navigator window pops up, generally looking like the one in the following screenshot. When connecting to an Excel workbook, you should see all the worksheets in the workbook (our example file has only one worksheet). If your file has multiple worksheets, you could select multiple worksheets at the same time for importing.

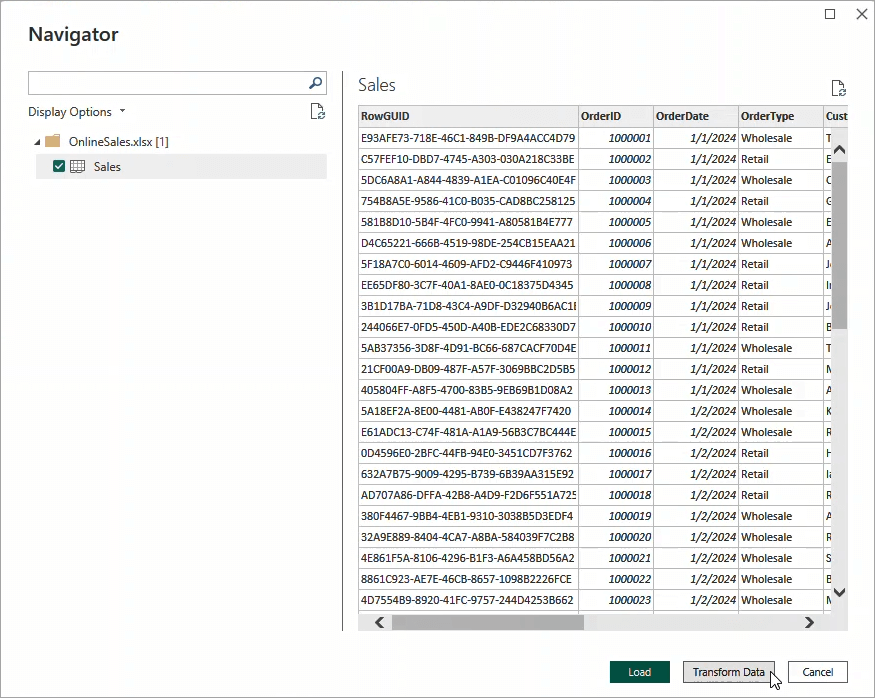
Once you’ve chosen a worksheet, you’ll notice that the Load and Transform Data buttons are no longer grayed out. Clicking Load will take the data exactly as it appears in the preview and load it into the data model. However, it’s always a good idea to double-check your data by clicking Transform Data to ensure that it is shaped and typed the way you want it.
Here’s what you’ll see when you click Transform Data:

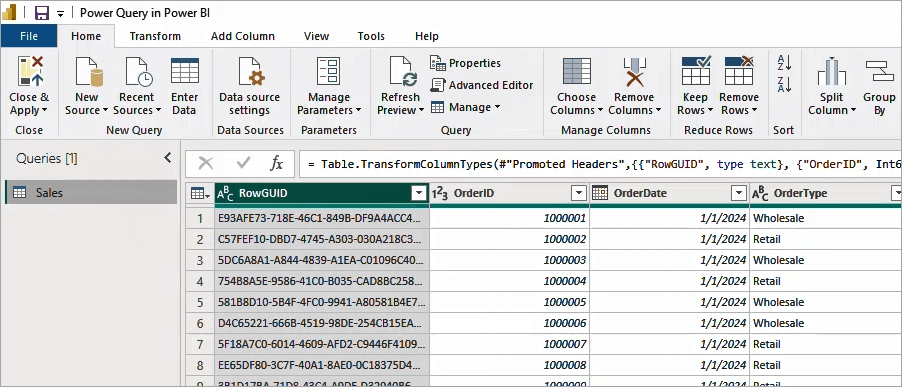
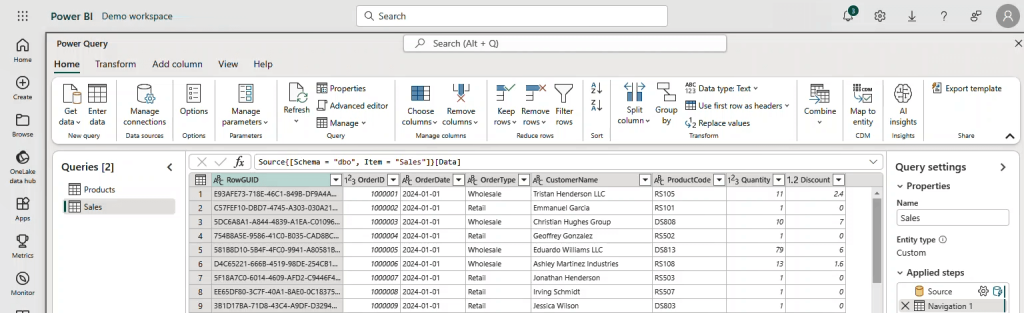
The Power Query Editor shows a preview of your data with many transformation options. You can see the query list (left pane) and the applied transformation steps for a query (right pane). A query is a data element that will be imported into your data model.
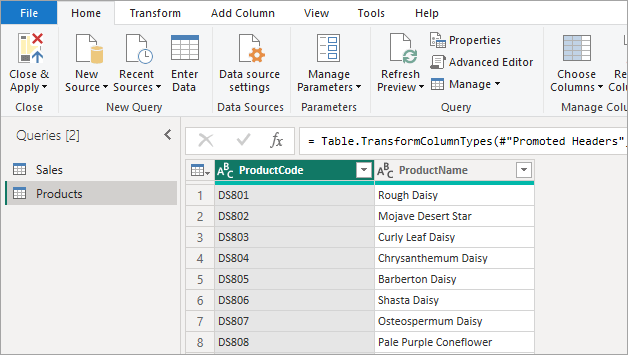
If you wish, you can add additional data sources by clicking the New Source button in the toolbar. This will enable you to integrate multiple data from different sources. For example, here we added Products data from a CSV file — notice that now there are two queries (Sales and Products) in the left pane:

Using Power Query Editor, you can apply transformations to your data, such as changing data types, filtering rows and columns, and merging tables. We’ll show you how in the following sections.
The Power Query ribbon
Just by clicking around the ribbon, you’ll see there are many ways to transform your data. For this tutorial, we’ll focus on the buttons around the Home, Transform, and Add Column tabs of the ribbon.
The Home tab
The Home tab in Power Query is quite intuitive. The buttons are categorized into several sections:

Let’s highlight some of the important buttons in this tab.
- Close & Apply: Applies all modifications and refreshes affected data. If you click the drop-down arrow, you’ll see three options:
- Close & Apply: Applies changes and closes Power Query.
- Apply: Applies changes without closing Power Query.
- Leave: Does not apply changes; warns about unapplied changes.
- New Source: Imports new data. Clicking the icon shows the full data source selection menu while clicking the drop-down arrow displays common data sources.
- Recent Sources: Allows you to quickly connect to recently used data sources.
- Data Source Settings: This button opens a window that allows you to manage data sources and export PBIDS files.
- Manage Parameters: Allows you to create, view, and edit parameters. Parameters change how data is interacted with in specific contexts.
- Refresh Preview: Updates the preview of the highlighted query with current data.
- Data Type: Changes the data type of a selected column. Power BI autodetects data types, but manual adjustments can be made here.
- Use First Row as Headers: Sets the first row as column headers. The drop-down arrow provides the option to make headers as the first row instead.
- Replace Values: Finds and replaces values in a selected column. Common use cases include treating zeros as nulls or vice versa.
- Merge Queries: Combines queries. It works like an SQL JOIN statement.
- Append Queries: Consolidates multiple queries with the same shape and format into one longer query. It works like an SQL UNION statement.
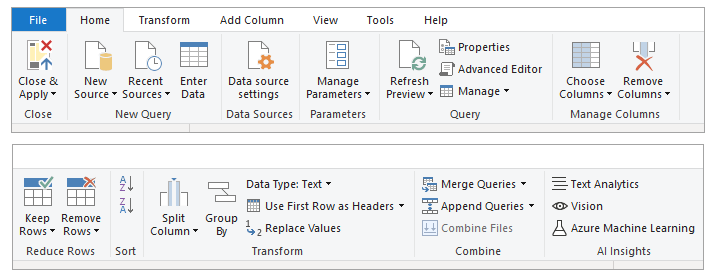
The Transform tab
The Transform tab contains some extra options for transforming your data beyond what you see in the Transform section of the Home tab. Well, Microsoft does put some redundancy into the ribbon here.
Let’s take a look at the whole Transform tab:

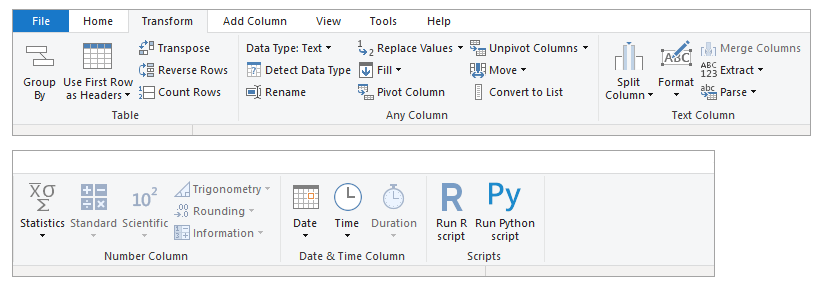
Some important buttons in this tab:
- Group By: Groups data by specified columns.
- Use First Row as Headers: Sets the first row as column headers.
- Transpose: Converts columns into rows.
- Reverse Rows: Reverses the order of rows.
- Count Rows: Displays the number of rows in a query.
- Data Type: Changes the data type of a selected column.
- Detect Data Type: Automatically assigns data types based on column previews.
- Rename: Renames a selected column.
- Replace Values: Finds and replaces values in a column.
- Fill: Fills in missing values from the top or bottom within a column.
- Pivot Column: Converts column values into new columns and recalculates values.
- Unpivot Columns: Reshapes selected columns into “attributes” and “values” columns.
- Move: Moves a column’s position within a table (left, right, to the beginning, or end).
- Convert to List: Turns a column into a list for use in custom functions.
- Split Column: Splits a column into two based on a delimiter.
- Format: Changes text formatting (e.g., lowercase, uppercase, add prefixes/suffixes).
- Merge Columns: Combines two or more columns with a chosen separator.
The Add Column tab
In the Add Column tab, you’ll notice that all functions, except for the General section, can be found elsewhere in the ribbon. The Power BI ribbon is designed with multiple areas for specific features, making it easy to find what you need since they are organized by topic.

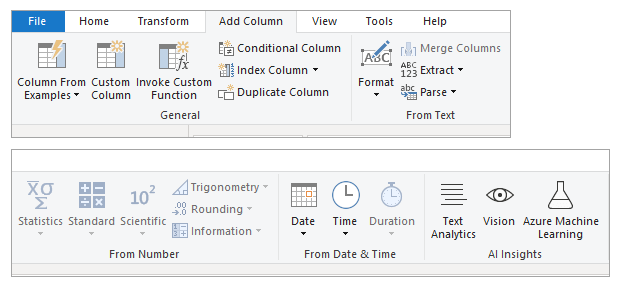
Buttons in the General section:
- Column from Examples: Auto-fills a column based on the examples you provide. It’s useful for creating new columns with specific logic.
- Custom Column: Opens a dialog box to create a custom column using M code. It helps create new columns not supported by the UI.
- Invoke Custom Function: Lets you apply a function to each value in a given column, performing specific logic along the way. For instance, you could create a function that generates a new column by taking the value of one column and multiplying it by another, placing the result in the new column.
- Conditional Column: Creates columns based on if-then-else logic.
- Index Column: Generates a column with unique values starting from 0 or 1, which can be used as key values if necessary.
- Duplicate Column: Makes a copy of the selected column.
How to use Power Query in Power BI to transform data
Power Query provides various transformations, which might appear overwhelming for new users. But don’t worry! We’ve selected straightforward, practical examples for you.
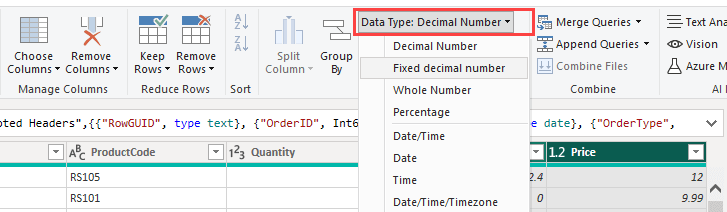
How to change column type
You may need to perform data type conversions to ensure accurate calculations and visualizations.
For example, in the following screenshot, the Price and Discount columns were imported automatically to Decimal Number. You want to change them to be in Fixed Decimal Number. To do that, select both columns and click the Data Type button to apply the new data type:

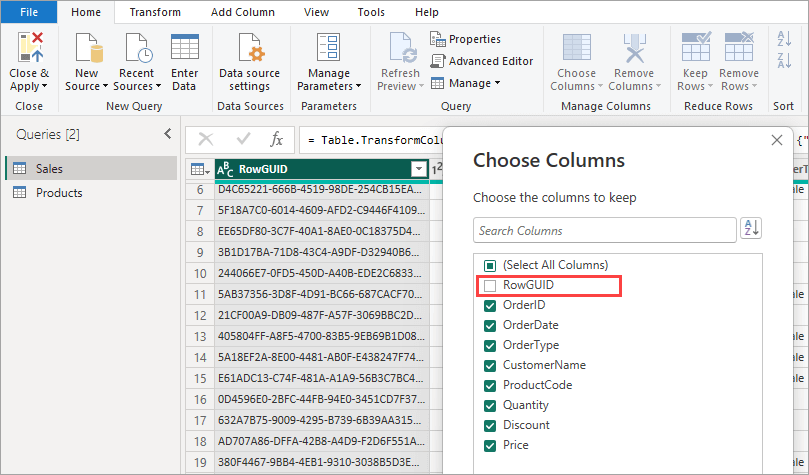
How to filter columns
To remove unnecessary columns, click the Choose Columns button on the Home tab and select only the columns you need.
For example, here we filter out the RowGUID column by unselecting its checkbox:

How to filter rows
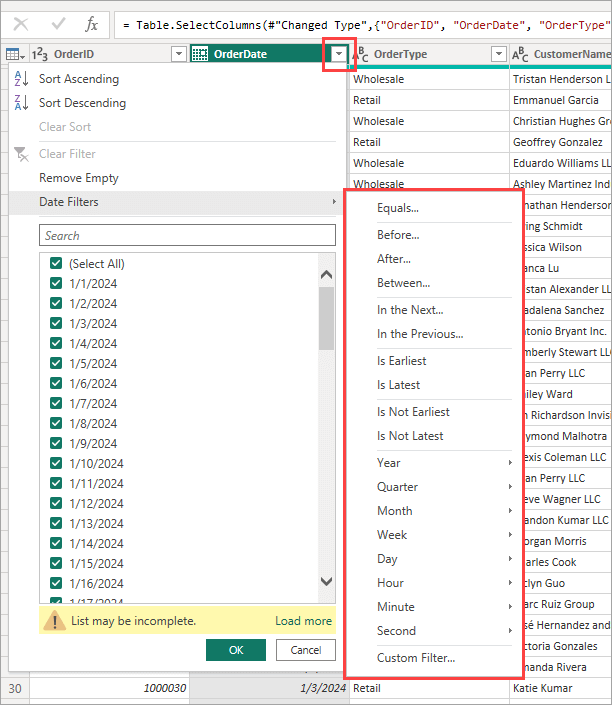
You can filter out rows by selecting the drop-down beside the column name and entering a filter condition. The type of filtering depends on the data type.
The following screenshot shows the filtering available for a Date column:

How to merge data
You may need to merge data from several tables and/or sources before you load them into the data model.
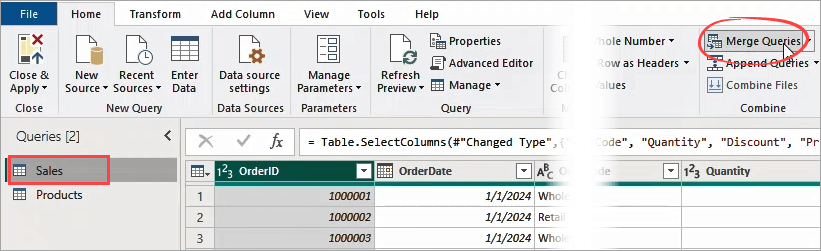
As an example, our Sales query imported from an Excel file has a ProductCode column containing product codes. We will merge these with the Products query (the lookup table) imported from a CSV file containing the product codes and the product names. This way, we can use the product names in our reports instead of the code.
To merge data in a similar scenario, select the main query (Sales) and click the Merge Queries button on the Home tab:

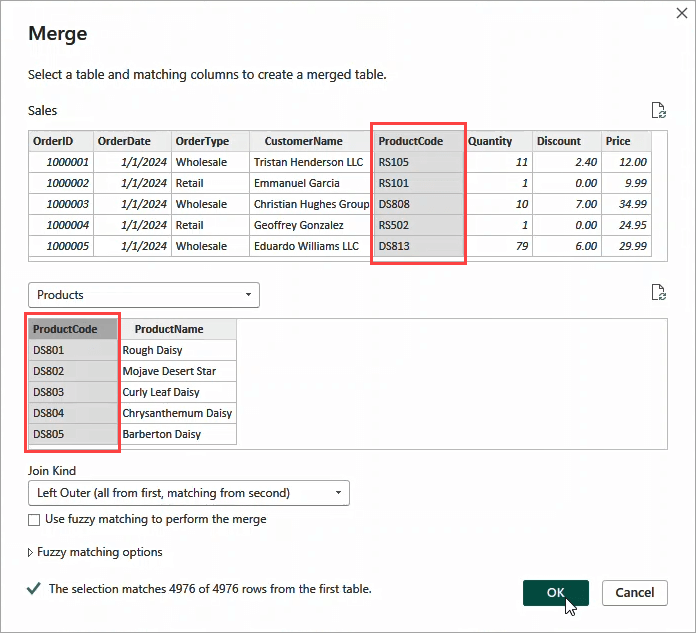
This will launch the Merge window which is where you select the lookup query and the columns that link the data together:

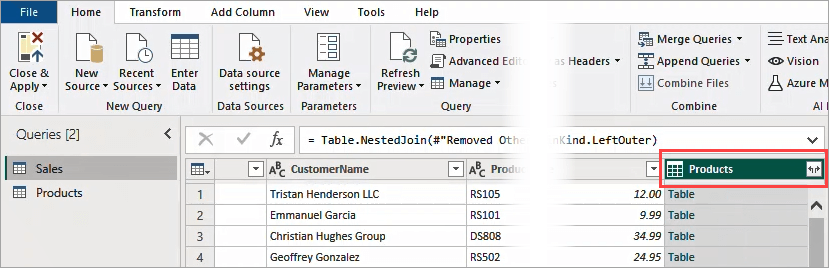
Once you merge the queries, you will see a new column containing a Table type:

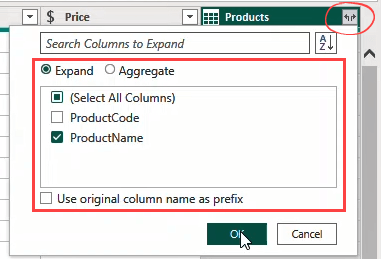
By expanding this column, you can choose which columns to keep:

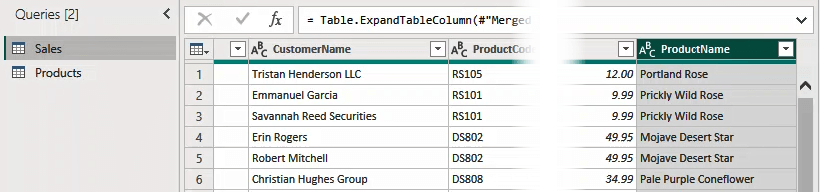
Here is the final result:

How to add calculated columns
The Add Column tab provides several options for adding a new column to a query: duplicate columns, insert an index column, merge columns, and insert a custom column.
For calculated columns, you need to select the Custom Column option. This presents you with an editor to insert the M formula used to create the column.
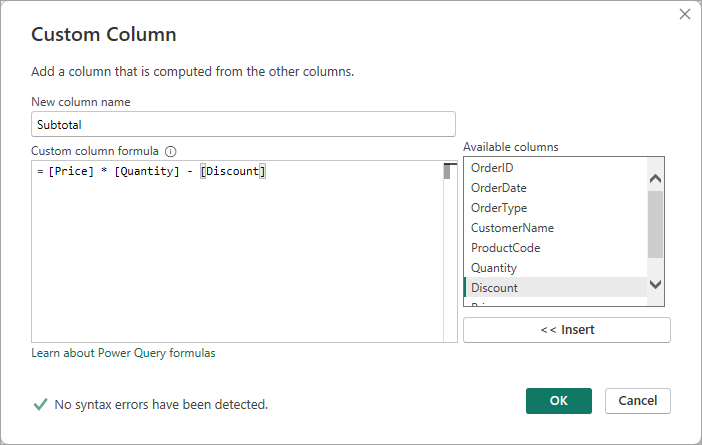
As an example, let’s say you want to add a new column Subtotal that calculates the total order based on the following formula:
| Subtotal = Price * Quantity – Discount |
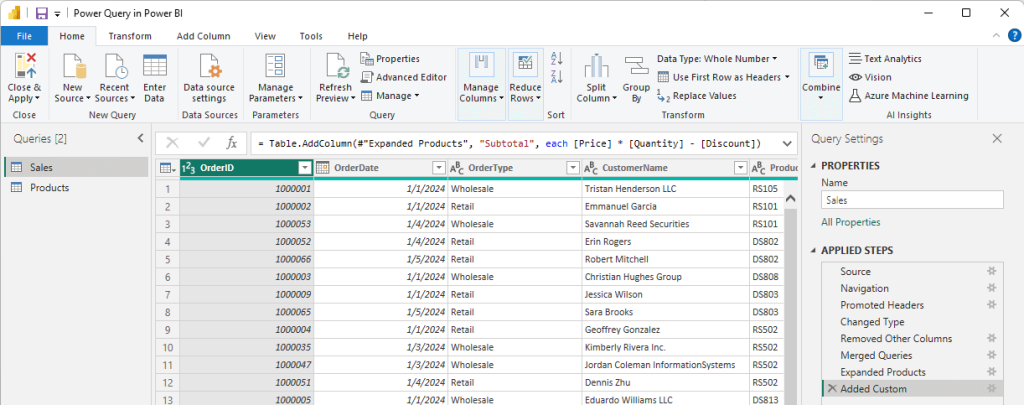
To do that, click the Custom Column button in the Add Column tab and enter the column name and formula, as shown in the following screenshot:

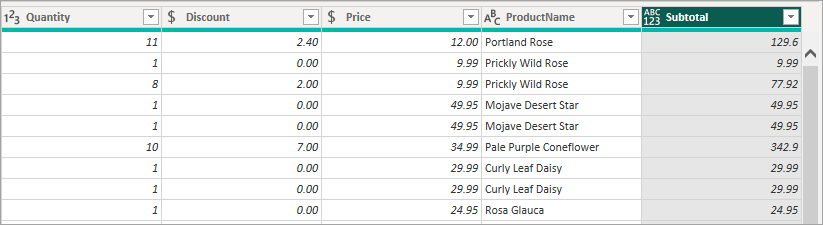
Here’s the result of the query with the custom column added:

How to manage data transformation steps
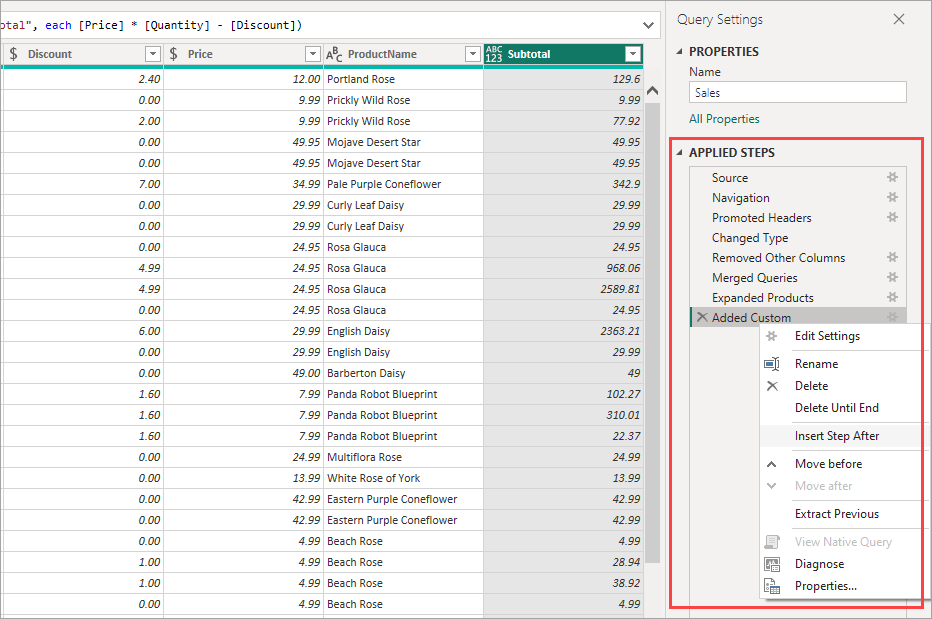
Every time you apply a data transformation step, Power Query lists the steps you have applied, which you can see in the Query Settings pane of the editor.
You can rename, rearrange, and remove steps by right-clicking the step in the list to manage the changes you make to your data:

FAQ on Power Query
How do you get data from cloud sources to Power Query?
While Power Query natively supports numerous cloud data sources, some cloud marketing sources, like Facebook Ads and Google Search Console (GSC), do not have direct connectors.
Coupler.io is an excellent solution that bridges this gap. It allows you to seamlessly connect various marketing data sources and automate data refresh on the schedule you want. This ensures your reports are always up-to-date without manual intervention. Moreover, it offers a library of ready-to-use Power BI report templates to boost your data reporting efficiency.

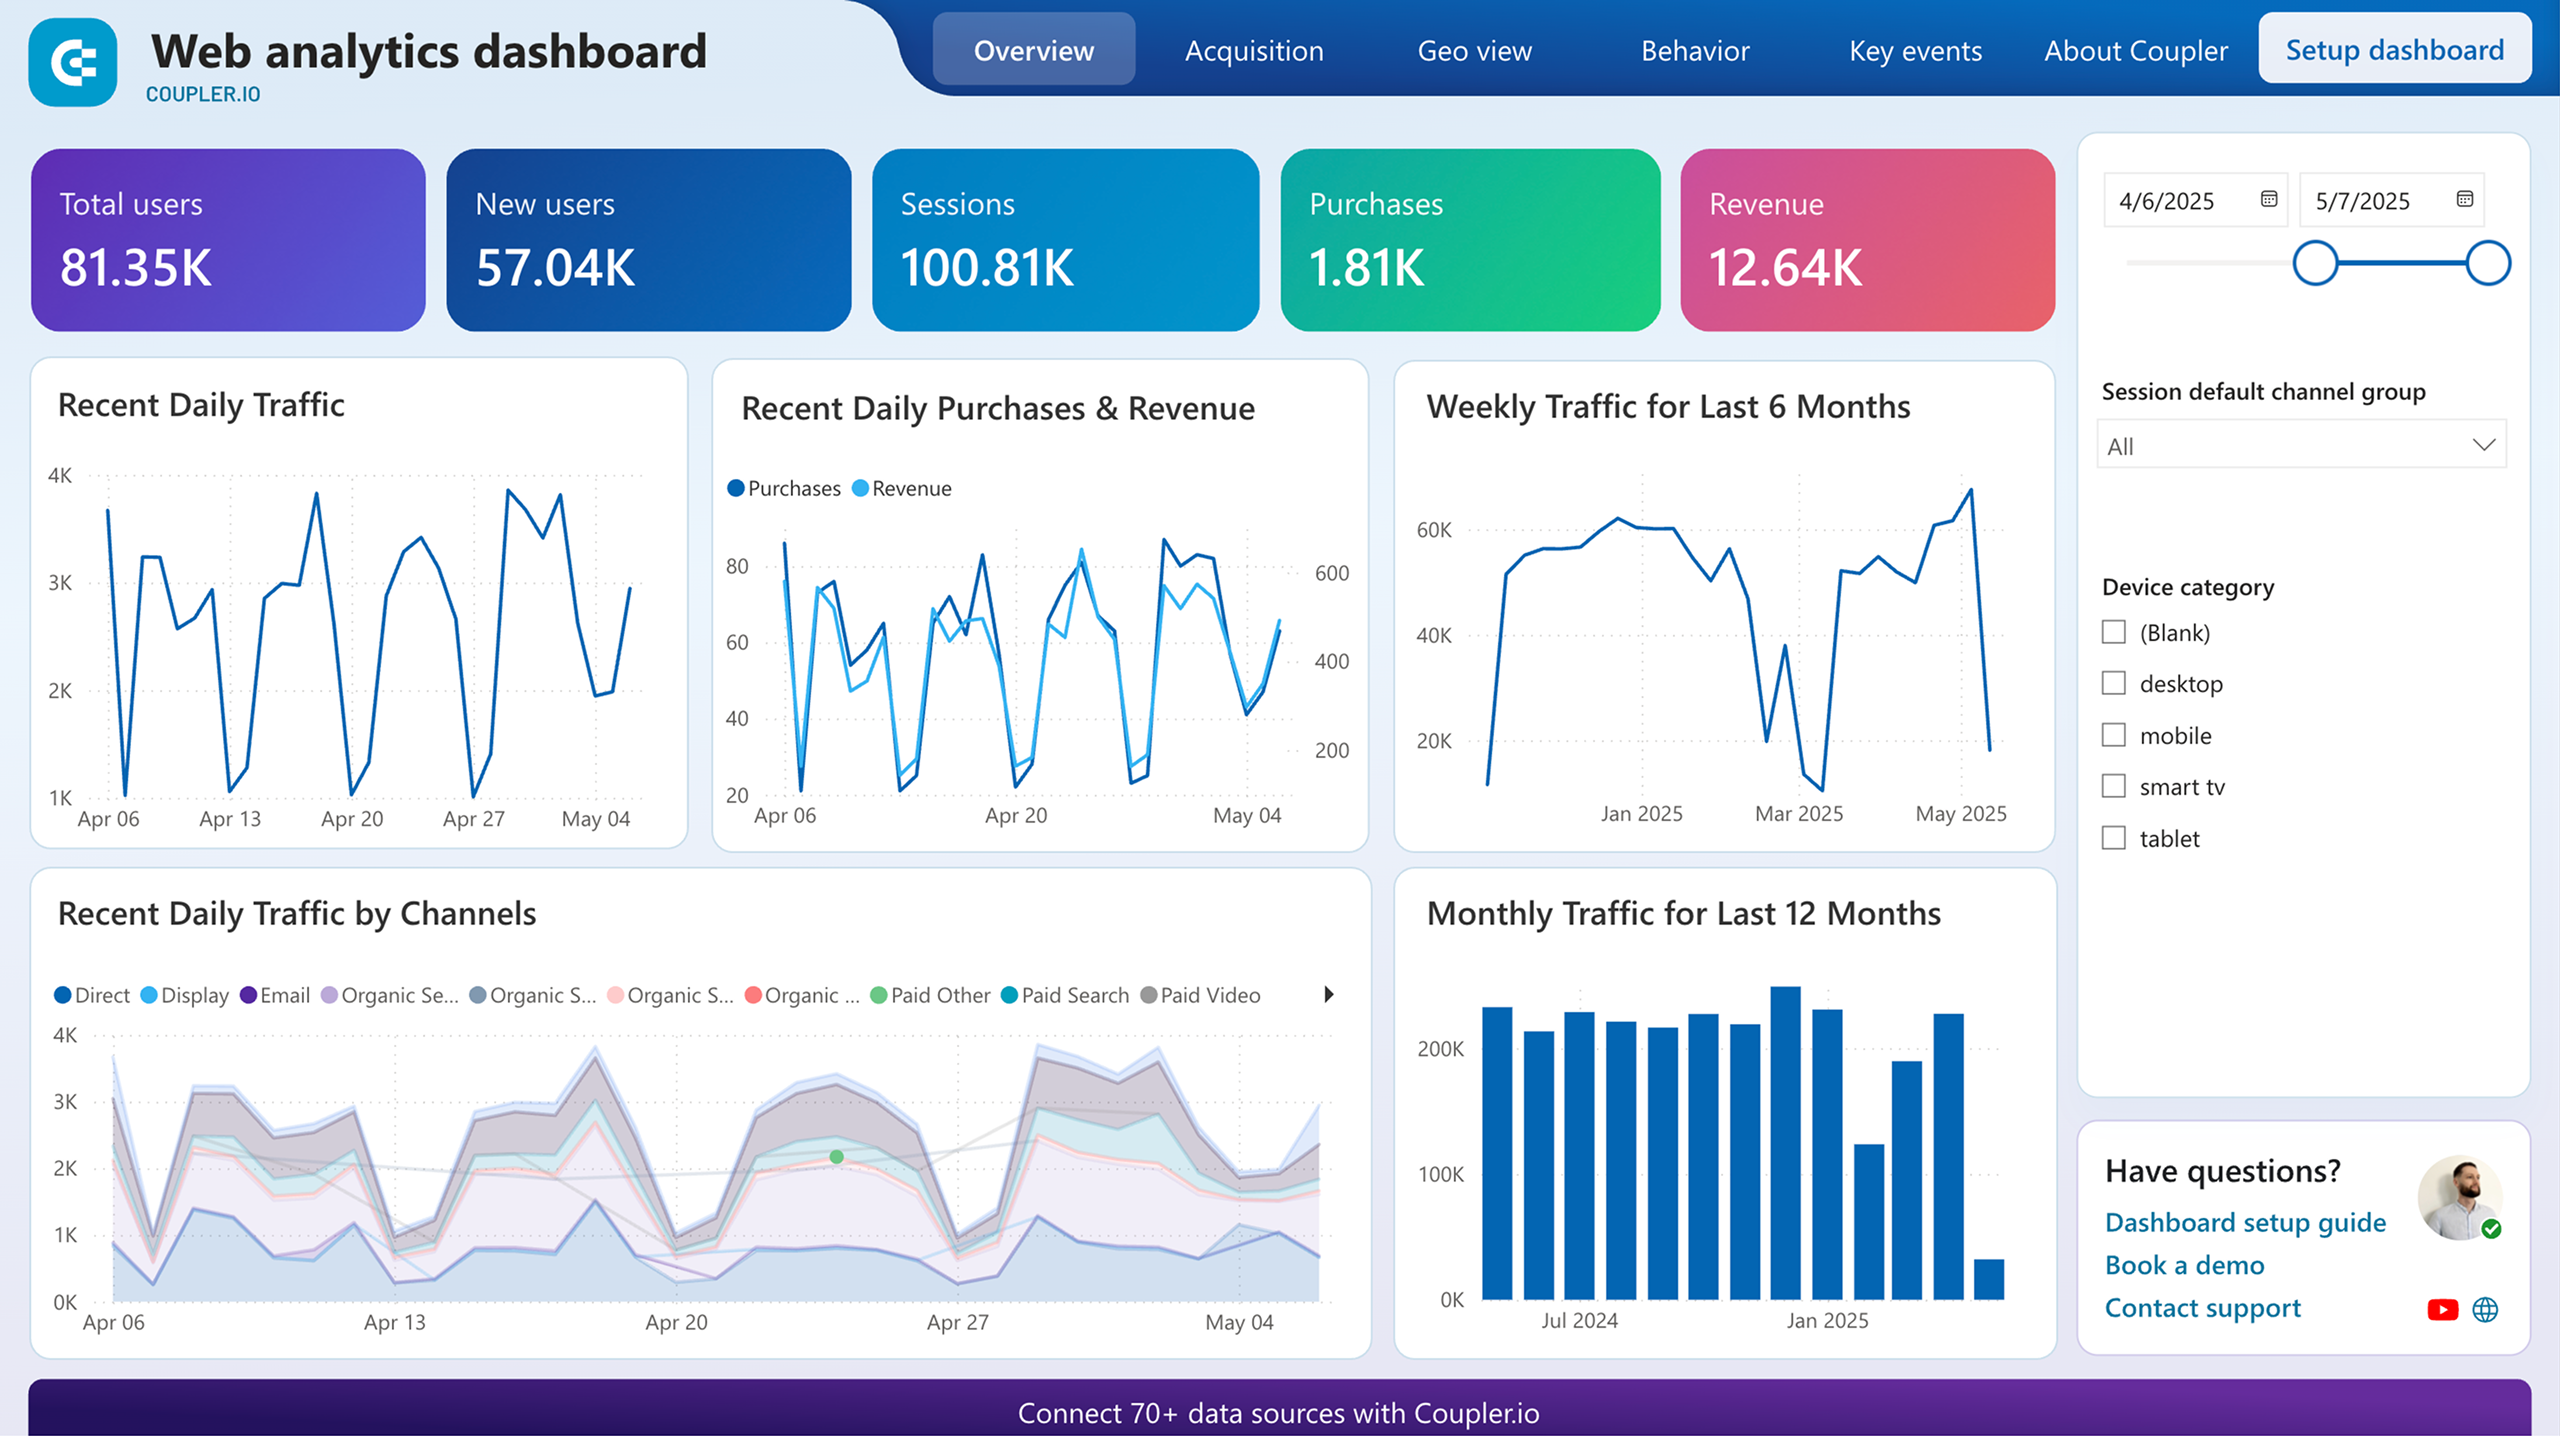
Web analytics dashboard
Discover insights into your website’s traffic acquisition, audience, and conversions with Google Analytics 4 data seamlessly connected to our Power BI dashboard template.


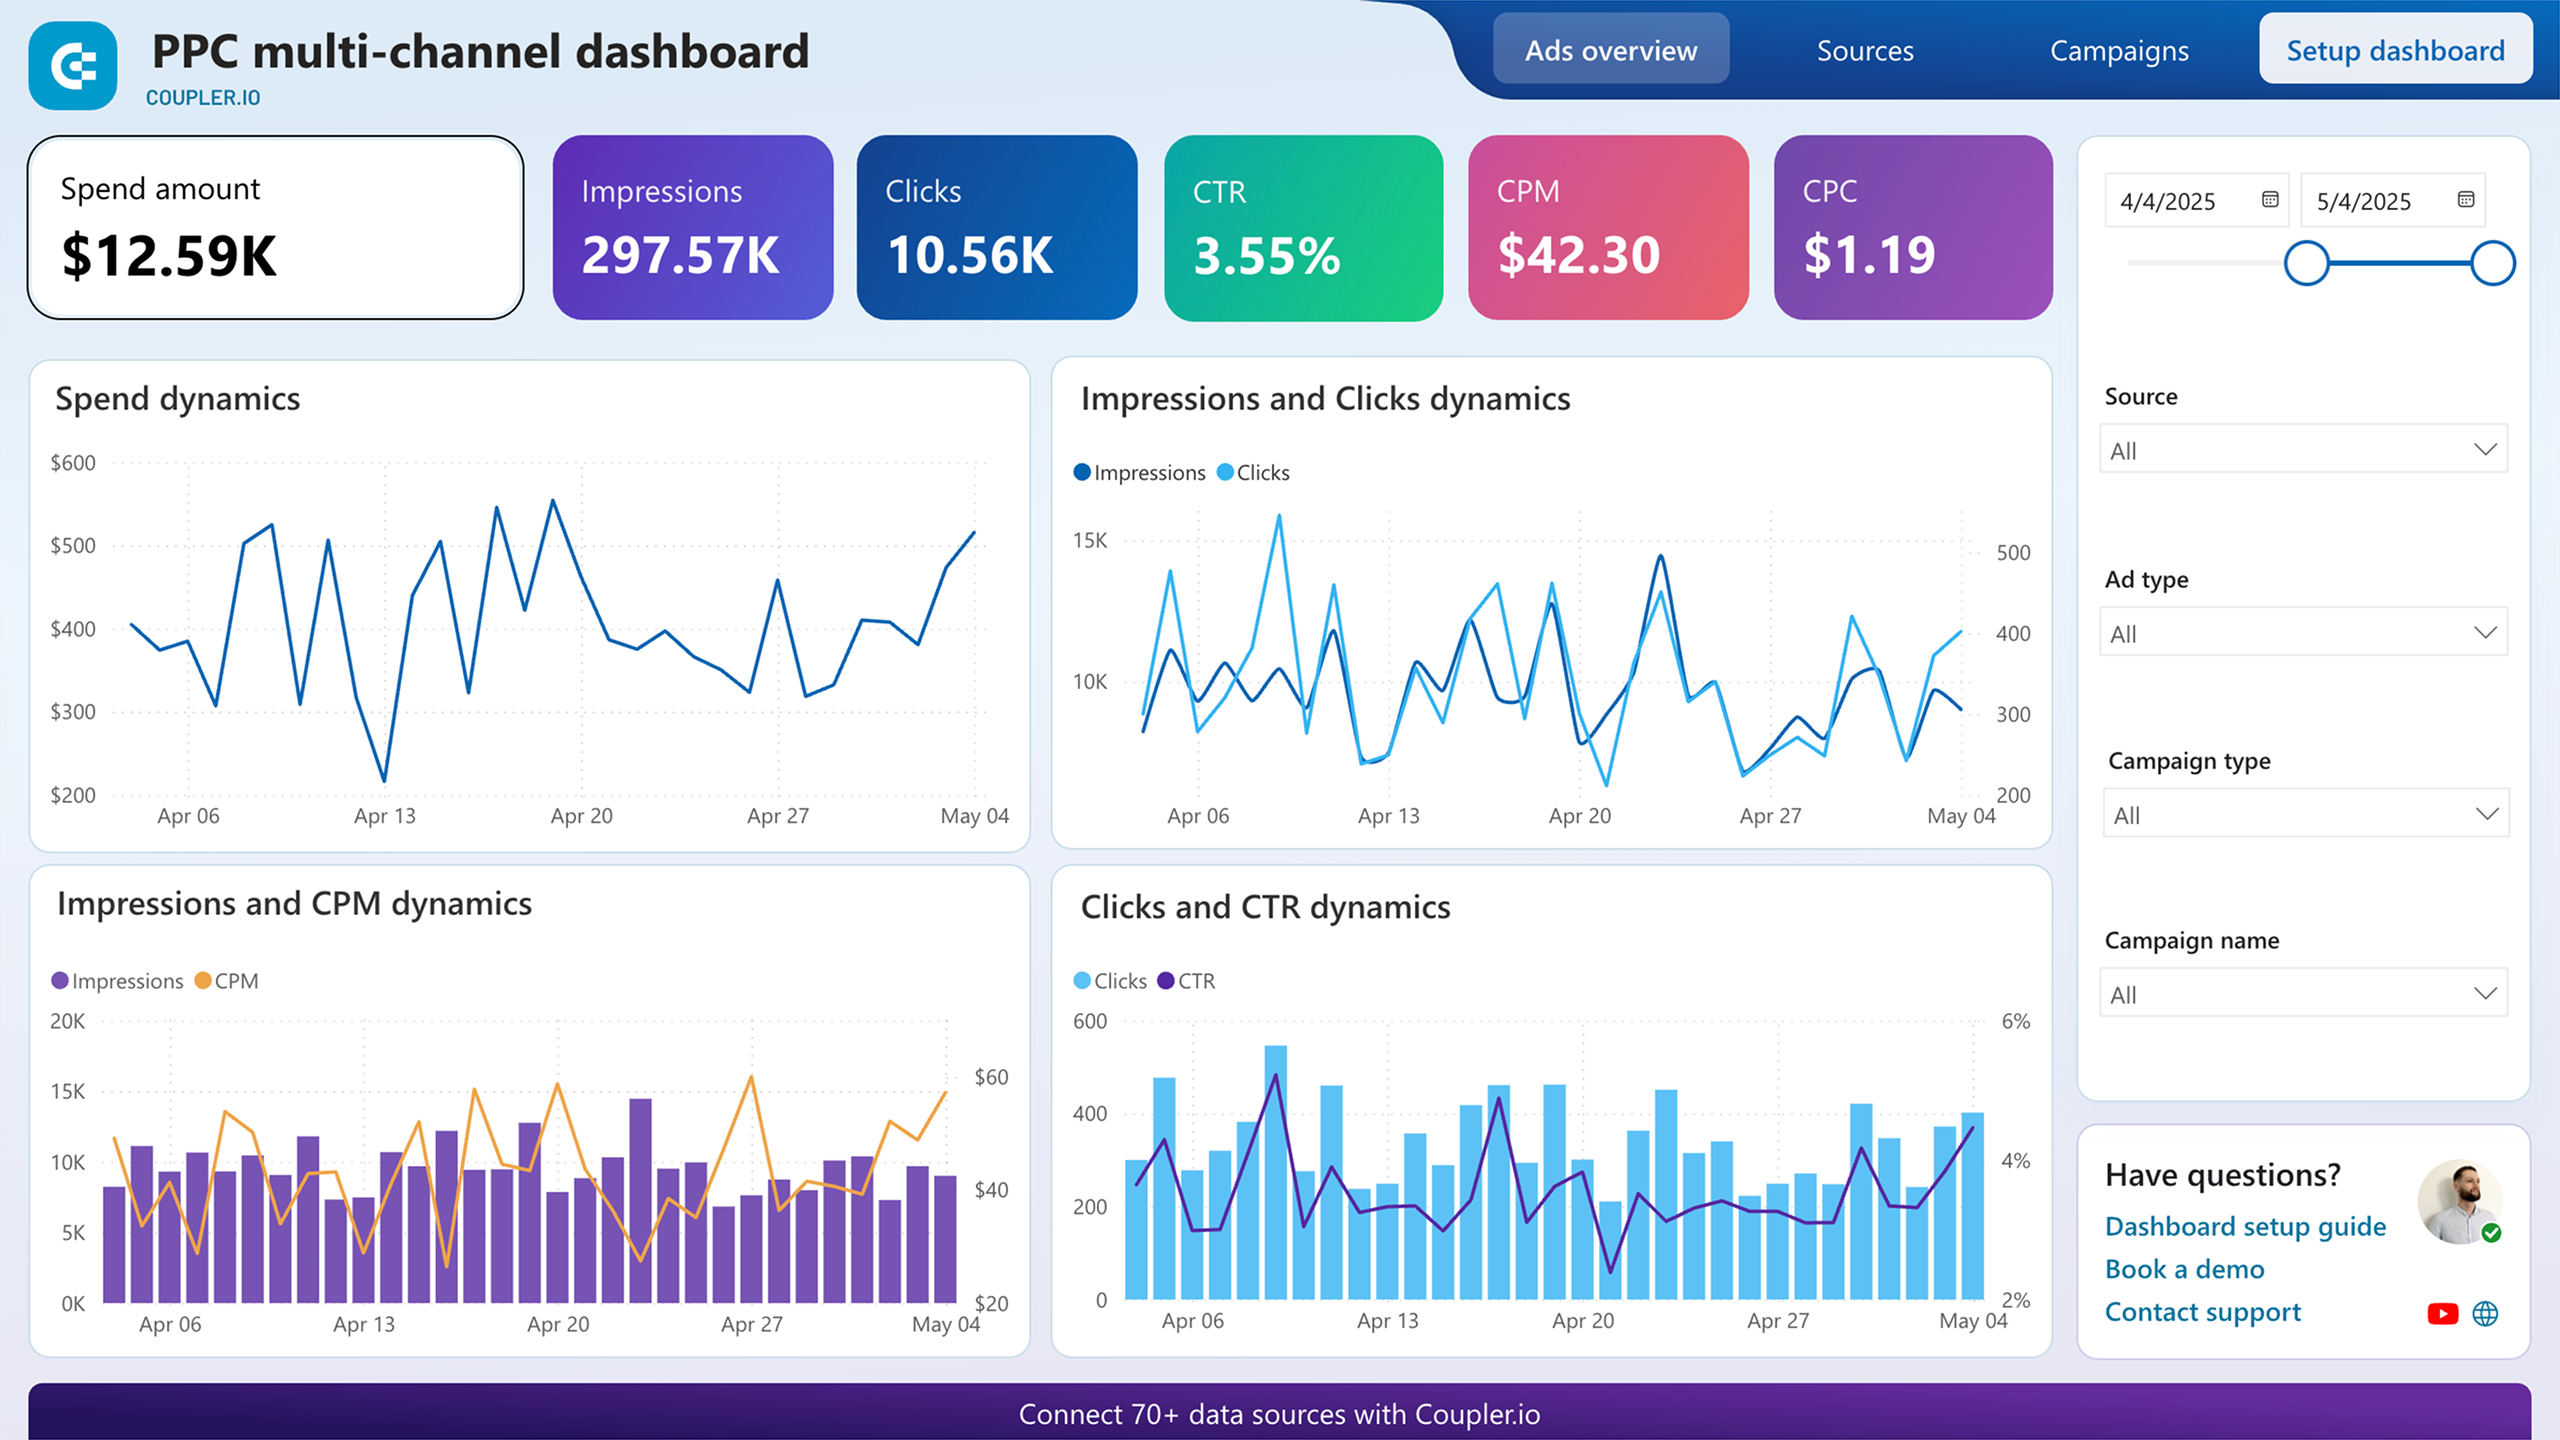
PPC multi-channel dashboard
Utilize a Power BI PPC dashboard for tracking and analyzing your advertising campaigns across multiple platforms.

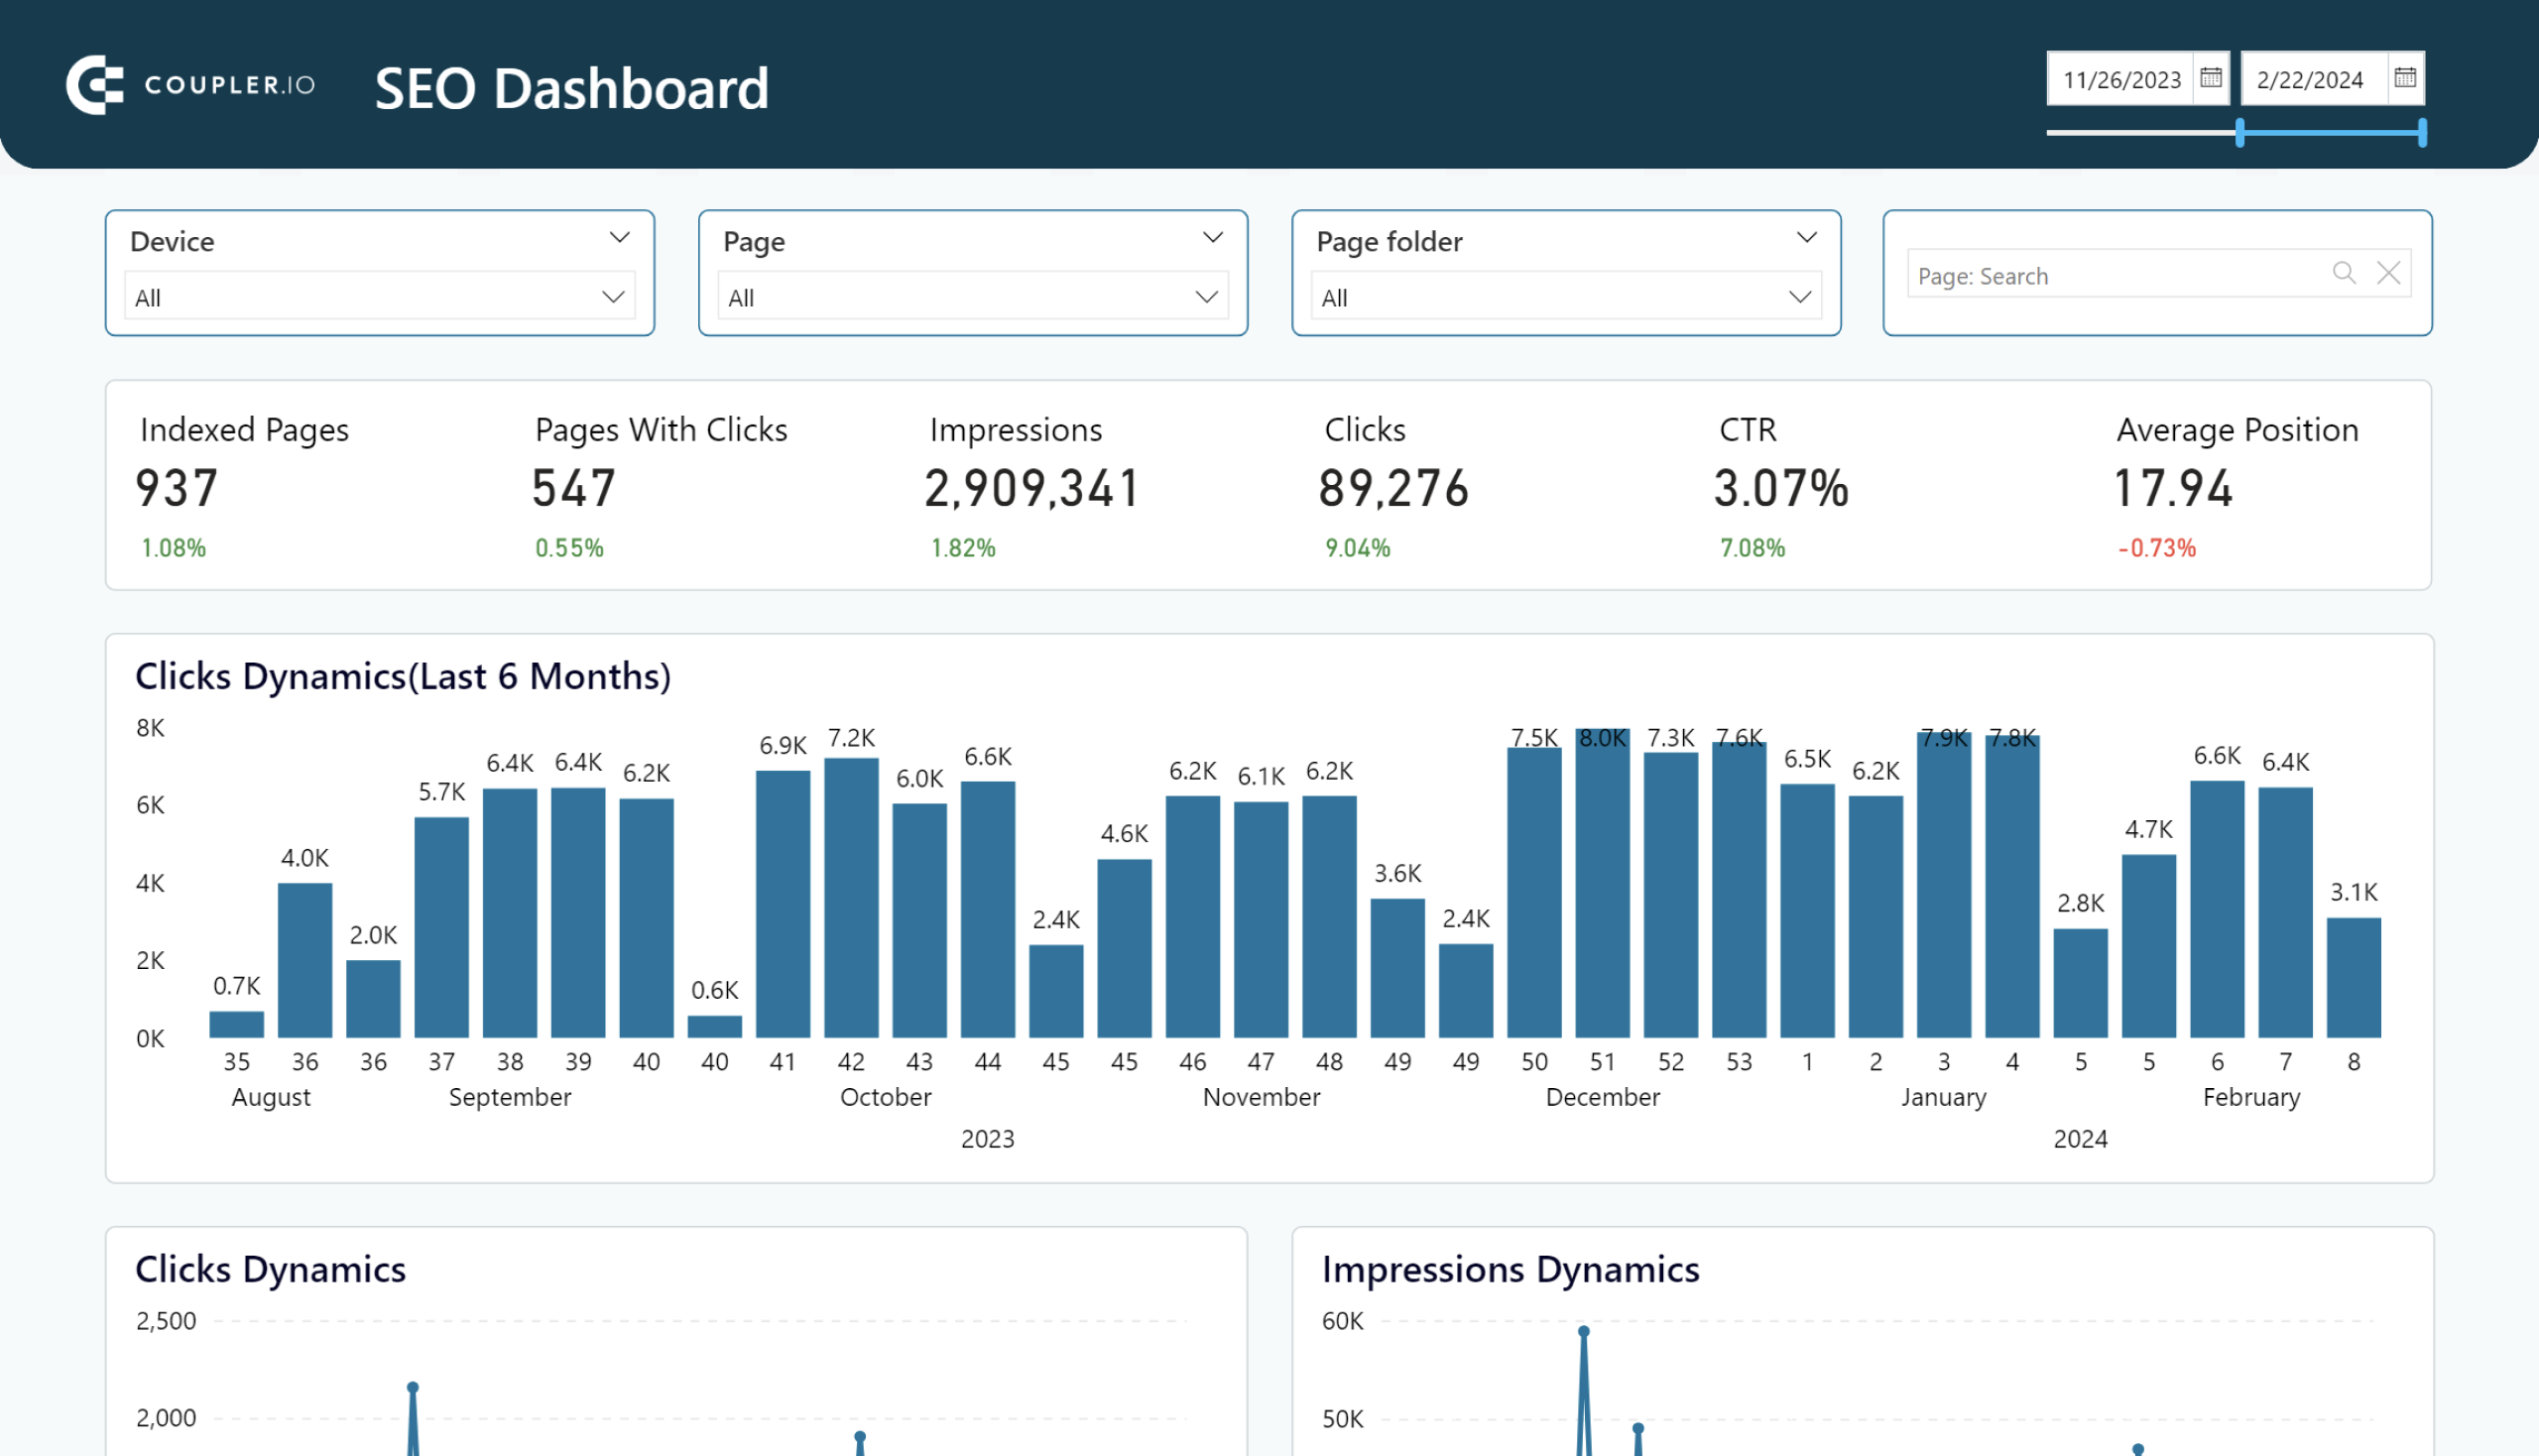
SEO dashboard
Optimize SEO with PowerBI’s dashboard for Google Search Console. Track page rankings, CTRs, and organic traffic efficiently.

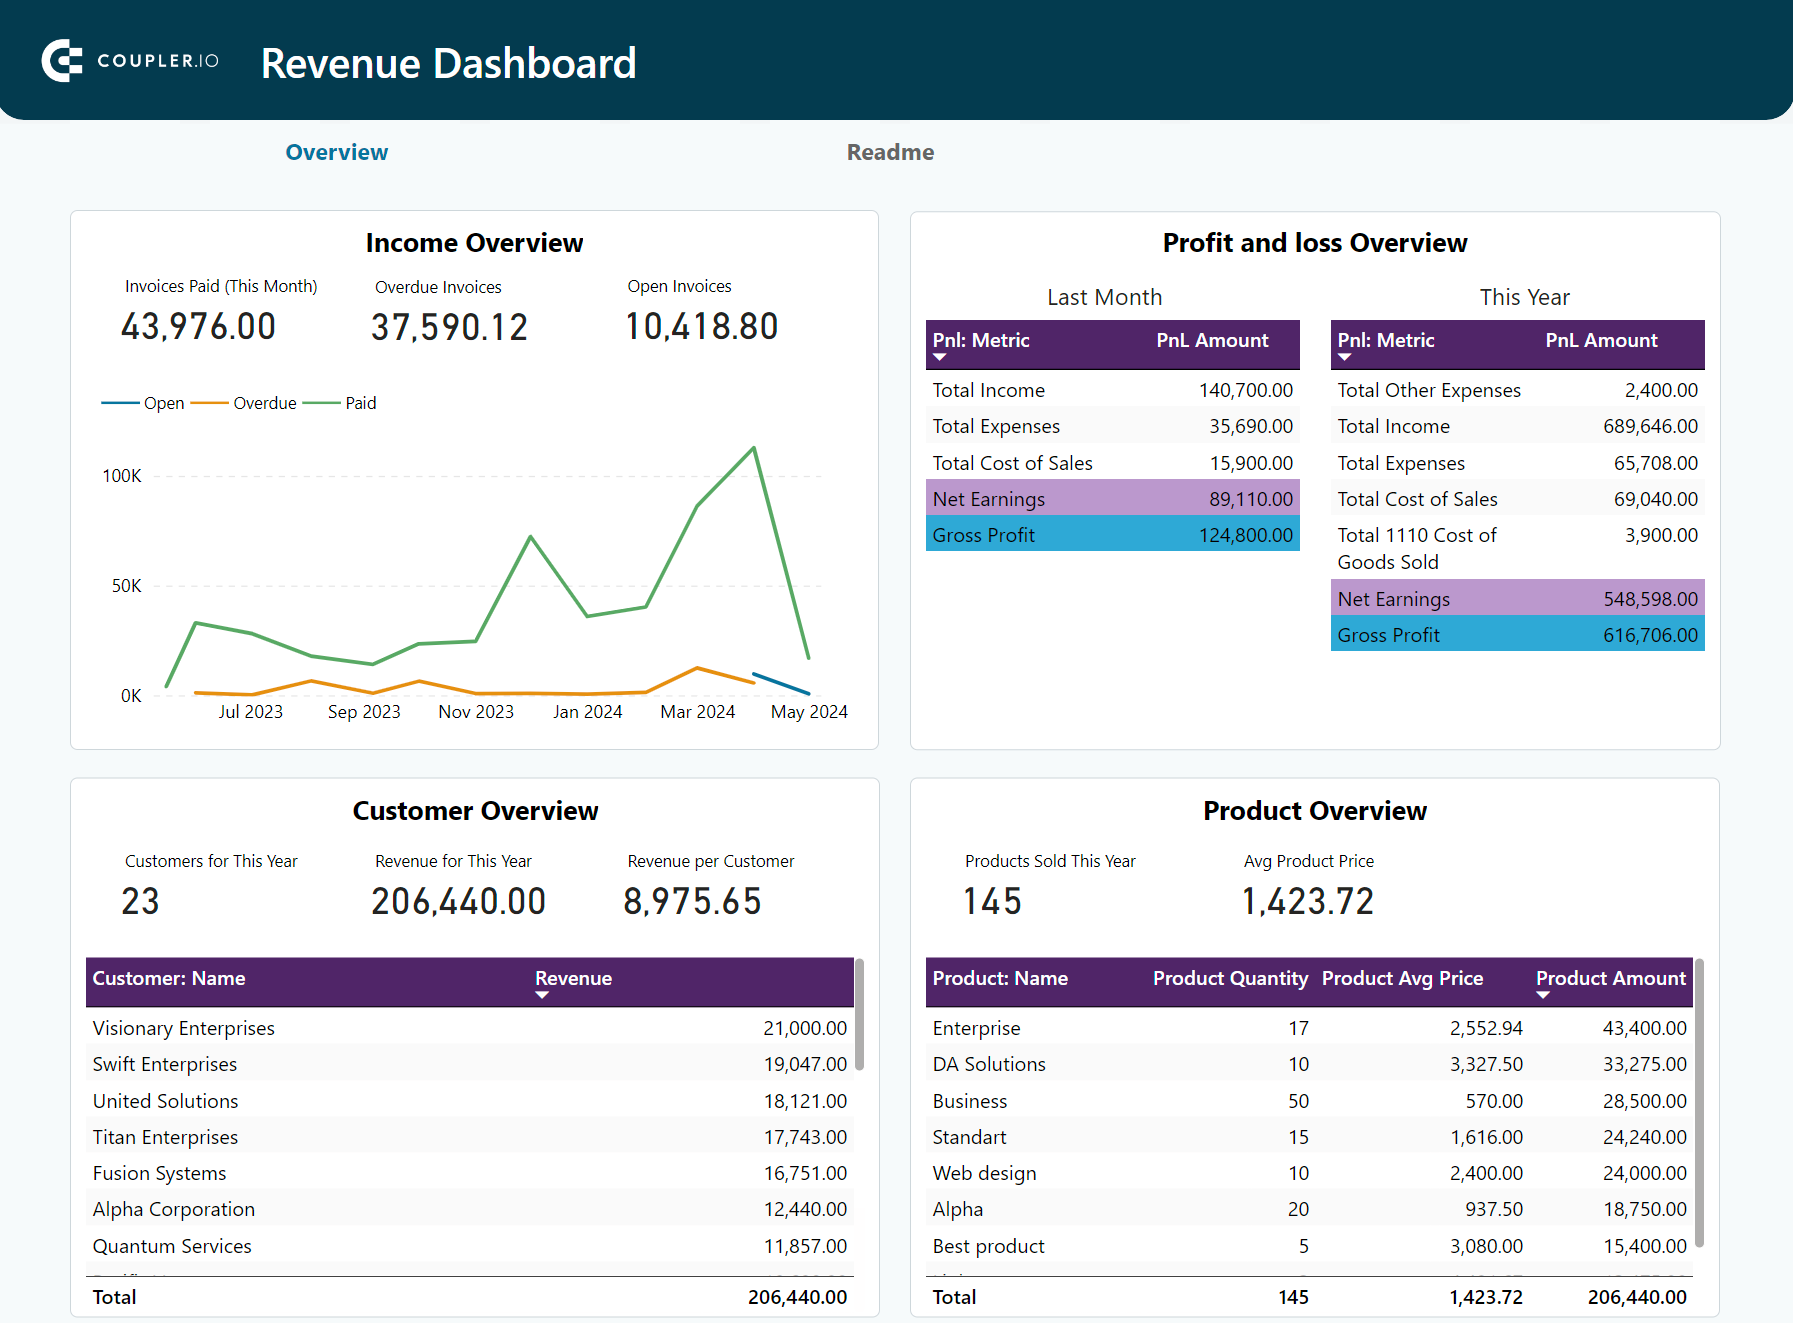
Revenue dashboard for QuickBooks
Monitor your income and expenses on an all-in-one revenue dashboard connected to your QuickBooks Online account.
What is the difference between Power Query and Power Pivot in Power BI
In Power BI, both Power Query and Power Pivot are components used to provide a comprehensive and integrated BI solution.
Power Query acts as the ETL engine, transforming “bad data” into “good data” before loading it into Power Pivot.
Power Pivot serves as the data modeling component, allowing for the creation of complex relationships, measures, and calculated columns. While Power Pivot has limited capability to clean, shape, and transform data, Power Query complements it perfectly.
Note: Power Pivot is generally referred to as the “Data Model”, “Power Pivot Data Model”, or “DAX engine.”
The following table shows the differences between Power Pivot and Power Query in Power BI:
| Power Query | Power Pivot |
|---|---|
| An ETL engine. | A data modeling component. |
| Allows users to connect to various data sources, transform data, and load it into Power BI. | Allows users to define relationships between tables, create measures, and build calculated columns. |
| Acts as the initial step in the data preparation process before the data is loaded into Power Pivot for modeling. | Provides the framework for creating complex data models that can be used in reports and visualizations. |
| Uses the M language. | Uses DAX (Data Analysis Expressions). |
Which works better for data transformation – Power Query vs. DAX?
Power Query, with its M language, is designed specifically for data transformation and cleansing. Its user-friendly editor has a step-by-step approach, making it easy to see exactly what transformations are happening. This ensures no surprises when your data finally shows up clean and shaped.
Power Pivot’s DAX is excellent for creating calculated columns and measures. However, it is not designed for intensive data cleansing. While DAX can handle simple transformations like filters and adding new fields, it does not provide the extensive transformation capabilities offered by Power Query.
In summary, use Power Query to clean and prep your data, and turn to DAX for slicing, dicing, and complex calculations. Both are indispensable, but understanding when to utilize each will greatly improve your data management workflow.
Is Power Query available on Power BI service?
Yes, absolutely! You can use Power Query directly in the Power BI service (online) using Dataflows. This enables you to shape and transform data in a web-based environment.
Although both the desktop and online versions provide powerful data preparation tools, there are notable distinctions between the two.
Power Query in Power BI Desktop covers more connectors, including local files, databases, and cloud services. The following screenshot shows the Power Query’s Get Data window from within a new dataflow in the Power BI service:

The desktop version handles extensive data transformations better by using your local machine’s power. While the online version may not be as fast, it benefits from cloud efficiencies and accessibility, making it ideal for collaboration.

Is there a significant difference between Power Query for Power BI and Excel?
Absolutely, let’s break it down.
Power Query in Excel and Power BI are quite similar at their core. They both use the M language for data transformation, which is consistent across both platforms.
The key difference lies in their environment and use cases. Power Query in Excel is tailored for spreadsheet users and is perfect for smaller-scale data manipulations and analyses within a familiar interface. It’s designed to enhance your existing Excel workflows.
On the other hand, Power Query in Power BI is designed to provide more extensive data modeling and visualization. It includes additional tools and enhancements not found in Excel, such as more advanced query options or integrations with other Power BI-specific tools.
For instance, in Power BI, you can use parameters to dynamically adjust the loaded data without manually modifying each query. This simplifies handling larger datasets and complex calculations. Furthermore, Power BI seamlessly integrates with its cloud services, enabling real-time data refreshes and the ability to share reports with others.
Your next steps after data transformation
Mastering Power Query lays the foundation for all your data work in Power BI. Learning how to use Power Query in Power BI is just the beginning of your data transformation journey. Becoming proficient in using it, from simple column changes to complex data merges, will boost the efficiency of your data analysis.
Connect your cloud sources to Power BI with Coupler.io
Get started for free