Did you know that over 94% of internet users skip the search ads? That’s why PPC ad performance needs constant tracking and analysis. It helps you identify areas for improvement, make some adjustments to the campaign or budget, and maximize the benefit of your PPC advertising.
Having said that, the question remains: how do you perform PPC analysis that makes a difference? Let’s explore this process step by step, look at the tools you could use, and define the metrics to focus on.
What is PPC analysis?
In short, PPC data analysis is the evaluation of your PPC campaign performance. This is done by tracking and measuring metrics like impressions, link clicks, CTR, CPC, CPM, and others. As a result, you learn where your advertising succeeds and which aspects could be improved.
3 steps to take before PPC analysis
Select your KPIs
Before analyzing your PPC campaign, define the most important metrics relevant to your goals and hypotheses. For instance, if you aim to increase website traffic, your KPIs might include link clicks, CTR, and CPC.
Configure your tools
For an accurate and comprehensive PPC audit, you need to configure a range of tools. Select apps to analyze PPC campaigns, set up tracking of marketing conversion metrics or check if it works properly, explore competitors’ ads, visualize data, and automate reporting.
Set the schedule
Another thing to choose is the frequency of your PPC data analysis. According to your needs, you can analyze your campaigns daily, weekly, monthly, or any combination thereof. Once you make your choice, keep to the schedule, ensuring your analysis is regular and consistent.
Later on, we’ll discuss some metrics and tools, provide actions for each analysis frequency, and explain how you can automate the PPC reporting process.
How to perform PPC data analysis + real-life example
Let’s start by considering an example of creating a report to analyze the performance of ad data from Facebook Ads. This includes collecting ad data, preparing it for analysis, and visualizing key metrics. While we focus on Facebook Ads, the same approach applies to other PPC sources like Google Ads, LinkedIn Ads, and Bing Ads.
Step 1: Collect your Facebook Ads data
To start collecting your Facebook Ads performance data, choose your destination (preferably a visualization tool) in the form below and click Proceed to create a Facebook Ads dataflow.
Coupler.io also supports other PPC platforms, so feel free to choose the one you need in the form, including:
- Amazon Ads
- Apple Search Ads
- Bing Ads
- Google Ads
- Google Analytics 4
- Instagram Ads
- LinkedIn Ads
- Pinterest Ads
- Quora Ads
- Snapchat Ads
- TikTok Ads
- X (Twitter) Ads
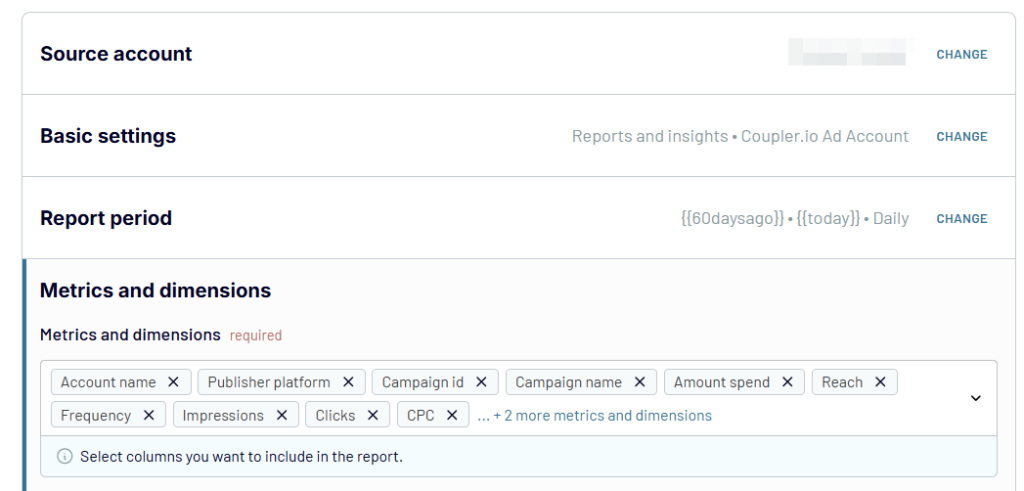
After signing up for a free Coupler.io account, authorize your Facebook Ads Manager account.
- Select Reports & Insights to access the campaign, ad set, and ad-level data.
- Choose the date range for your report.
- Pick the metrics & dimensions you want to track (CTR, CPC, Conversions, etc.).
Before transforming your Facebook Ads data, you can add additional data sources to your report, like multiple Facebook accounts and other PPC sources. Learn more about how to combine data from ads sources with Coupler.io.
Step 2: Organize and transform data
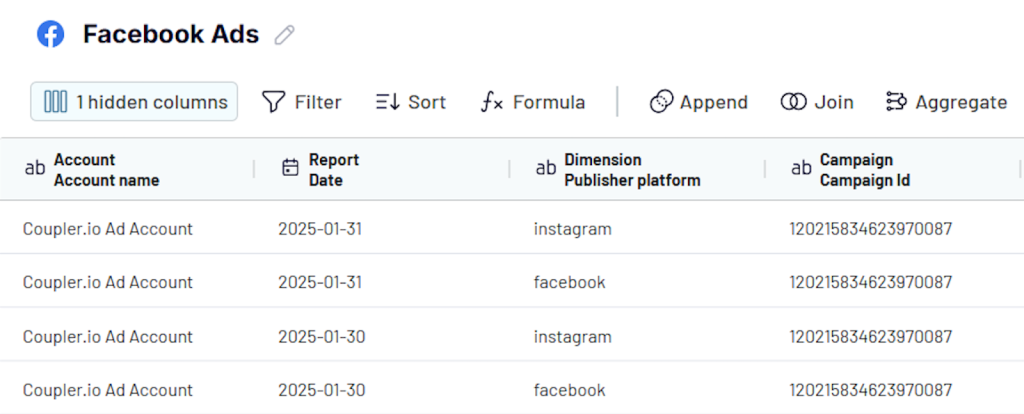
To better organize your data, use the data transformation features in Coupler.io. For example, to make your analysis more detailed, break down your data into segments.
You can split it by campaign, ad group, or keyword. By comparing results across different segments, you can draw better conclusions about specific advertising areas. This will enable you to take appropriate actions regarding your campaigns.
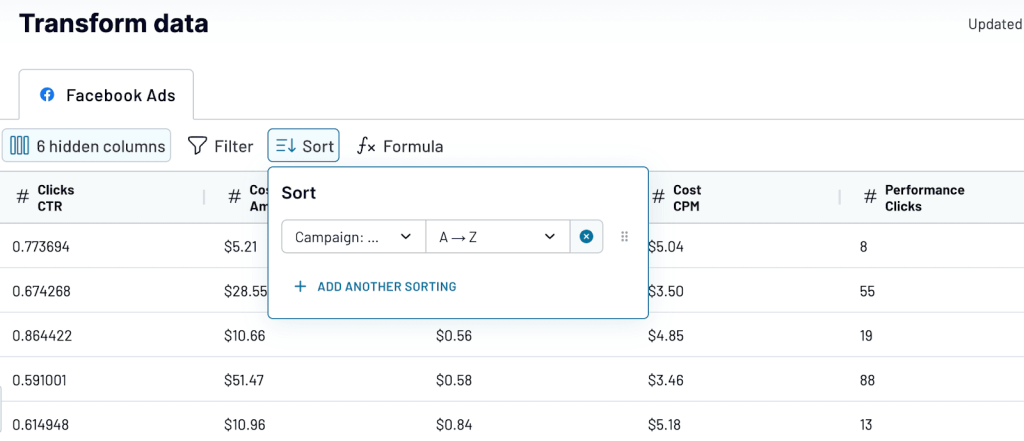
With Coupler.io data transformation features, sort data by campaign or other parameters right after collecting it.
Click Sort, choose the Campaign name in the dropdown list, and select the order.
Additionally, in this step, you can rename, rearrange, hide, or add columns, apply filters, create custom formula-based columns, and merge data from multiple accounts or applications to refine your report.
You just created a custom report of your Facebook Ads data. Now, click Proceed to move to the next step.
Step 3: Load data and schedule data transfer
Configure the destination settings by following the instructions in the Coupler.io interface.
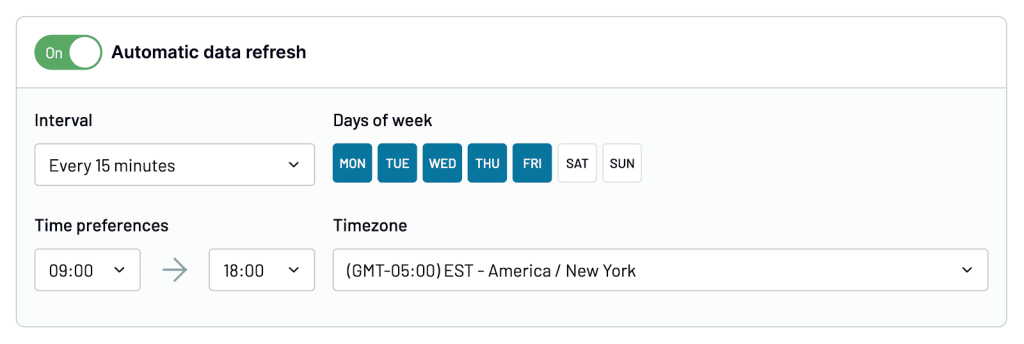
Set an automated data refresh to keep your reports up-to-date. Go to Flow Settings and select how frequently you want updates (daily, hourly, or every 15 minutes). Click Save and Run to enable automatic data transfer.
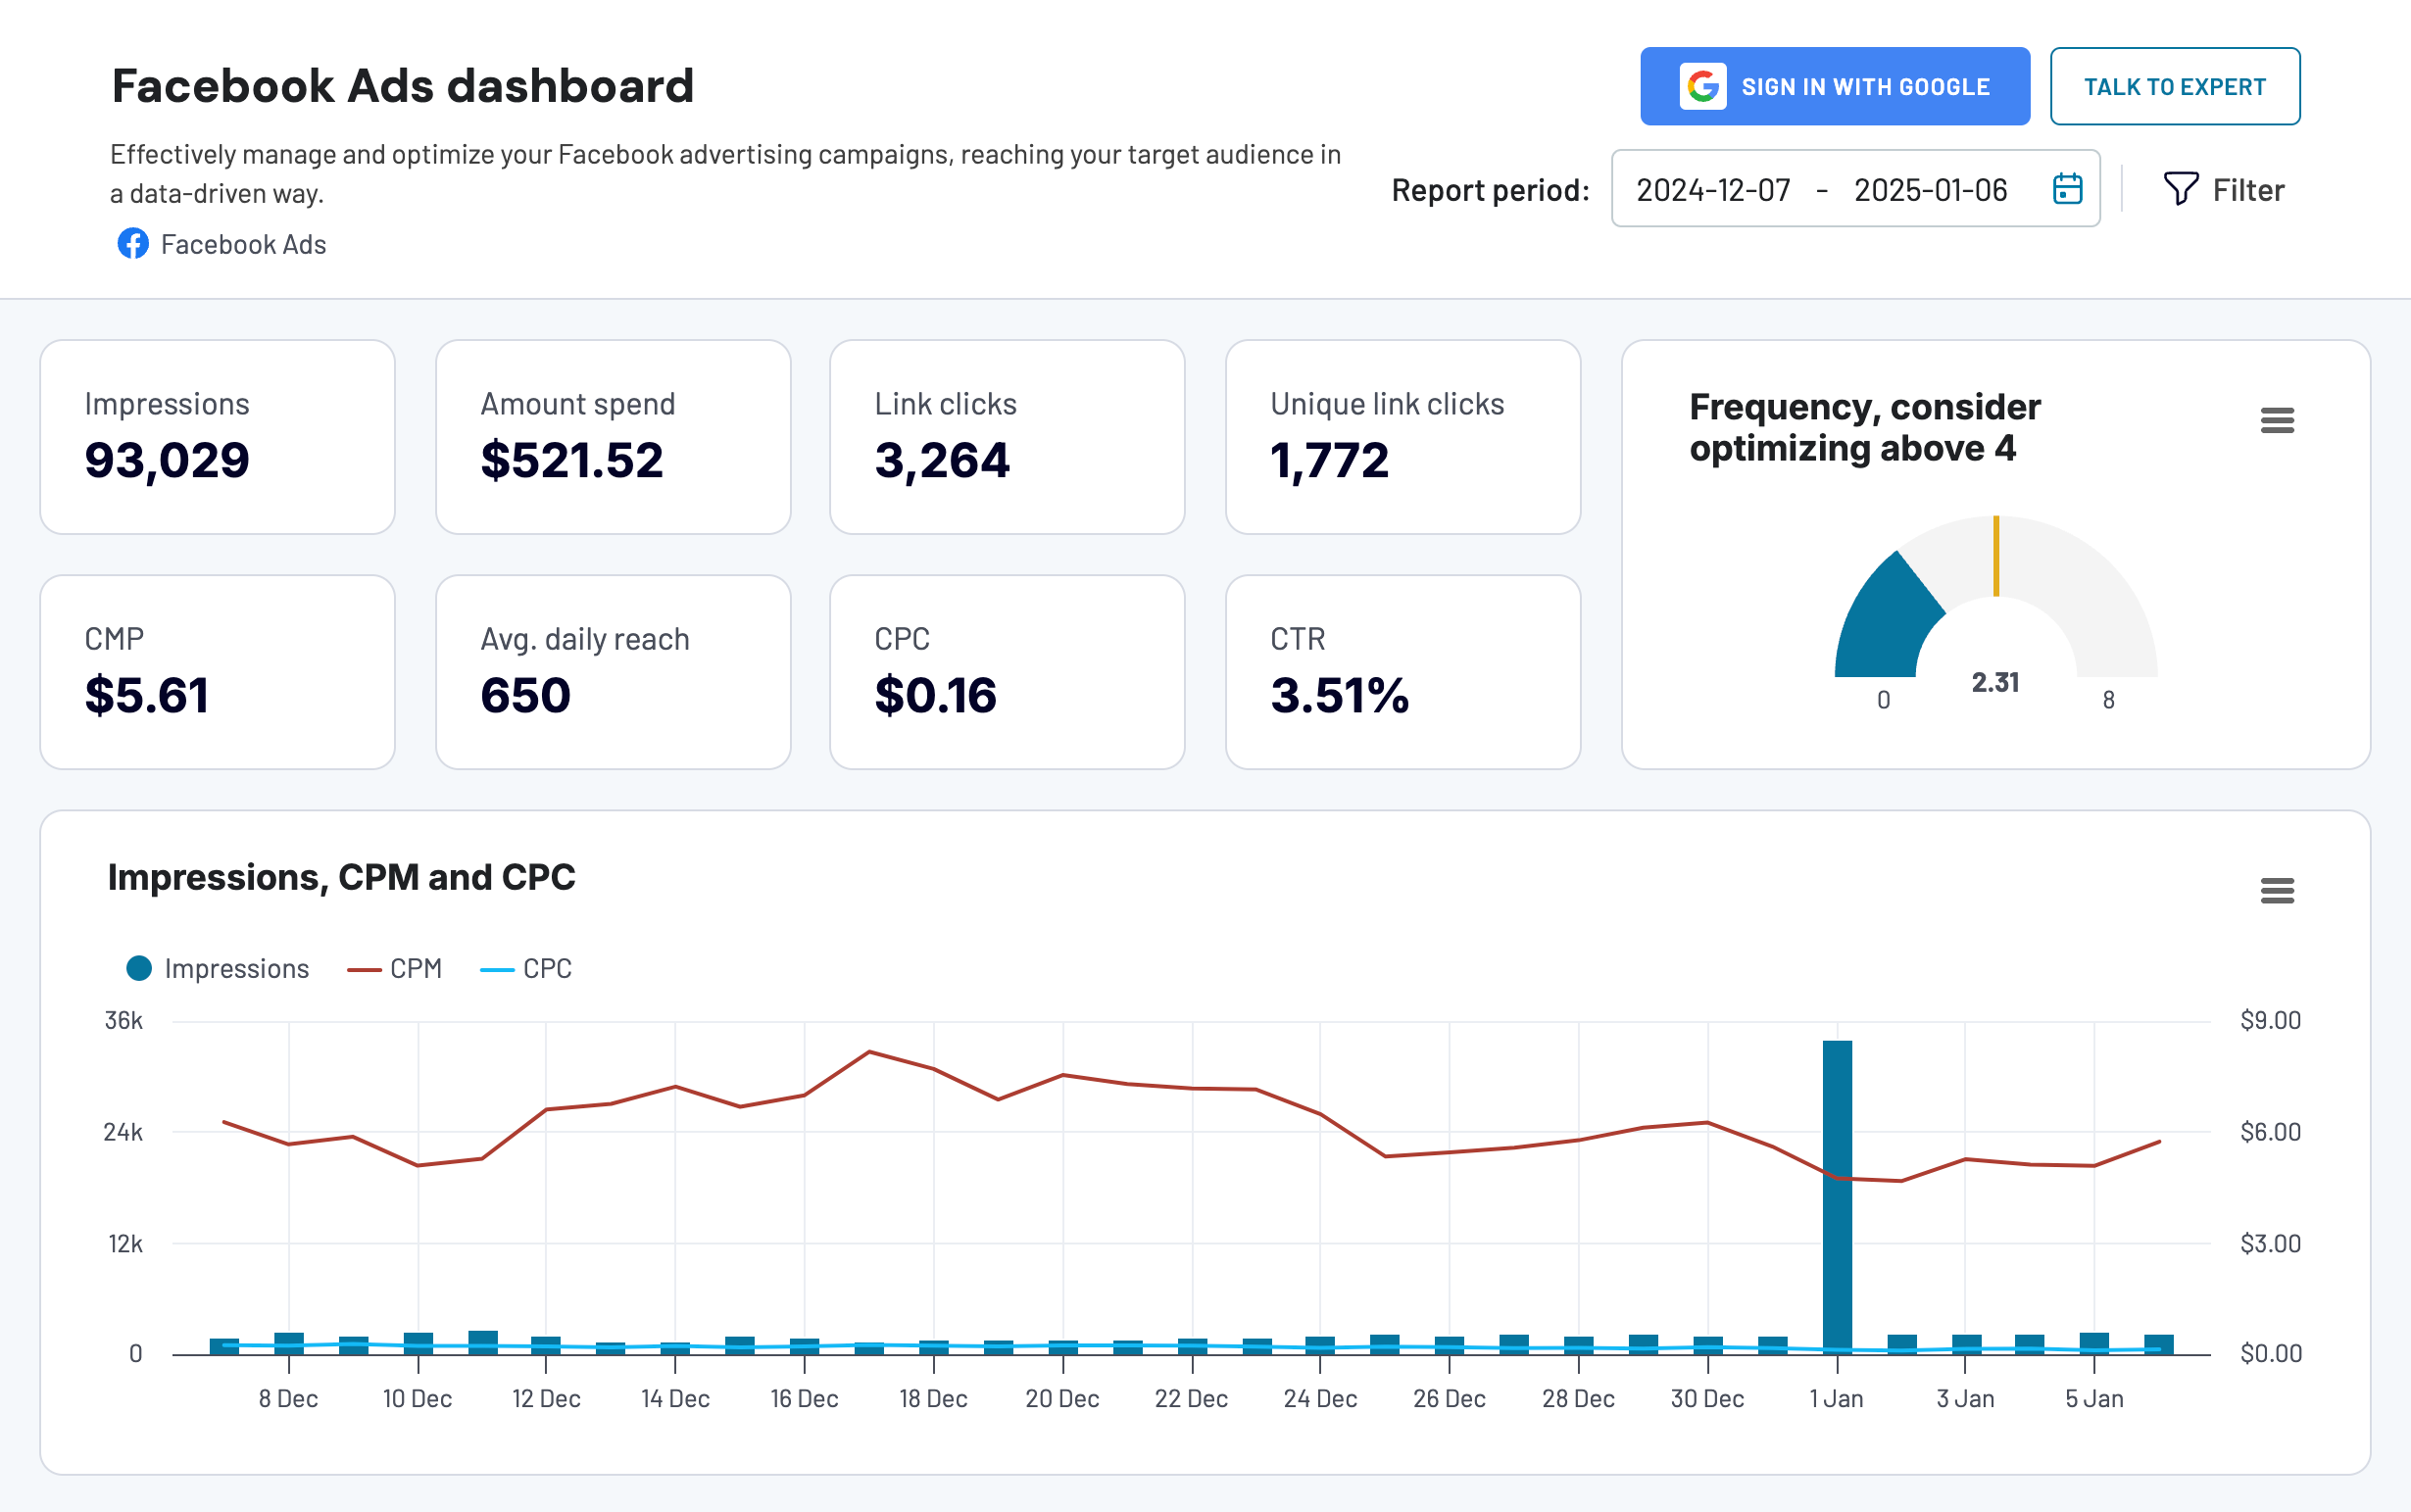
Once your data is in your chosen destination, you can visualize this data to analyze your Facebook Ads performance with real-time insights.
Instead of building a dashboard from scratch, take advantage of Coupler.io’s ready-made Facebook Ads dashboard. Click on Connect My Data and authorize your Facebook Ads account. The dashboard will auto-populate your own data within minutes within Coupler.io.
Step 4: Explain performance fluctuations
Once you analyze your data, you might notice an uncommon decrease or increase in any metric. If that’s the case, figure out why this has been happening. By discovering the reasons for performance swings, you can gain actionable knowledge and define the issues to be solved.
Step 5: Test your hypotheses
PPC analysis allows you to measure the results of your hypothesis testing regarding ad performance.
For instance, you might suppose that including prices in your ads will improve the conversion rate by attracting potential buyers. You can check this through A/B testing, or split testing. Launch different versions of your advertising, analyze the results, and learn which is more effective.
Step 6: Analyze the competition
Review campaigns launched by your competitors to see what they both implement and avoid. You may discover the keywords they use and identify the gaps to fill, analyze the phrases included in their ads, look at their destination URLs, etc.
By comparing your advertising data with that of your competitors, you can uncover opportunities to outperform them.
Visualize PPC data with ready-to-use templates
To perform PPC data analysis, you need to gather and transform data in the form of reports. Instead of creating them from scratch, leverage Coupler.io’s ready-to-use PPC dashboard templates. They automatically pull PPC performance data on a schedule, saving you time and effort.
1. PPC multichannel dashboard
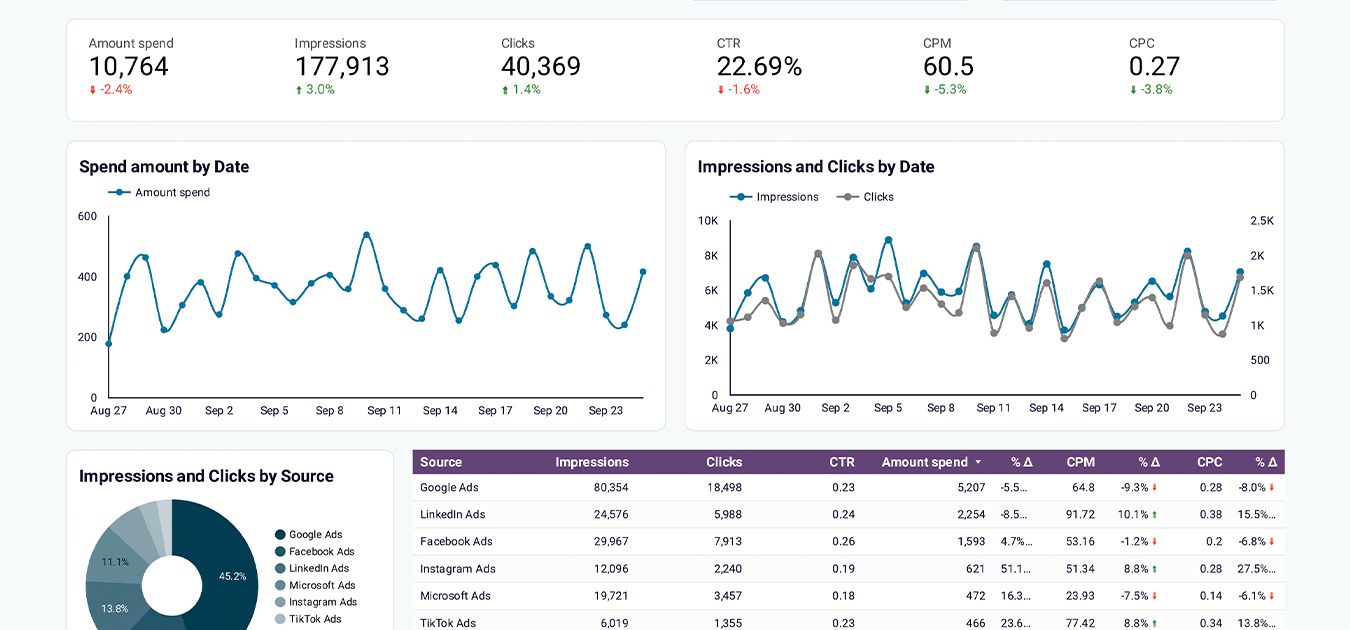
The PPC multichannel dashboard allows you to collect performance data on your campaigns launched on different platforms.
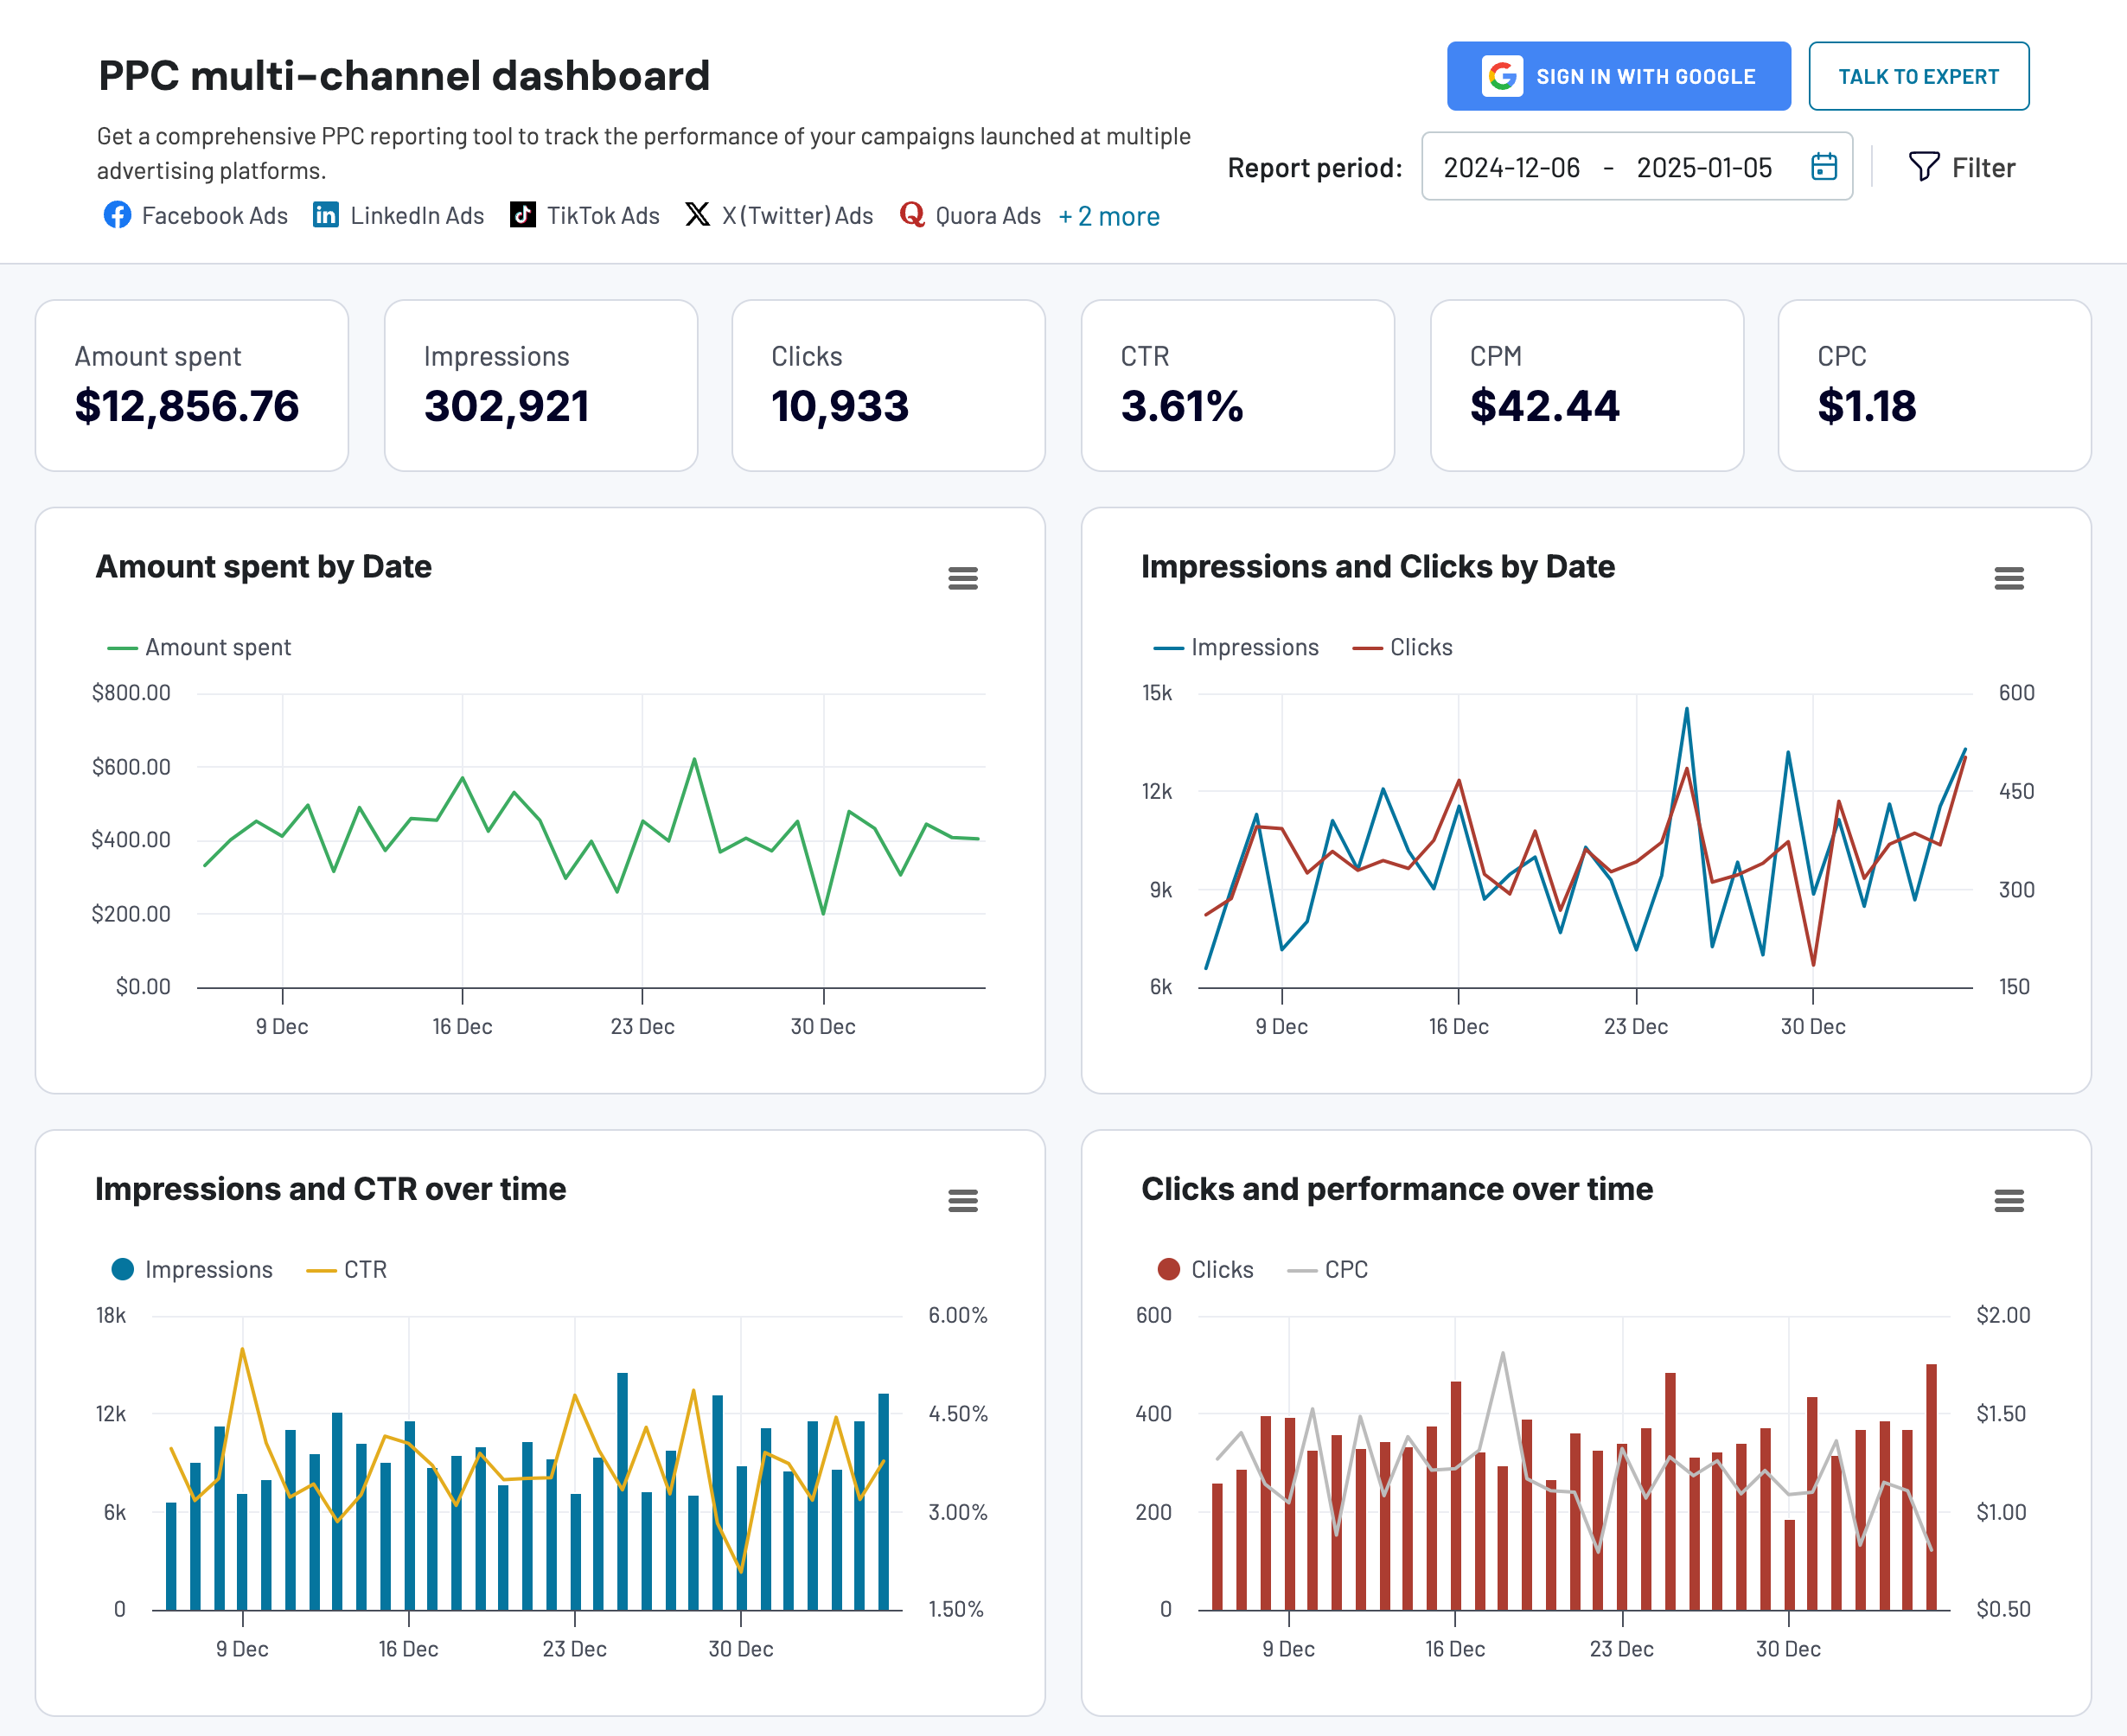
The PPC multichannel dashboard accumulates data from Google Ads, LinkedIn Ads, Facebook Ads, and other platforms, so you can monitor and compare campaign performance in one place. Here is a full list of the supported ad sources:
- Facebook Ads
- Instagram Ads
- LinkedIn Ads
- Google Ads
- TikTok Ads
- Quora Ads
- Microsoft (Bing) Ads
- X (Twitter) Ads
The PPC dashboard is designed by Coupler.io, and you can easily connect your data sources using its built-in connector. In a moment, the dashboard will be populated with your data and will be updated automatically every day by default. If you want a more frequent data refresh, go back to Coupler.io and tweak the schedule to your liking. Bookmark your dashboard to always have the performance of your ad campaigns at your fingertips.
And the best part is that the dashboard is equipped with the AI assistant named Coupler AI Insights. It analyzes your campaign data and provides recommendations to optimize your performance. The AI impact on PPC is growing, and this is just one example of how you can use it. So, preview and try the dashboard with your data right away! This PPC dashboard is also available as a template for different data visualization tools. Try out the one that fits your reporting requirements.


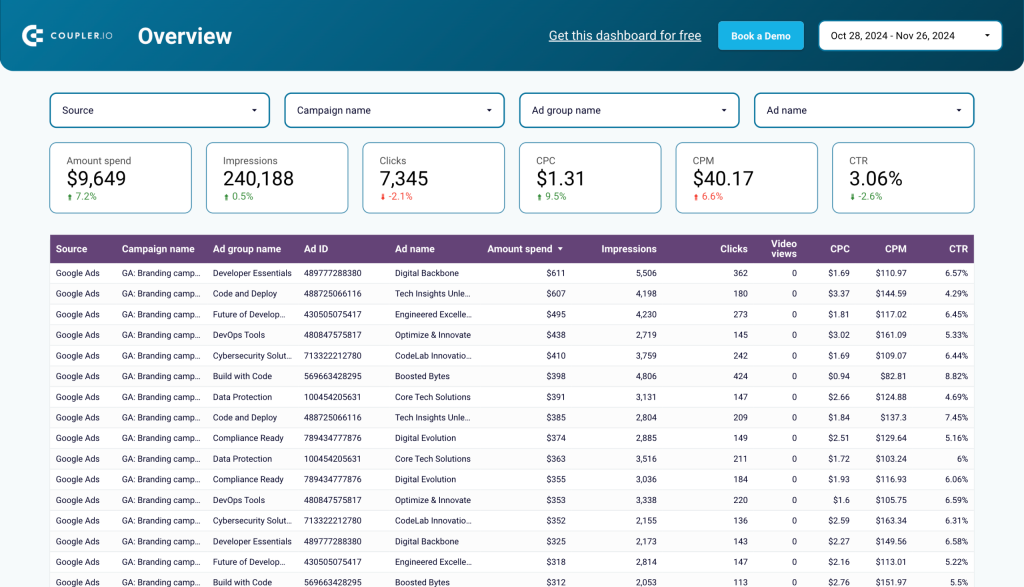
2. Multi-channel creatives dashboard
The multi-channel creatives dashboard helps track ad performance across platforms like Google Ads, Facebook Ads, LinkedIn Ads, TikTok Ads, and Bing Ads. By consolidating campaign data, it allows users to compare creatives, analyze key metrics, and optimize advertising strategies in real-time.
With this dashboard, you can:
- Compare performance across platforms to spot trends.
- Identify top-performing creatives based on CTR and clicks.
- Monitor ad spend, impressions, and engagement over time.
- Analyze cost efficiency by tracking CPC and CPM.
- Make data-driven adjustments to improve campaign ROI.
It also has filters to segment data by ad source, campaign performance tables, trend charts, and budget distribution visuals to simplify analysis.
This dashboard template is powered by Coupler.io. It is available for Looker Studio and Google Sheets. Simply connect your ad platforms, and your data will be automatically imported, visualized, and ready for ad creative analysis.
3. Google Analytics PPC dashboard
The Google Analytics PPC dashboard combines ad performance data from platforms like Google Ads, Facebook Ads, LinkedIn Ads, and more with user behavior insights from Google Analytics 4 (GA4).
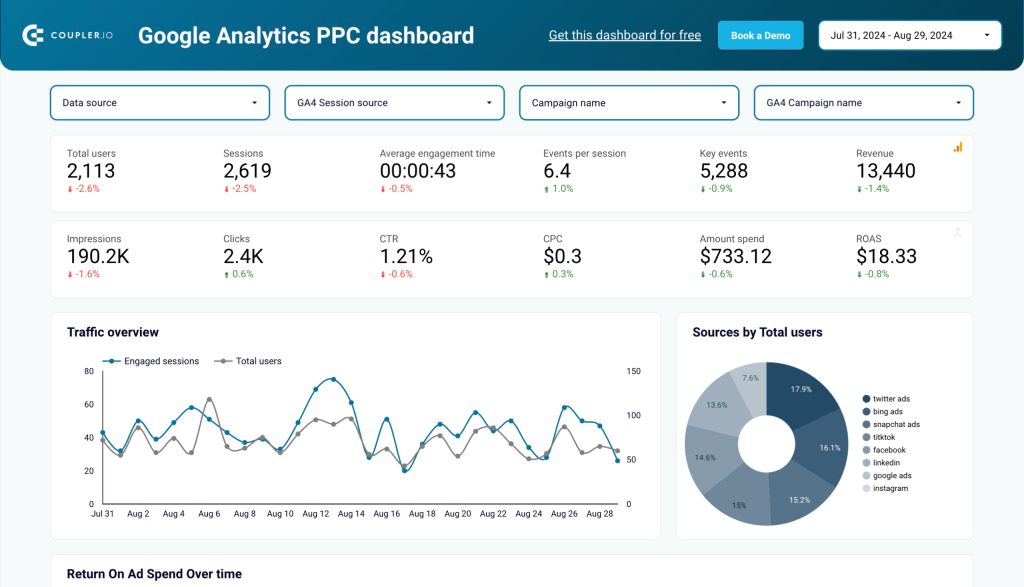
This integration helps understand how ad campaigns drive website traffic, engagement, and conversions.
With this dashboard, you can:
- Track traffic trends by comparing engaged sessions vs. total users over time.
- Identify top-performing ad platforms to optimize budget allocation.
- Monitor Return on Ad Spend (ROAS), revenue, and purchase trends to assess campaign profitability.
- Analyze source-specific performance with breakdowns of impressions, clicks, CPC, and CTR for each ad channel.
- Evaluate campaign effectiveness by comparing ad platform data with GA4 website analytics.
Built-in Looker Studio and powered by Coupler.io, this dashboard automates data collection and visualization. Simply connect your ad accounts and GA4, and your performance insights are generated instantly.
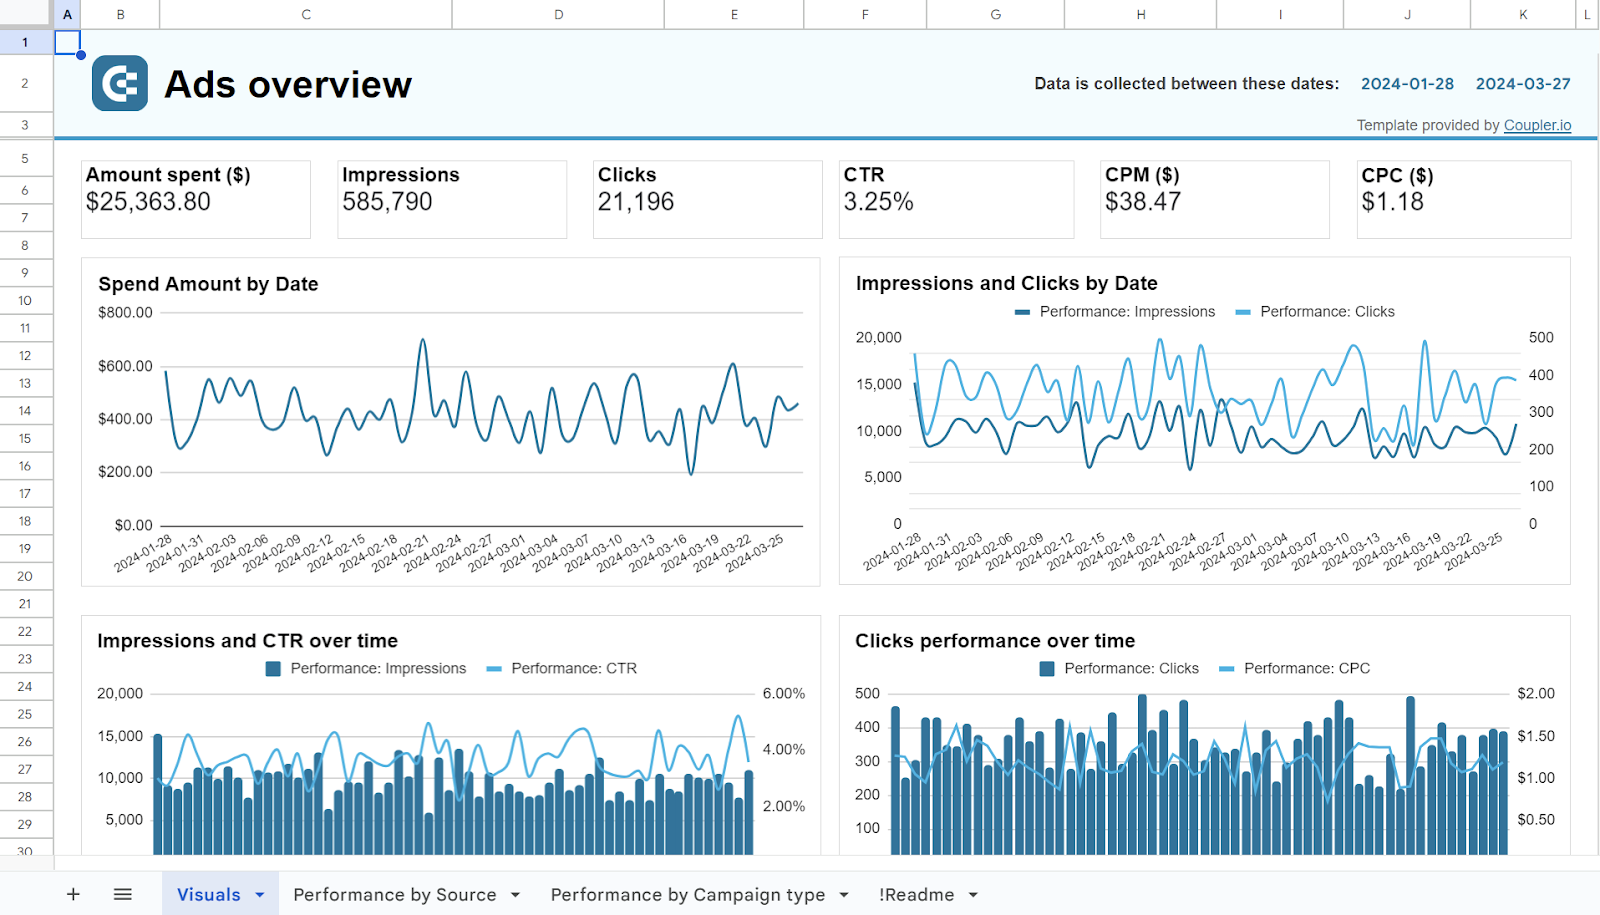
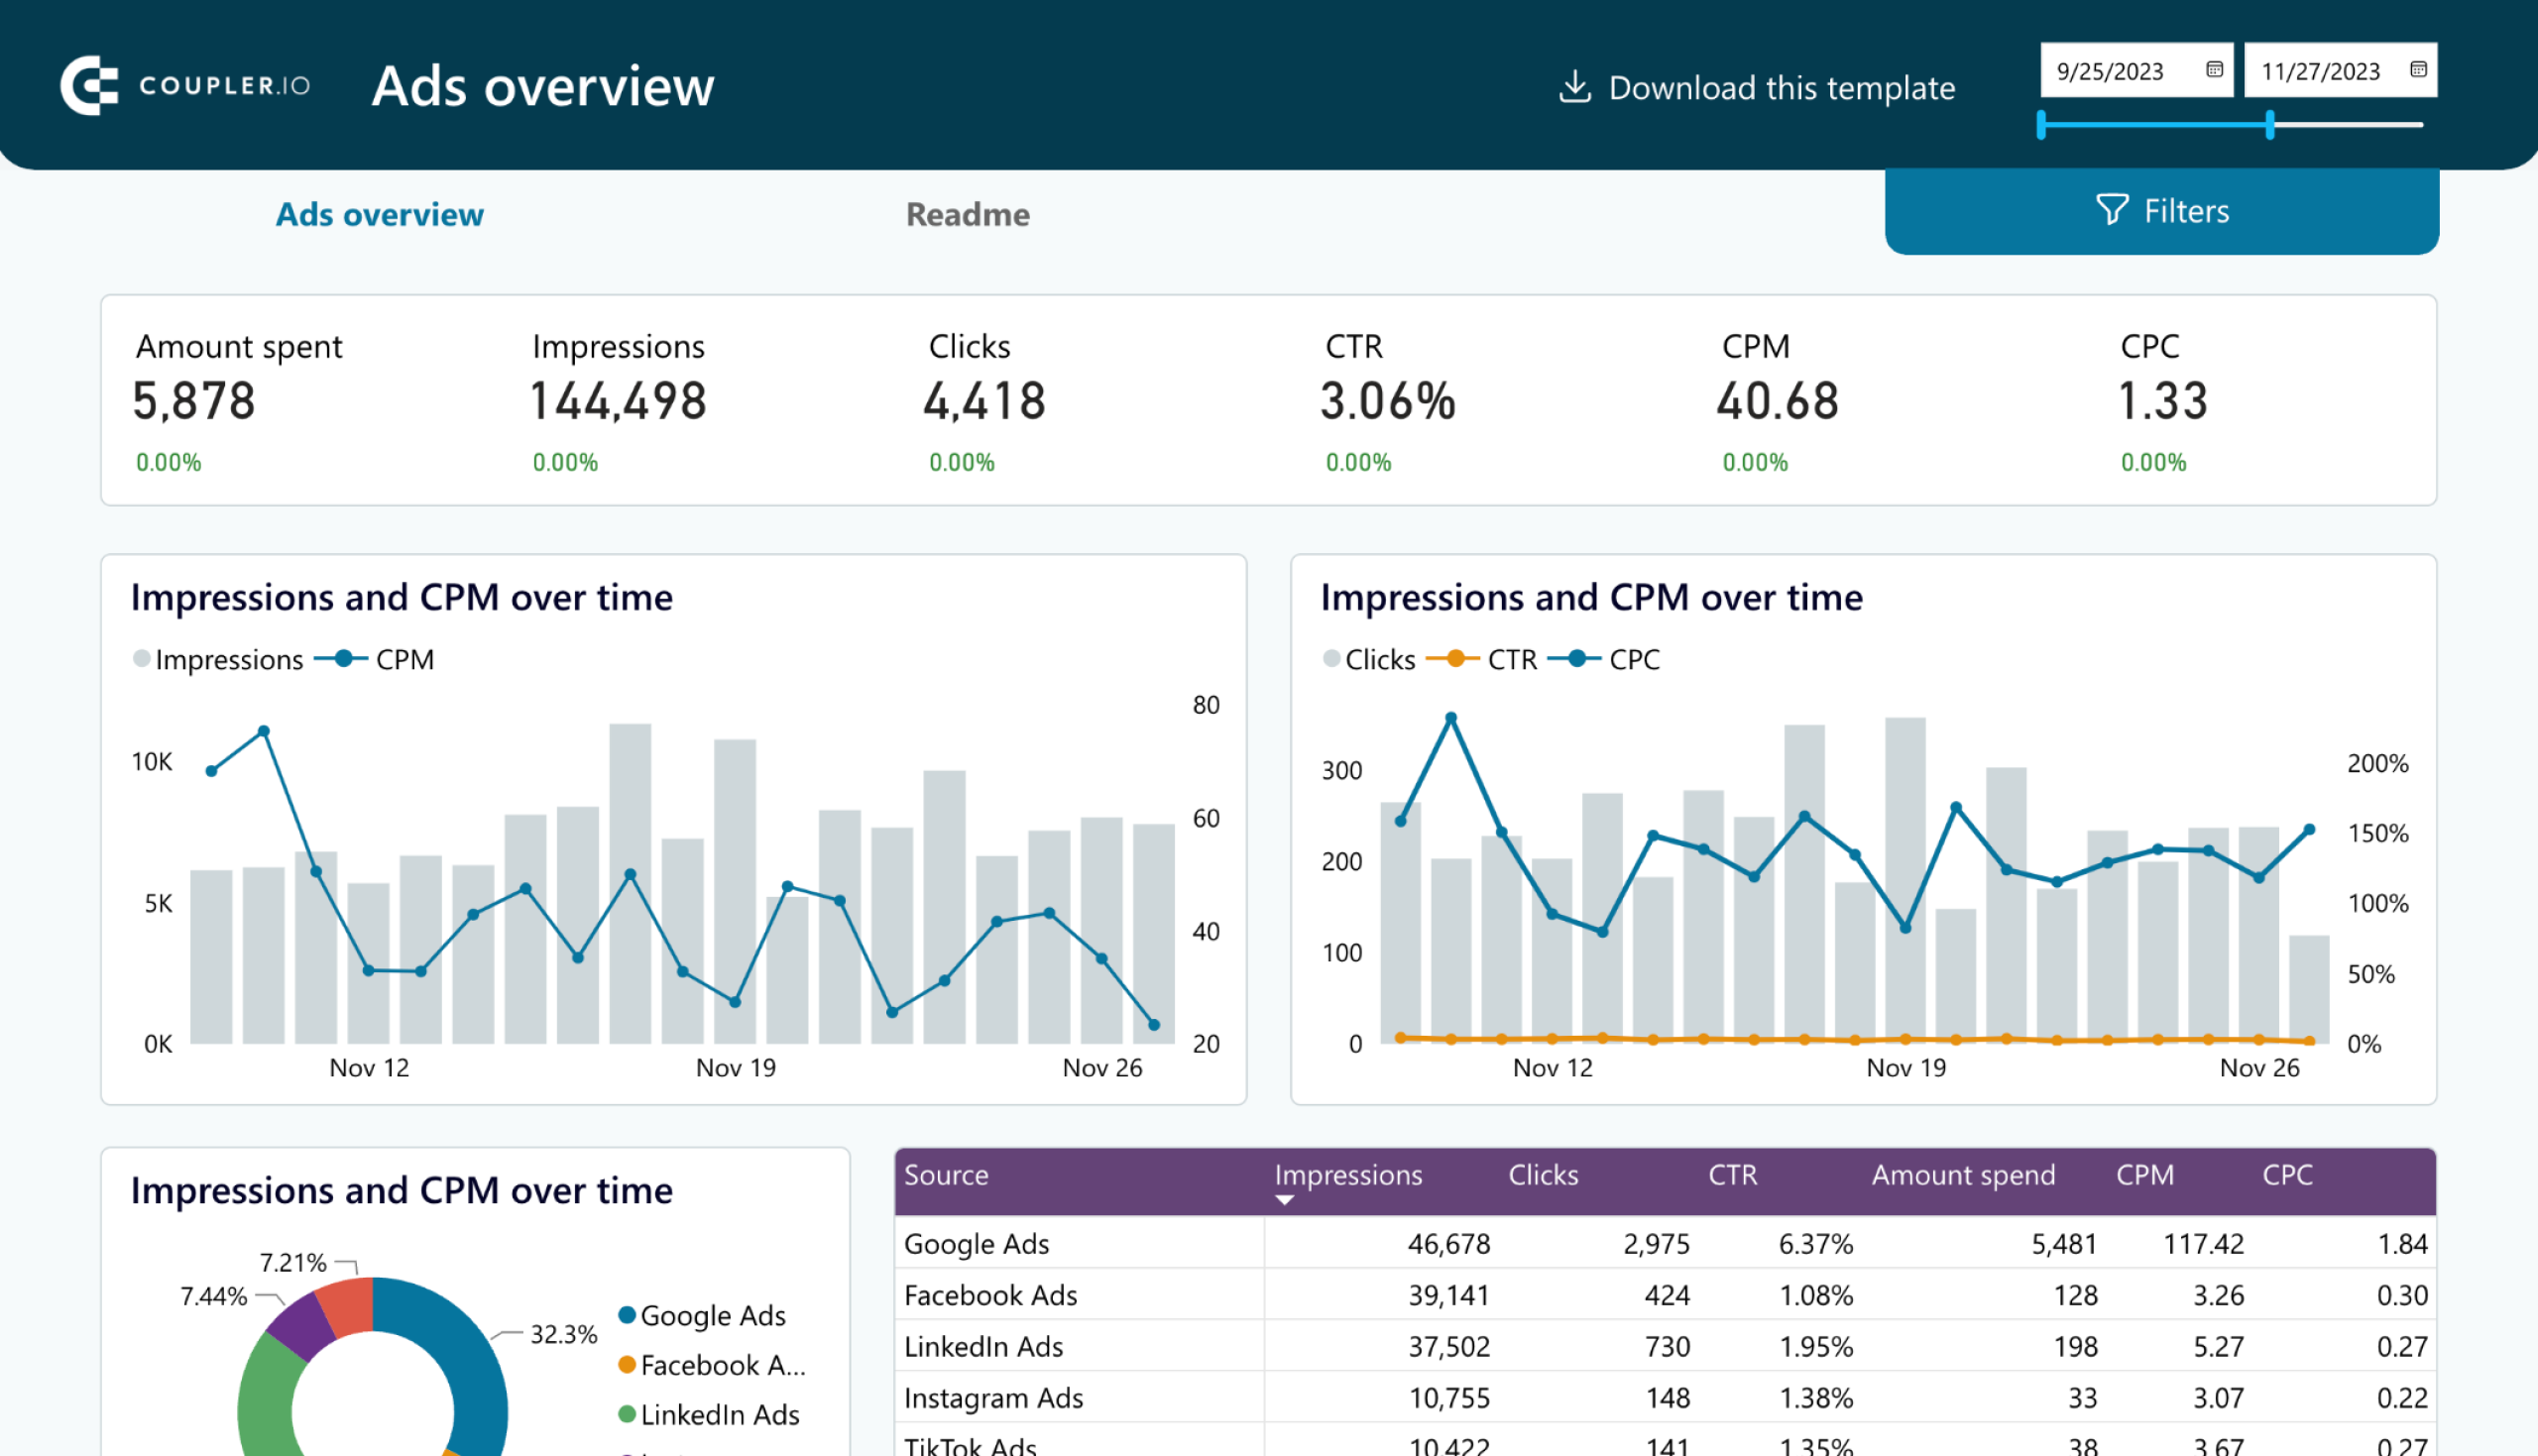
4. PPC monthly budget dashboard
The PPC monthly budget dashboard is useful for tracking advertising expenses across multiple platforms: Facebook, LinkedIn, Google, TikTok, Microsoft, Quora, and Twitter Ads.
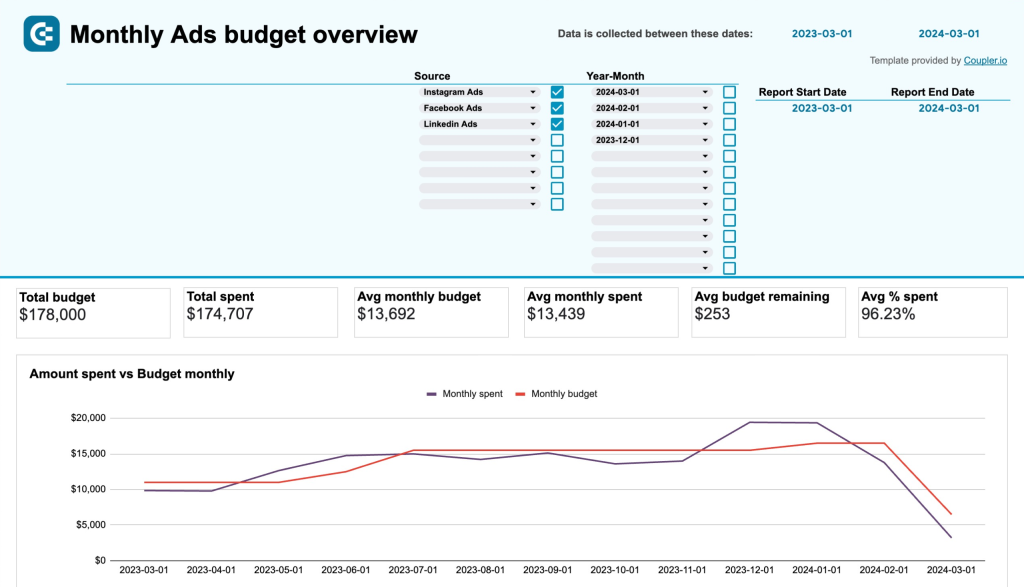
It provides a clear breakdown of budget allocation, spending trends, and projected costs, ensuring better financial control over PPC campaigns.
With this dashboard, you can:
- Monitor monthly ad spend trends and compare them to your budget.
- Identify overspending or underspending patterns and adjust accordingly.
- Analyze ad platform-specific budgets to optimize resource allocation.
- Track average daily costs and spending predictions to prevent budget overruns.
- Receive alerts and insights on whether your current spending is within budget or needs adjustment.
The template is built in Google Sheets by Coupler.io. To get this dashboard with your data, connect your ad platforms by following the instructions in the Readme tab.
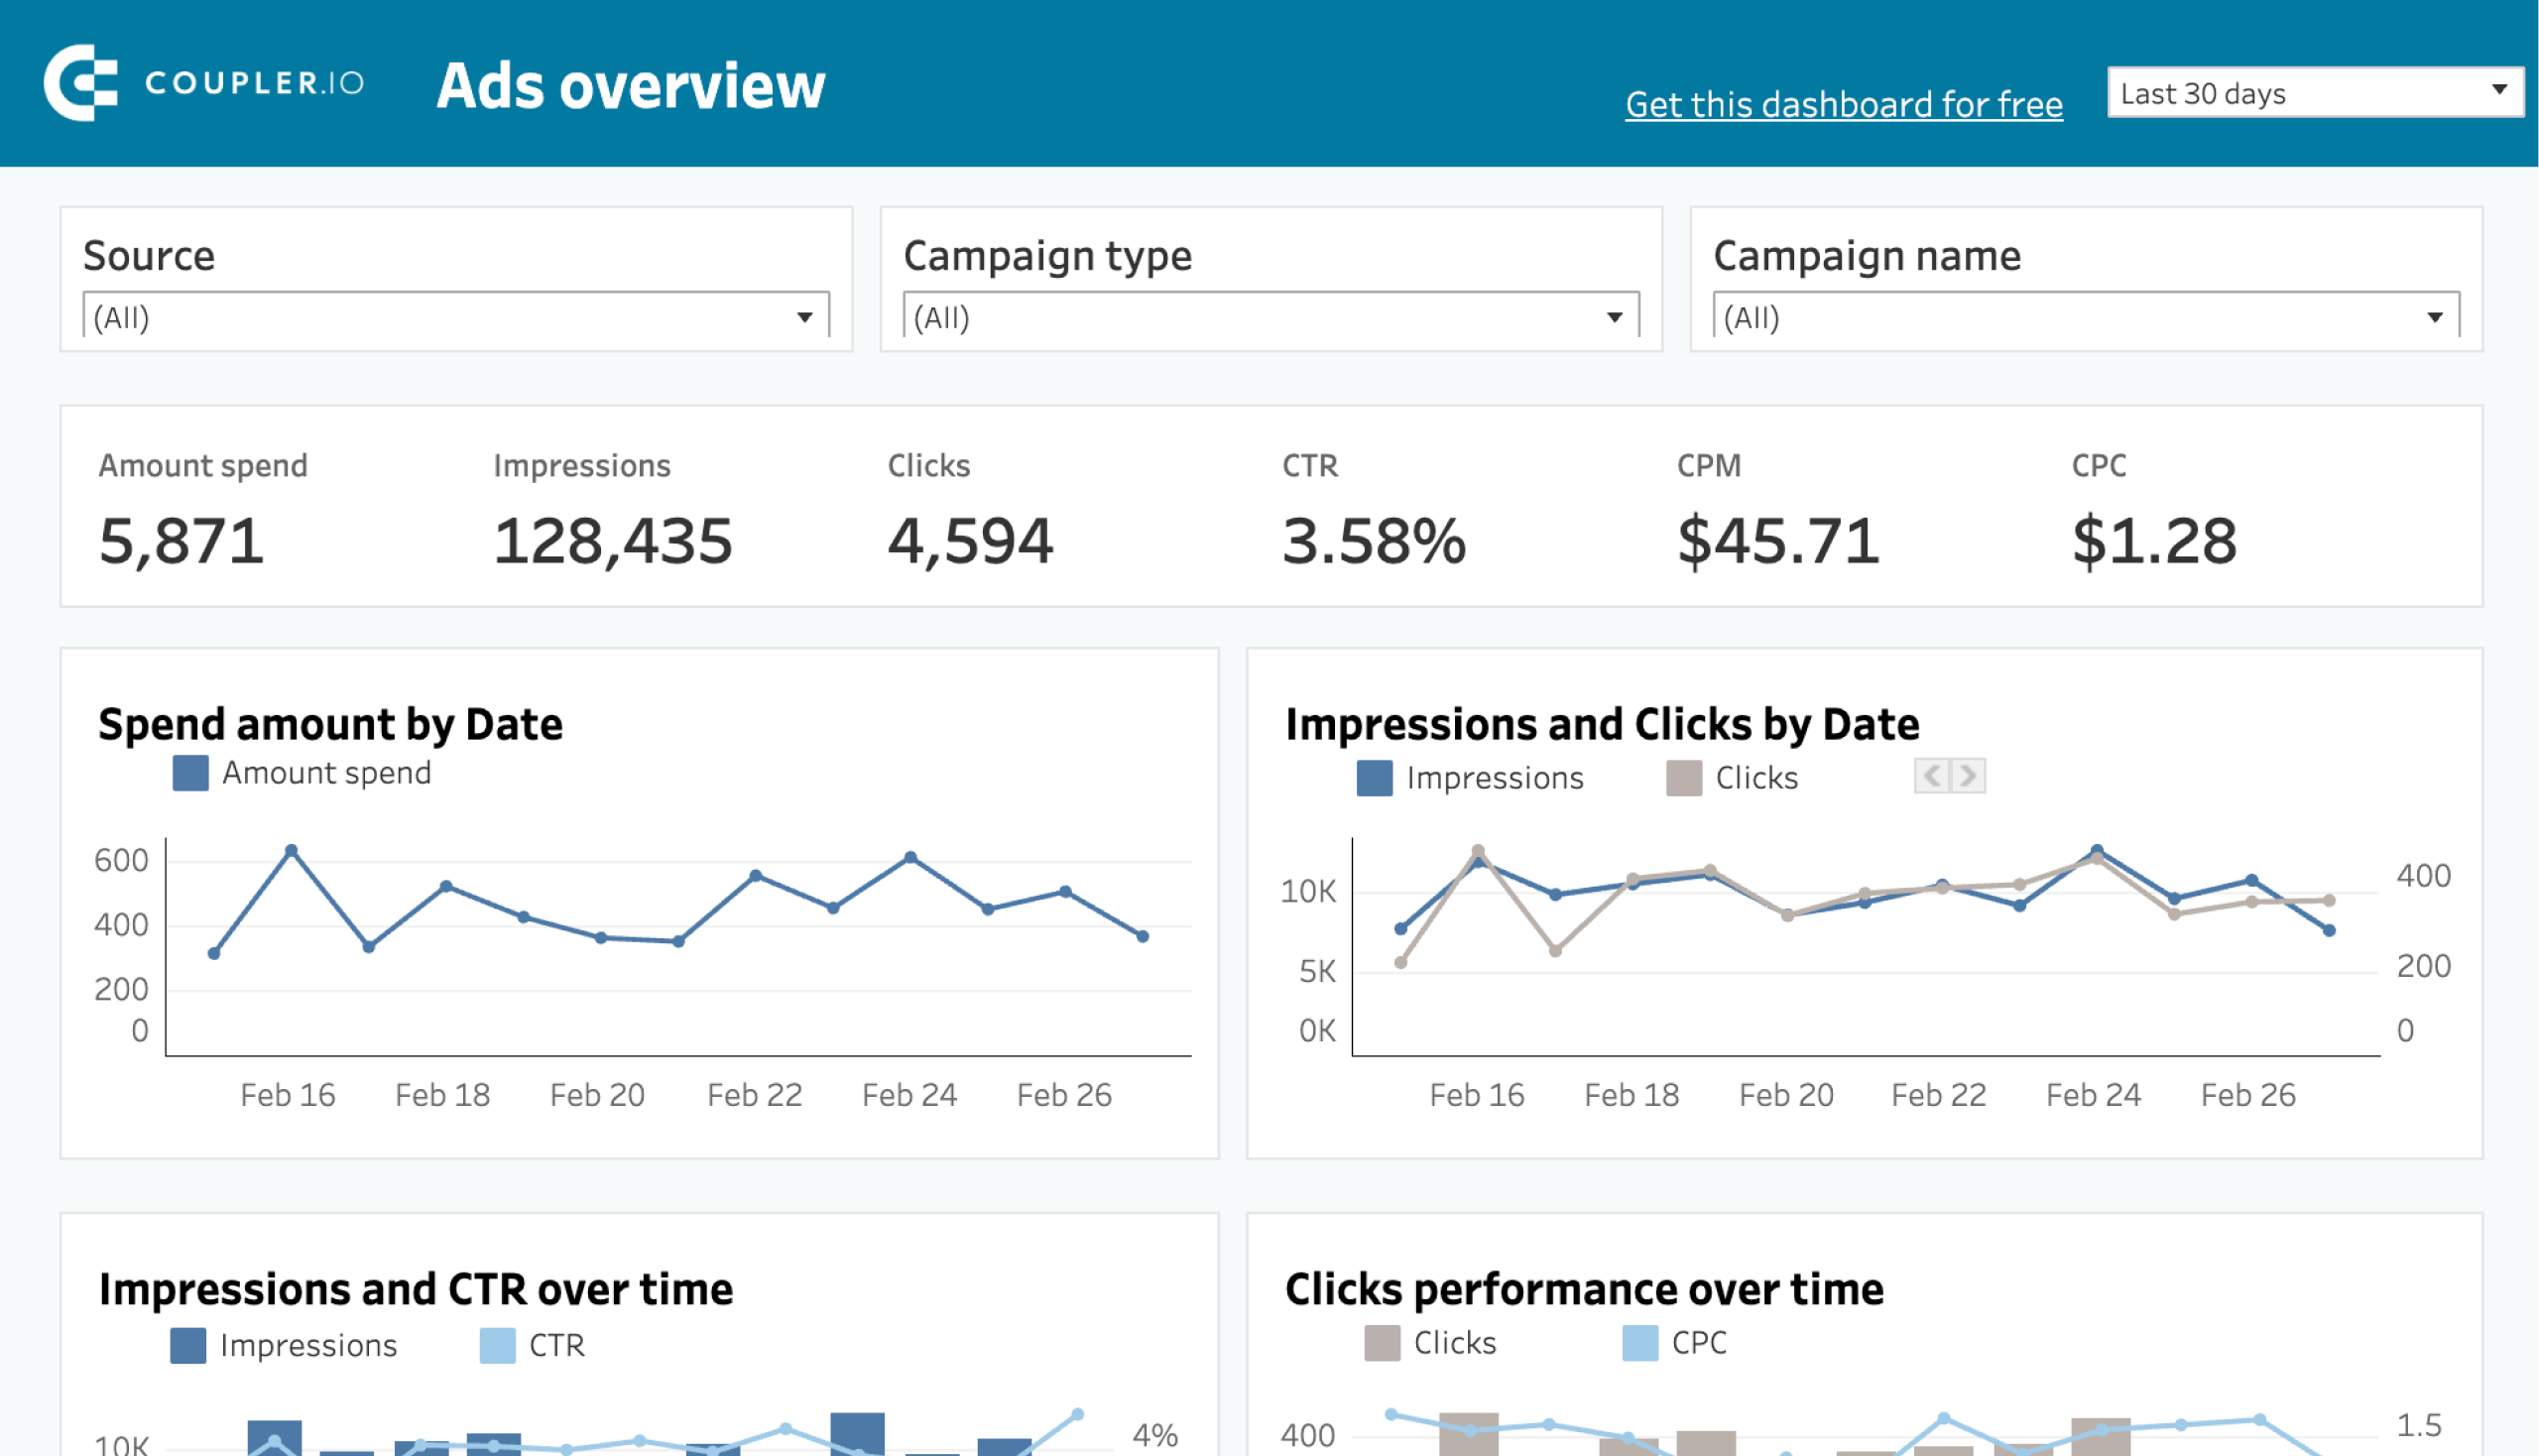
5. Advertising budget forecast dashboard
Similar to the dashboard above, this template is built for marketers who manage advertising budgets on multiple platforms. It helps monitor cross-platform PPC budget allocation and track campaign performance in near-real-time.
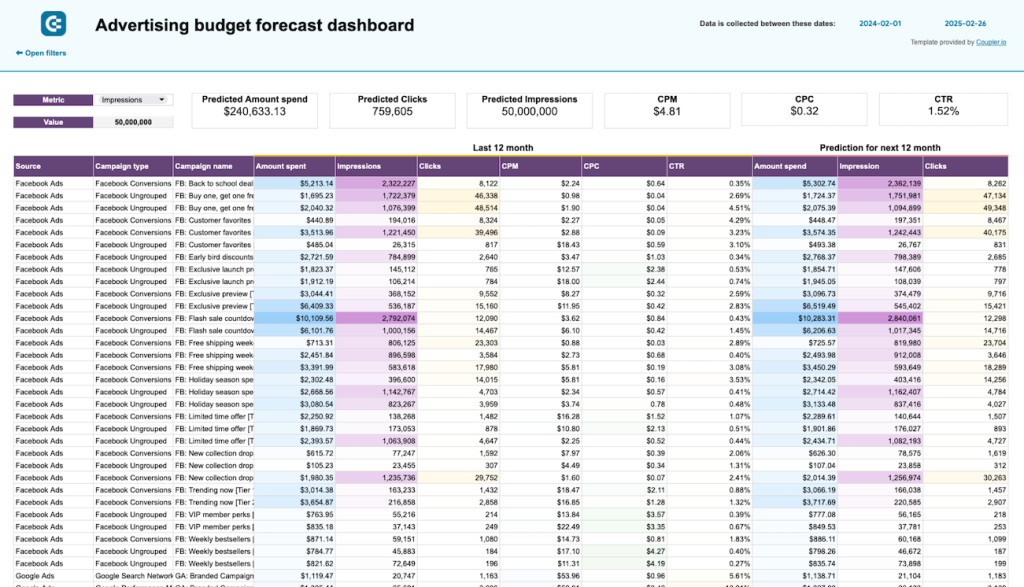
With this dashboard, you can:
- Forecast future campaign outcomes by key metrics: amount spent, impressions, and clicks. This information can help you avoid overspending and optimize budget allocation for different campaigns and platforms.
- Compare the budgets you planned for this month with what you actually spent on each platform.
- Create more cost-effective campaigns by monitoring your remaining budget and avg. daily spend.
- Get a complete overview of performance dynamics based on metrics like clicks, by source, CPC by campaign type, amount spent by month, etc.
- Identify over- or underperforming platforms and adjust your paid ads investments accordingly.
- Receive alerts when your monthly spending for a specific platform exceeds the budgeted amount, so you can take corrective action right away.
The template is available in Google Sheets. You can make a copy by signing up for a free Coupler.io account – the whole process takes less than 5 minutes to complete!
How to do daily analysis of PPC + weekly and monthly checklists
The frequency of PPC analysis varies depending on the metrics you deal with. Some of them should be tracked daily, while others provide insights only if you check them weekly or monthly. In either case, consistency is essential for PPC tracking.
Daily PPC campaign analysis
- Review your budget to avoid overspending. Keep track of your daily costs and check for any fluctuations in expenses.
- Pay attention to your CTR to detect any unexpected decreases or increases in clicks.
- Monitor the performance of expensive keywords to make sure you don’t waste your budget and identify areas where you could make some bid adjustments.
- Keep an eye on search impression share to adjust bids if needed.
- Check out the search terms report periodically. This could help you discover the keywords that cost you too much or don’t prove to be relevant. You could also implement some negative keywords to eliminate unwanted traffic.
- See how well your ad extensions perform. That’s how you know whether you need to optimize or pause any of them.
- Adjust your bids in real time. You could raise your bids for high-performing keywords and lower them for underperforming ones.
Weekly PPC campaign analysis
- Undertake a performance review. Evaluate the performance of your campaigns every week. This way, you could identify some trends and issues to be addressed.
- Calculate the PPC ROI to determine whether it’s sufficient in terms of your business goals.
- Analyze the results of your current A/B tests to learn whether you need to make any adjustments.
- Check your keywords for the Quality Score. This could help you detect low-quality keywords and improve your ads based on these findings.
- Pay attention to PPC budget management and distribution to check whether it’s efficient enough. First of all, allocate it to the most successful campaigns or ad groups.
- Consider ad performance across different geographical regions. If necessary, modify your geotargeting settings.
- Figure out how your ads behave on desktop, mobile, and tablet devices. Upon this analysis, make adjustments to your bids and ad copies for each device type.
- Check out the weekly search terms report to go through the list of your negative keywords and include additional ones.
Monthly PPC campaign analysis
- Carry out a monthly performance review. Check how your performance compares to that in previous months. Evaluate your current progress toward the ultimate objectives.
- Keep track of your competitors, analyzing their ads and strategy. Monitor any changes they make to their advertising and spot new competitors.
- Review the customer journey to determine where you could refine your ads funnel.
- Look at data on your target audience. This way, you could enhance the existing audience segments or create new ones for better advertising results.
- Assess how all of your landing pages perform. That’s how you know which changes you could make to elevate user experience and boost conversions.
- Plan your budgets for the next month in advance by considering your ad performance and objectives.
- Learn how effective your ad schedules prove to be. Use these insights to improve the timing of your ads.
- Make sure your ad messaging is relevant and compelling enough to attract the attention of your target audience.
Learn more about performance marketing for SaaS and the PPC statistics you should pay attention to in 2025.
How to analyze PPC campaign – key metrics
Now that we’ve explored PPC analysis step by step, let’s talk about relevant metrics. By tracking these measurements and drawing conclusions from them, you maximize the value of your analytics. Here are the primary PPC metrics to consider:
- Impressions. This metric represents the number of times an ad is displayed to a user. For instance, if the same ad is shown to a user 10 times, the number of impressions would be 10. This is how you know the visibility of your ad.
- Link clicks. That’s the number of times a user clicks on your ad. The link can direct the user to various destinations such as a website, app, messaging app, Instagram account, or call. This measurement helps you understand the level of engagement your ad has had with the target audience.
- CTR. This stands for click-through rate and lets you know how often users who see your ad click on it. To calculate CTR, you divide the total number of clicks by the total number of impressions and then multiply the result by 100. This way, you find out how relevant and effective your ad proves to be.
- CPC. Cost per click (CPC) is the metric that indicates how much you pay for each click on your ad. To calculate it, divide the total number of clicks by the total cost. By tracking this metric, you can enhance cost management and allocate your budget more efficiently.
- CPM. Abbreviated from “cost per mile,” it refers to the cost of your ad being displayed a thousand times to users. This is especially useful for evaluating the cost efficiency of your ad campaign.
- Amount spent. This is the amount of money spent on the ad campaign during a specific period. It illustrates the campaign’s reach and demonstrates how the budget is distributed to achieve the ad objectives.
- Conversions reflect the number of users who have taken a desired action after interacting with your advertisement. This could be downloading, making a purchase, booking a demo, or any other action you define.
- Cost per conversion. This metric measures your expense per conversion. To calculate it, simply divide the total cost of the campaign by the number of conversions. That’s how you check out the profitability and effectiveness of your PPC campaigns.
- ROAS. Return on ad spend (ROAS) assesses the revenue generated by your advertising relative to the budget spent. A higher ROAS indicates greater PPC campaign performance.
- Conversion rate is the percentage of conversions in relation to clicks on your ad. You can calculate it by taking the number of users who converted and dividing it by the number of clicks. A high conversion rate is a sign of a cost-efficient PPC campaign.
Top tools for PPC campaign analysis
To monitor the metrics mentioned above and perform other steps of PPC analysis, you’ll need tools that streamline this process. Learn about several examples of such applications below:
1. Google Analytics 4 (GA4) is a tool that informs you how your target audience interacts with your website. It can monitor various actions on diverse platforms and devices, including clicks, scrolls, purchases, etc. Furthermore, GA4 tracks customer experience with your website, helps you understand customer behavior, and provides custom reports on advertising performance.
2. Opteo keeps track of performance data in your Google Ads account and recommends optimizations based on this monitoring. You can run these optimizations automatically without switching between interfaces. Some of the optimizations include:
- Management of keyword bids
- Control over your budget
- Ad schedule optimization
- Real-time alerts
- Search terms analysis
3. Spyfu analyses your competitors’ PPC campaigns and lets you know which keywords they use. That’s how you get new keyword ideas for your advertising, identify the keywords missing from your campaigns, and estimate the expenses you’ll incur. When doing PPC competitor analysis with Spyfu, you can:
- Detect every keyword the competitor has ever purchased
- Discover your competitors’ projected monthly budget
- Apply filtering to focus your analysis on particular keywords
- Learn how long the competitor has been running ads for a specific term
4. Ad Libraries. To analyze your competitors’ advertising strategies, you can also use Ad Libraries by Meta, Microsoft, or TikTok, Ads Repository by X (Twitter), Quora Ads Resource Library, and others. These public catalogs of ads let you know what your competitors are marketing, reveal their messaging to you, and help you explore their advertising styles and methods.
5. Microsoft Clarity. If you want to discover which parts of your website engage your audience the most, Microsoft Clarity is the solution you need. This tool visualizes user experience, helping you understand how your customers navigate and interact with your website. You could get these insights through features like dashboards, heatmaps, session recordings, etc.
6. Coupler.io is a professional solution for advanced marketing analytics. It helps you create simple reports for PPC analysis by automatically importing data from 70+ apps and querying it on the go. With this tool, you don’t need to manually export data from the source and load it to the destination, which could take you about 10 minutes a day. This way, you can save 3 business hours per month! In addition to data flow automation, Coupler.io offers plenty of ready-to-use PPC reports like this Google Ads dashboard template.
7. Looker Studio is a tool you can use to visualize raw data, importing it from various sources, as we’ve done through Coupler.io earlier in the article. This allows you to build reports and dashboards with meaningful charts, maps, graphs, tables, and the like. You can also apply viewer filters and date range controls, making your reports even more interactive.
Why do I need PPC analysis?
By performing PPC data analysis correctly, you achieve the following:
- Improvement in your ad performance. Through PPC analysis, you get data-driven insights to enhance your ad campaigns. For example, you can identify the best-performing keywords to implement, elevating your advertising results.
- Cost optimization. By analyzing metrics like CPC, CPM, amount spent, etc., you can evaluate the cost efficiency of your PPC campaigns. This enables you to make cost adjustments in case of overspending or other related issues, optimizing your ad spend.
- Better results for your business. Enhancement of advertising performance, combined with ad spend optimization, helps you achieve your PPC goals cost-effectively. Looking at the bigger picture, this makes a valuable contribution to your business outcomes.
To make the most of your PPC analysis, you should definitely consider Coupler.io. It simplifies the creation of straightforward reports based on advertising data. Export your data from the source, query it within the app, and import it to the destination automatically.
Let’s start by considering an example of creating a report to analyze the performance of ad data from Facebook Ads. This includes collecting ad data, preparing it for analysis, and visualizing key metrics. While we focus on Facebook Ads, the same approach applies to other PPC sources like Google Ads, LinkedIn Ads, and Bing Ads.
Step 1: Collect your Facebook Ads data
To start collecting your Facebook Ads performance data, choose your destination (preferably a visualization tool) in the form below and click Proceed to create a Facebook Ads dataflow.
<iframe src=”https://app.coupler.io/widget/integrations?source=facebook-ads&destination=” width=”800″ height=”400″></iframe>
After signing up for a free Coupler.io account, authorize your Facebook Ads Manager account.
- Select Reports & Insights to access the campaign, ad set, and ad-level data.
- Choose the date range for your report.
- Pick the metrics & dimensions you want to track (CTR, CPC, Conversions, etc.).
Before transforming your Facebook Ads data, you can add additional data sources to your report, like multiple Facebook accounts and other PPC sources.
Step 2: Organize and transform data
To better organize your data, use the data transformation features in Coupler.io.
For example, to make your analysis more detailed, break down your data into segments.
You can split it by campaign, ad group, or keyword. By comparing results across different segments, you can draw better conclusions about specific advertising areas. This will enable you to take appropriate actions regarding your campaigns.
With Coupler.io data transformation features, sort data by campaign or other parameters right after collecting it.
Click Sort, choose the Campaign name in the dropdown list, and select the order.
Additionally, in this step, you can rename, rearrange, hide, or add columns, apply filters, create custom formula-based columns, and merge data from multiple accounts or applications to refine your report.
You just created a custom report of your Facebook Ads data. Now, click Proceed to move to the next step.
Step 3: Load data and schedule data transfer
Configure the destination settings by following the instructions in the Coupler.io interface.
Set an automated data refresh to keep your reports up-to-date. Go to Flow Settings and select how frequently you want updates (daily, hourly, or every 15 minutes). Click Save and Run to enable automatic data transfer.
Once your data is in your chosen destination, you can visualize this data to analyze your Facebook Ads performance with real-time insights.
Instead of building a dashboard from scratch, take advantage of Coupler.io’s ready-made Facebook Ads dashboard. Click on Connect My Data and authorize your Facebook Ads account. The dashboard will auto-populate your own data within minutes within Coupler.io.
Step 4: Explain performance fluctuations
Once you analyze your data, you might notice an uncommon decrease or increase in any metric. If that’s the case, figure out why this has been happening. By discovering the reasons for performance swings, you can gain actionable knowledge and define the issues to be solved.
Step 5: Test your hypotheses
PPC analysis allows you to measure the results of your hypothesis testing regarding ad performance.
For instance, you might suppose that including prices in your ads will improve the conversion rate by attracting potential buyers. You can check this through A/B testing, or split testing. Launch different versions of your advertising, analyze the results, and learn which is more effective.
Step 6: Analyze the competition
Review campaigns launched by your competitors to see what they both implement and avoid. You may discover the keywords they use and identify the gaps to fill, analyze the phrases included in their ads, look at their destination URLs, etc.
By comparing your advertising data with that of your competitors, you can uncover opportunities to outperform them.
Visualize PPC data with ready-to-use templates
Check out the top PPC trends to understand what you should prepare for this year. You can also learn how to leverage first-party data to improve the accuracy of your PPC analyses.
Remember, you can also track your ever-changing ad performance: just select the schedule for automated data refresh and stay up-to-date. Start using Coupler.io today for free!

Automate data export with Coupler.io
Get started for free