Pay-per-click (PPC) ads on search engines and social media constitute the lion’s share of marketing activities and result in 200% ROI on average. When the numbers are lower for your brand, it means that you’re either investing in unpromising sources or considering the wrong metrics for PPC campaign evaluation. To place everything in order, try PPC report templates that embed the needed metrics and settings for popular ad channels.
Free PPC reporting templates by Coupler.io for digital marketing
Our journey starts with interactive PPC report templates by Coupler.io. These are available for different reporting tools including Google Sheets, Looker Studio, Power BI, and Tableau. All templates are equipped with built-in ad source connectors. This way, you can easily connect Google Ads, Facebook Ads, Instagram Ads, and other sources to automate data exports for your PPC campaign performance evaluation. You can customize these PPC report templates to your needs and use them for free.
#1 Multi-channel PPC performance report + templates
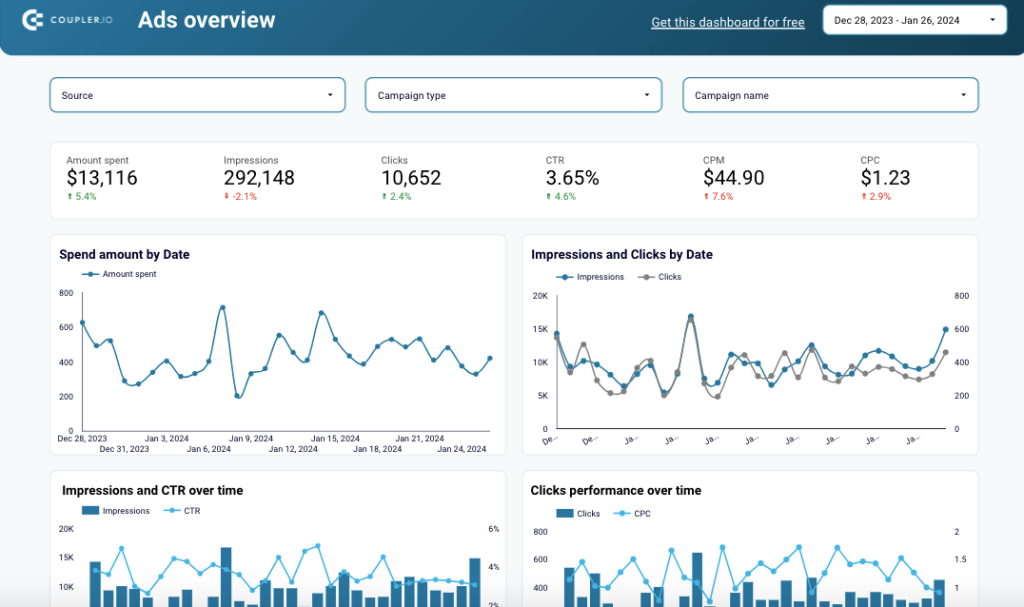
This PPC reporting dashboard would be of particular value to those marketers who run their ad campaigns across multiple platforms. It accumulates data from Google Ads, LinkedIn Ads, Facebook Ads, and other platforms, so you can monitor and compare campaign performance in one place.
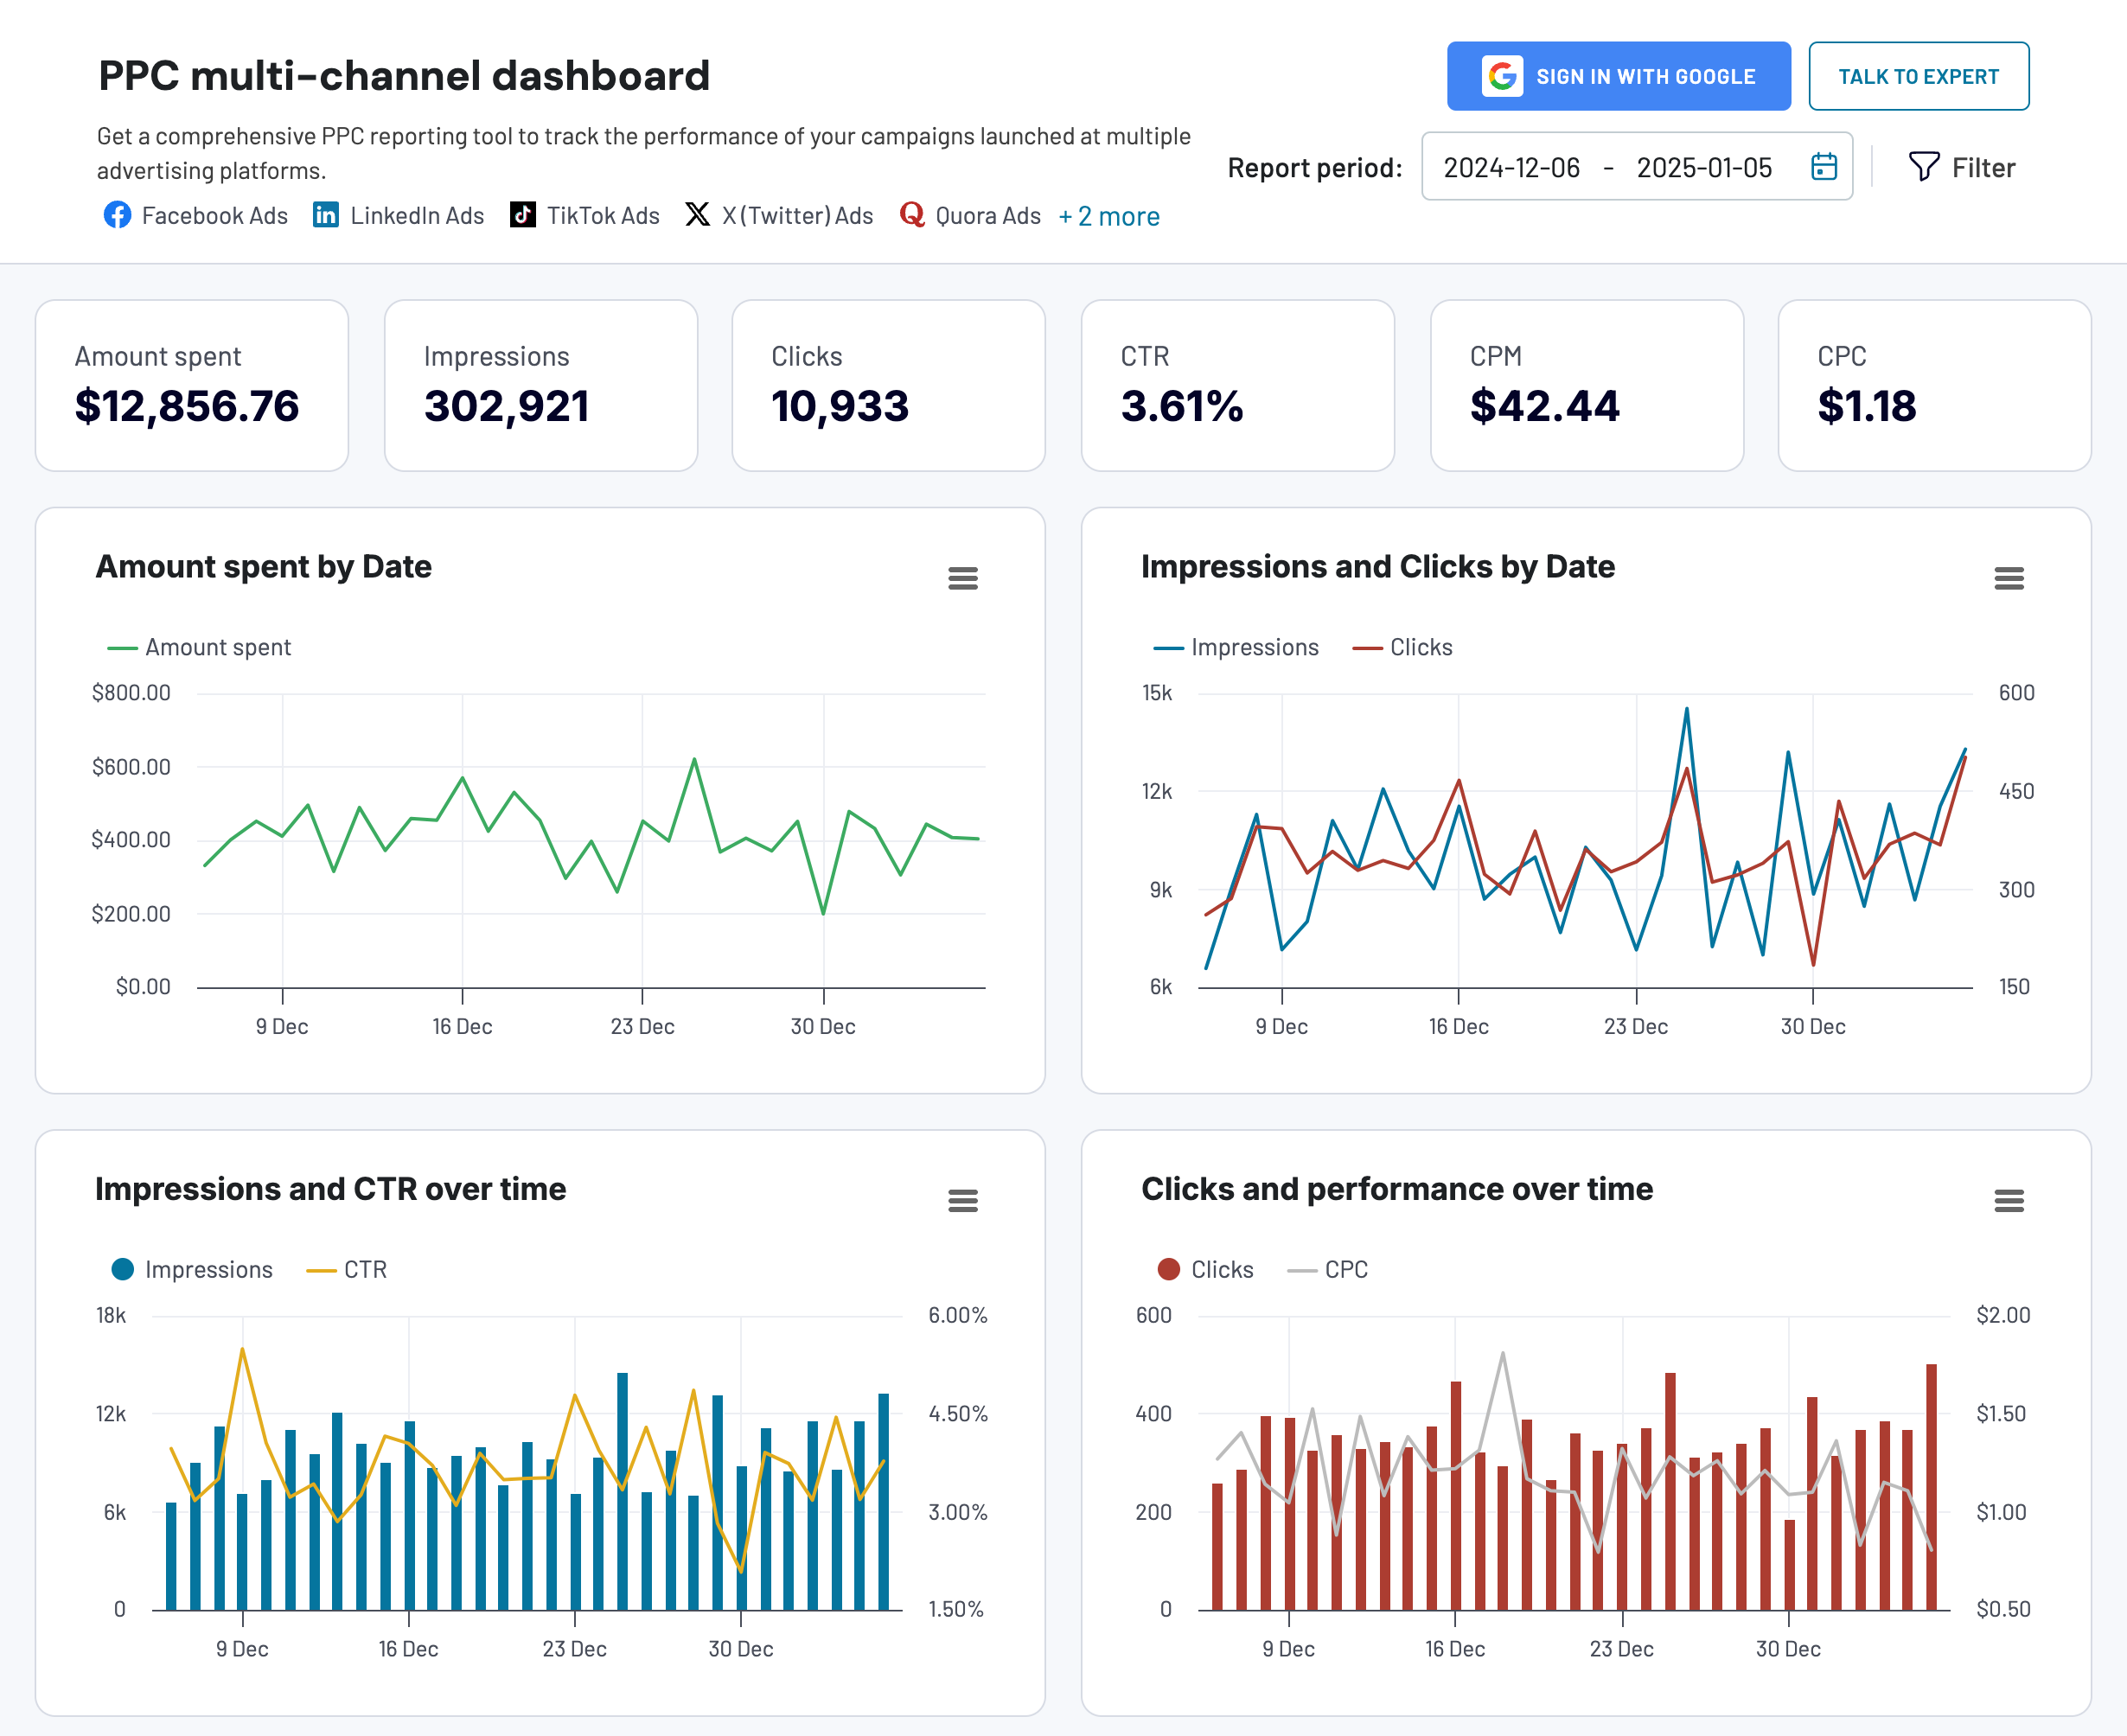
The dashboard provides an overview of campaign performance from different channels to compare the cost and impact. If you don’t work with all platforms included in the dashboard, you can easily exclude them and focus only on the critical performance indicators.
What insights you can get
- Compare performance across multiple ad platforms in one unified view
- Track key metrics like impressions, clicks, CTR, and spend by channel
- Identify the most cost-effective advertising platforms
- Monitor daily and weekly performance trends across all channels
- Analyze campaign-level performance to optimize budget allocation
The dashboard is designed by Coupler.io and you can easily connect your data sources using its built-in connector. It won’t cost you a penny to preview and try the dashboard with your data!
Additionally, you can use this dashboard as the PPC report template available for different data visualization tools. Try out the one that fits your reporting requirements.

PPC multichannel dashboard in Google Sheets
Use a PPC dashboard designed for Google Sheets to track the performance of your campaigns across multiple advertising platforms.


PPC multichannel dashboard in Looker Studio
Get a comprehensive PPC reporting tool to track the performance of your campaigns launched at multiple advertising platforms.

PPC multichannel dashboard in Power BI
Use a Power BI PPC dashboard for tracking and analyzing your advertising campaigns across multiple platforms.


PPC multichannel dashboard in Tableau
Track and analyze the performance of your advertising campaigns across various platforms using a one-stop PPC dashboard in Tableau

#2 PPC monthly budget dashboard template in Google Sheets
Similar to the first PPC multi-channel report template, this one also contains a variety of ad channels and metrics. However, there is one significant difference: this report template is designed to track your budget and ad expenses.
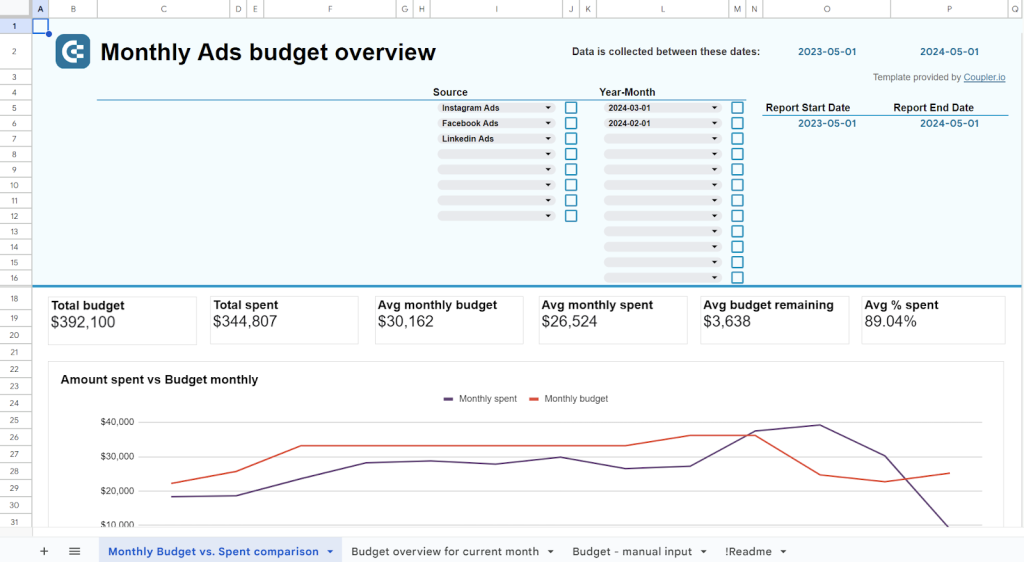
The PPC monthly budget dashboard provides a budget overview for the current month with spending predictions and alerts to avoid budget overspending. You can also track the dynamics of spending on advertising.
What insights you can get
- Track budget utilization against planned spend across platforms
- Forecast monthly spending to prevent budget overruns
- Monitor daily average costs for more predictable budget management
- Compare spending efficiency across different advertising platforms
- Identify spending patterns to optimize budget allocation timing
The template is designed in Google Sheets and lets you connect multiple ad source accounts to the dashboard.
#3 PPC monthly budget by campaign group dashboard template
This dashboard template is a must-have for marketers and small business owners who aim to manage and monitor their monthly PPC campaign budgets effectively. Its clear visualization helps you compare budget expectations against actual spending for different campaign groups, such as Traffic, Engagement, Leads, and more.
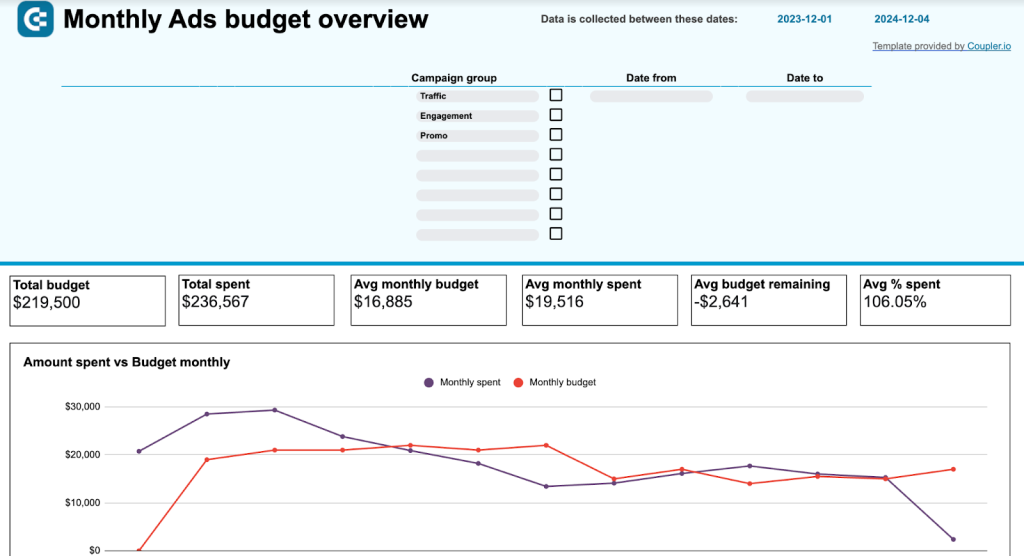
The dashboard provides an intuitive breakdown of your PPC campaigns, including the total budget, amount spent, and remaining budget. It has detailed charts, like Amount Spent vs. Budget Monthly and Budget Remaining by Month and Source, that give you actionable insights into overspending or savings.
The additional Monthly Budget Overview table offers a summary of predicted spend and daily spending trends, for accurate forecasting and control over campaign performance.
What insights you can get
- Track budget performance against actual spending by campaign group
- Compare budget expectations versus actual spending for different groups
- Monitor remaining budget to prevent overspending on campaigns
- Analyze daily spending trends to adjust budget allocation mid-month
- Identify high-performing campaign groups to optimize budget distribution
The PPC monthly budget by campaign group template is available in Google Sheets. You can easily set up and customize the template in minutes. Simply follow the setup instructions to input your PPC data from Google Ads, Facebook Ads, or any other ad source, and let the dashboard populate your monthly budget and spend analysis.
PPC report templates per dedicated ad platform
The first three templates appear to be the perfect solution for PPC experts who rely on multiple sources in their ad campaigns. However, not all companies need all these platforms to achieve success. What’s more, not all companies have the budget for that.
If you prefer to concentrate your marketing efforts on particular channels, we have designed the corresponding PPC reporting templates for you. Below, you’ll find Looker Studio marketing dashboard samples specifically designed for Google Ads, Facebook Ads, LinkedIn Ads, and so on.
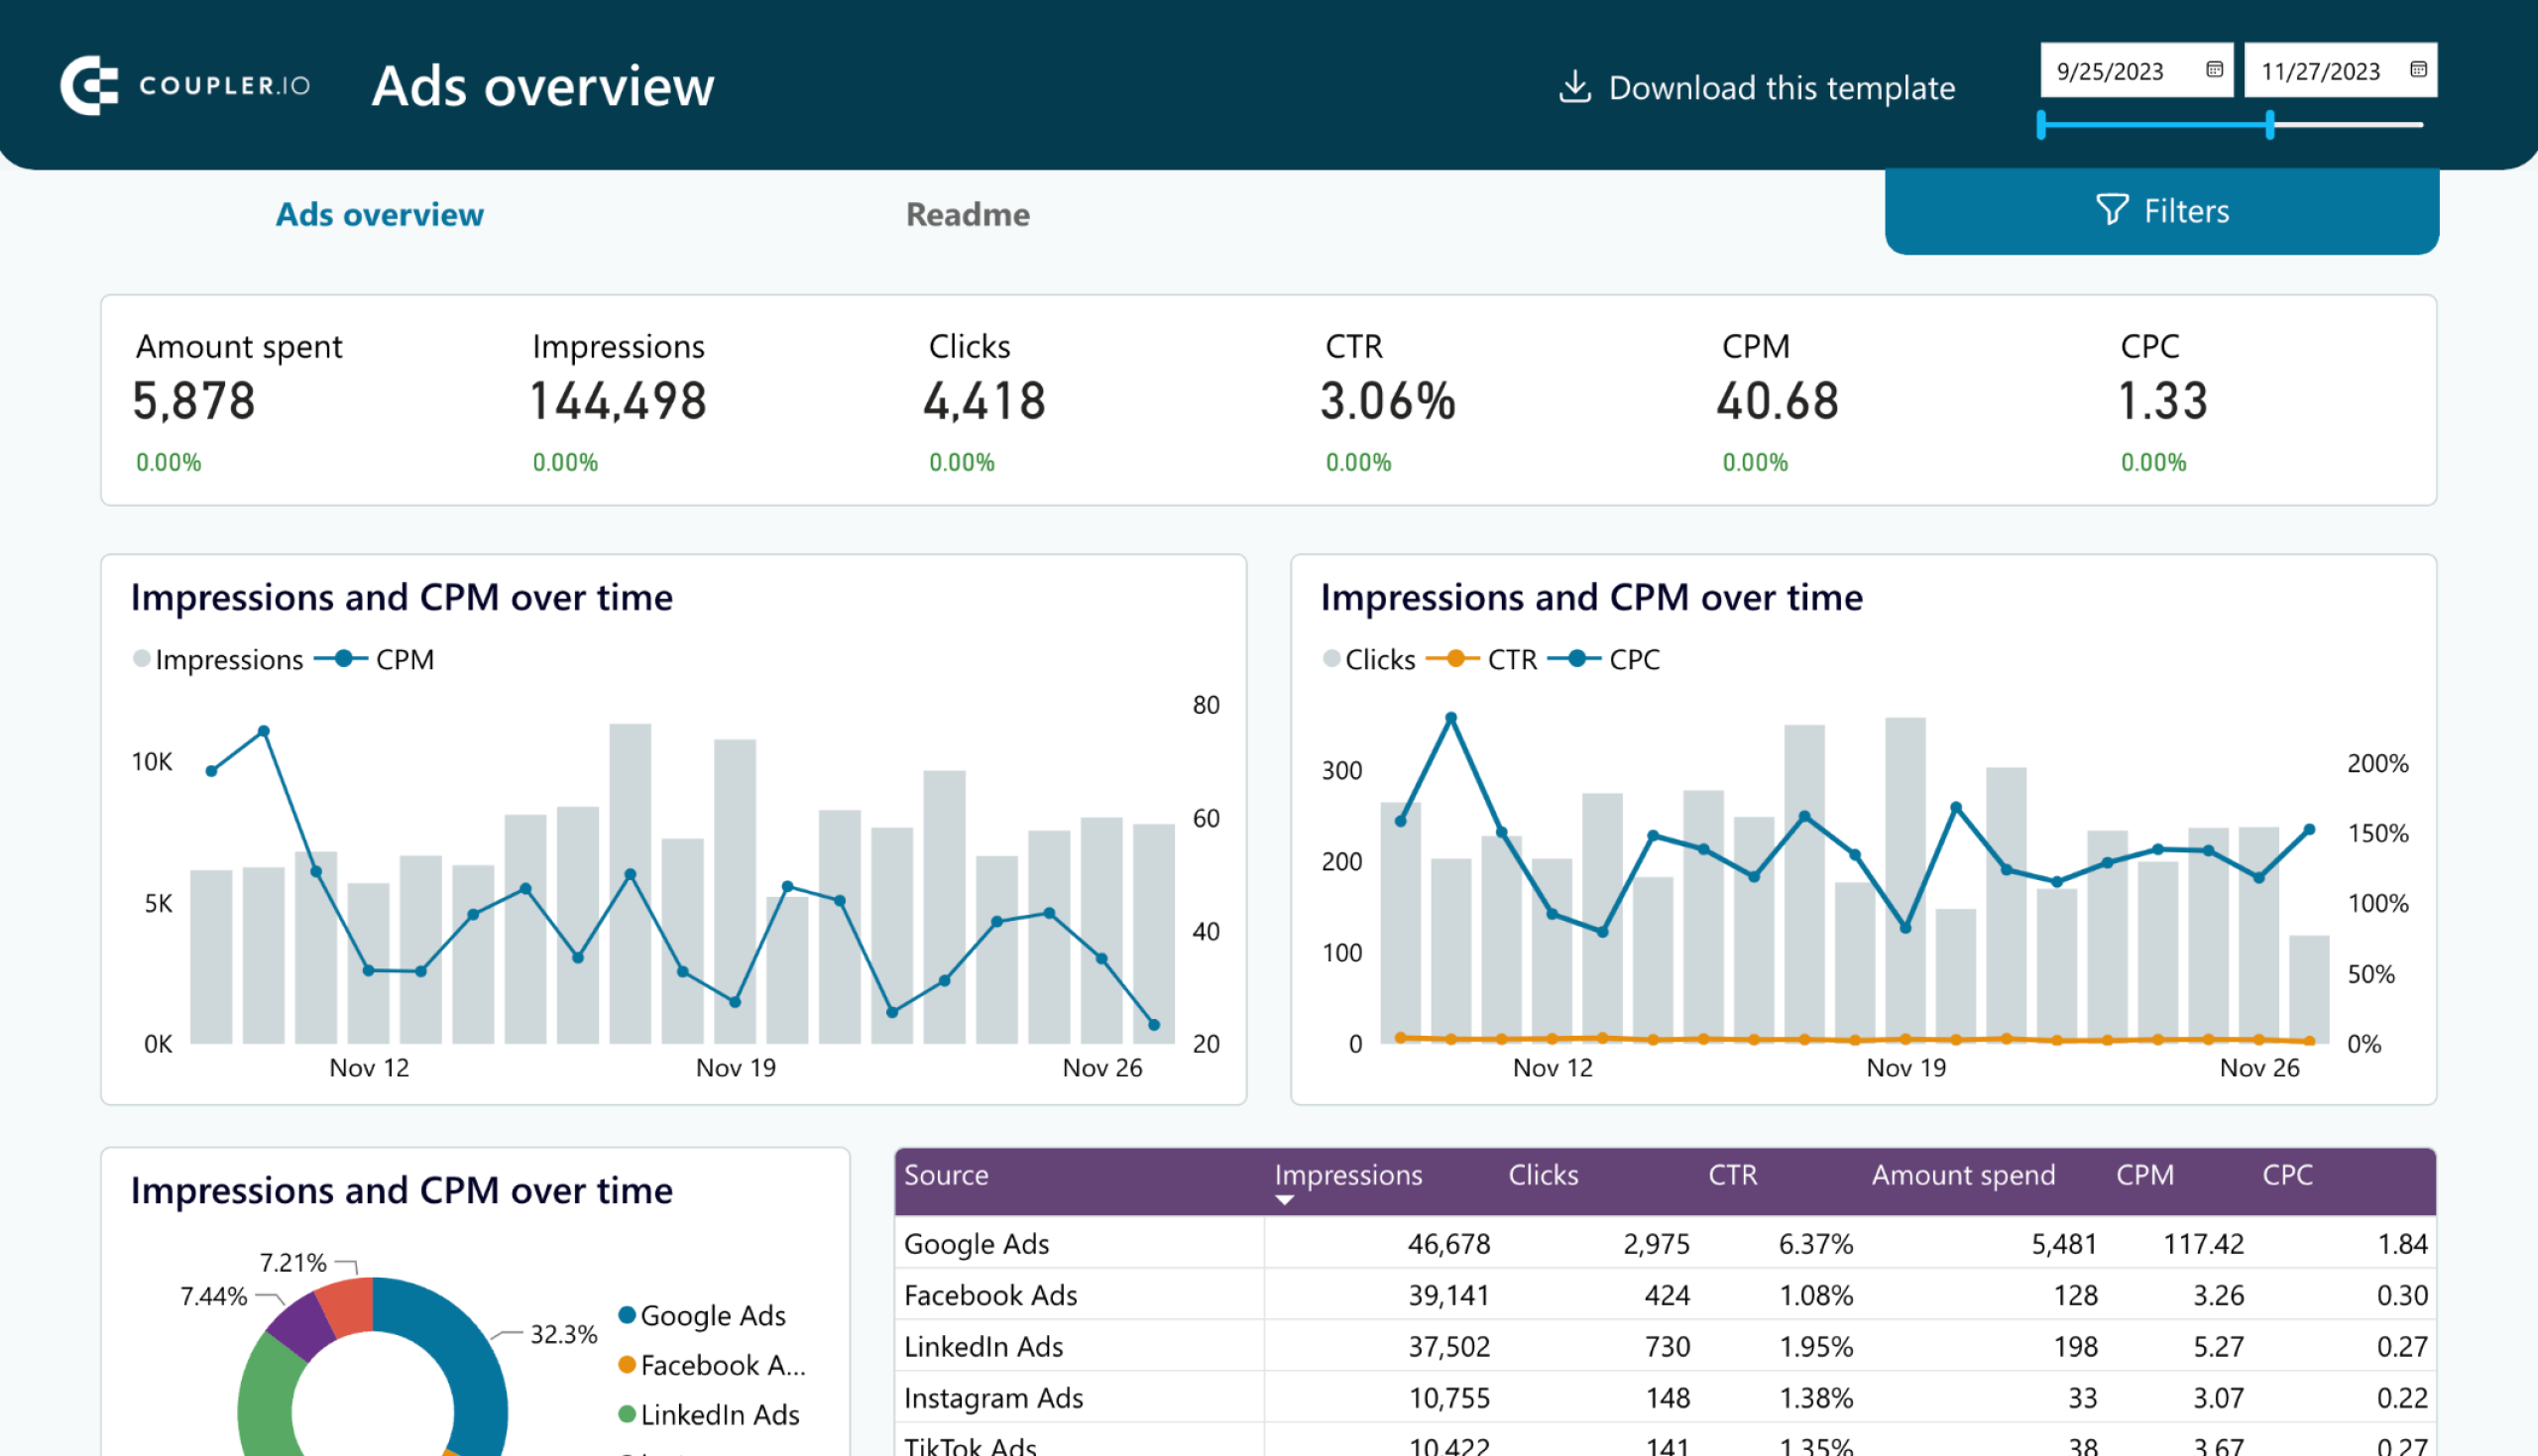
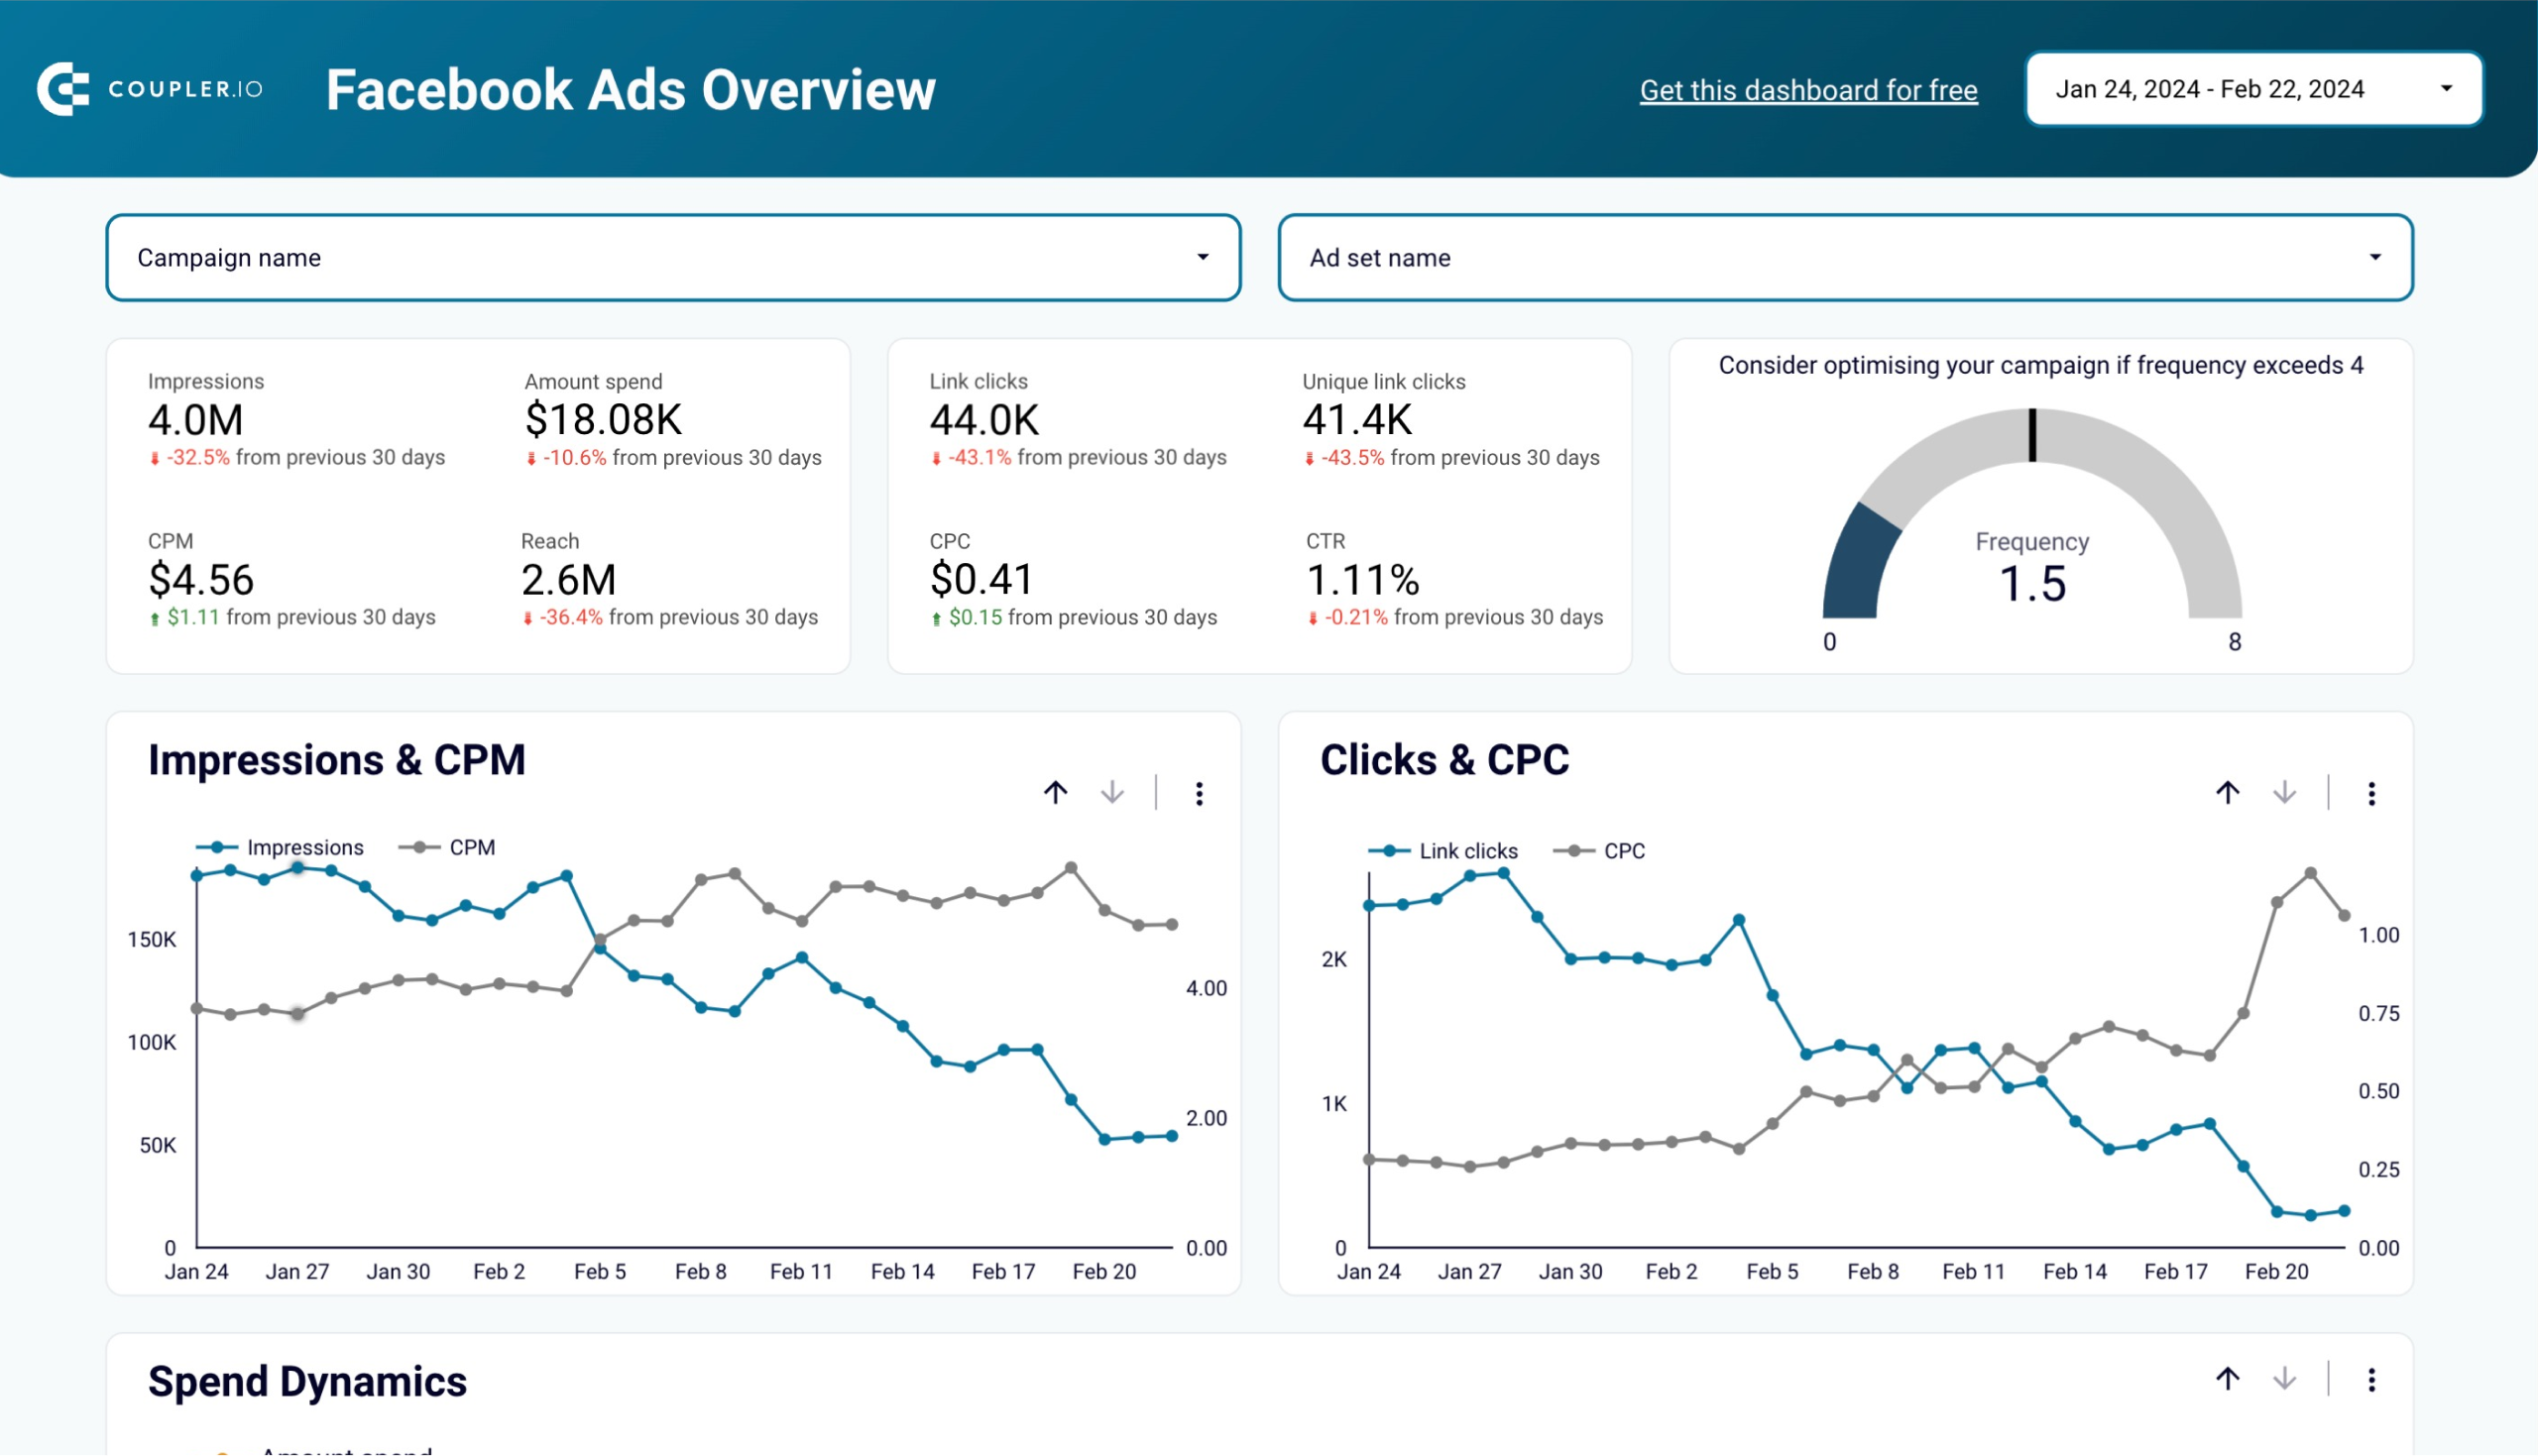
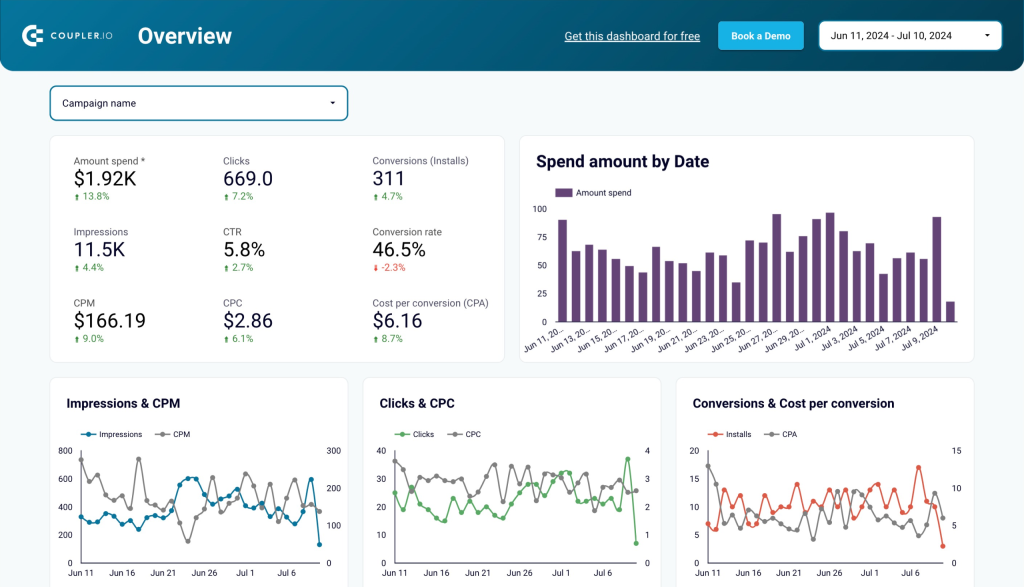
#4 Google Ads analytics report template
Recent statistics show that more than 80% of businesses use Google Ads globally. It’s a great instrument for improving your brand awareness and increasing sales. But anyway, this investment shouldn’t be fruitless, so the PPC dashboard for Google Ads campaigns by Coupler.io allows you to monitor key performance indicators such as conversion rate, cost per conversion, conversion value, cost per click, and more.
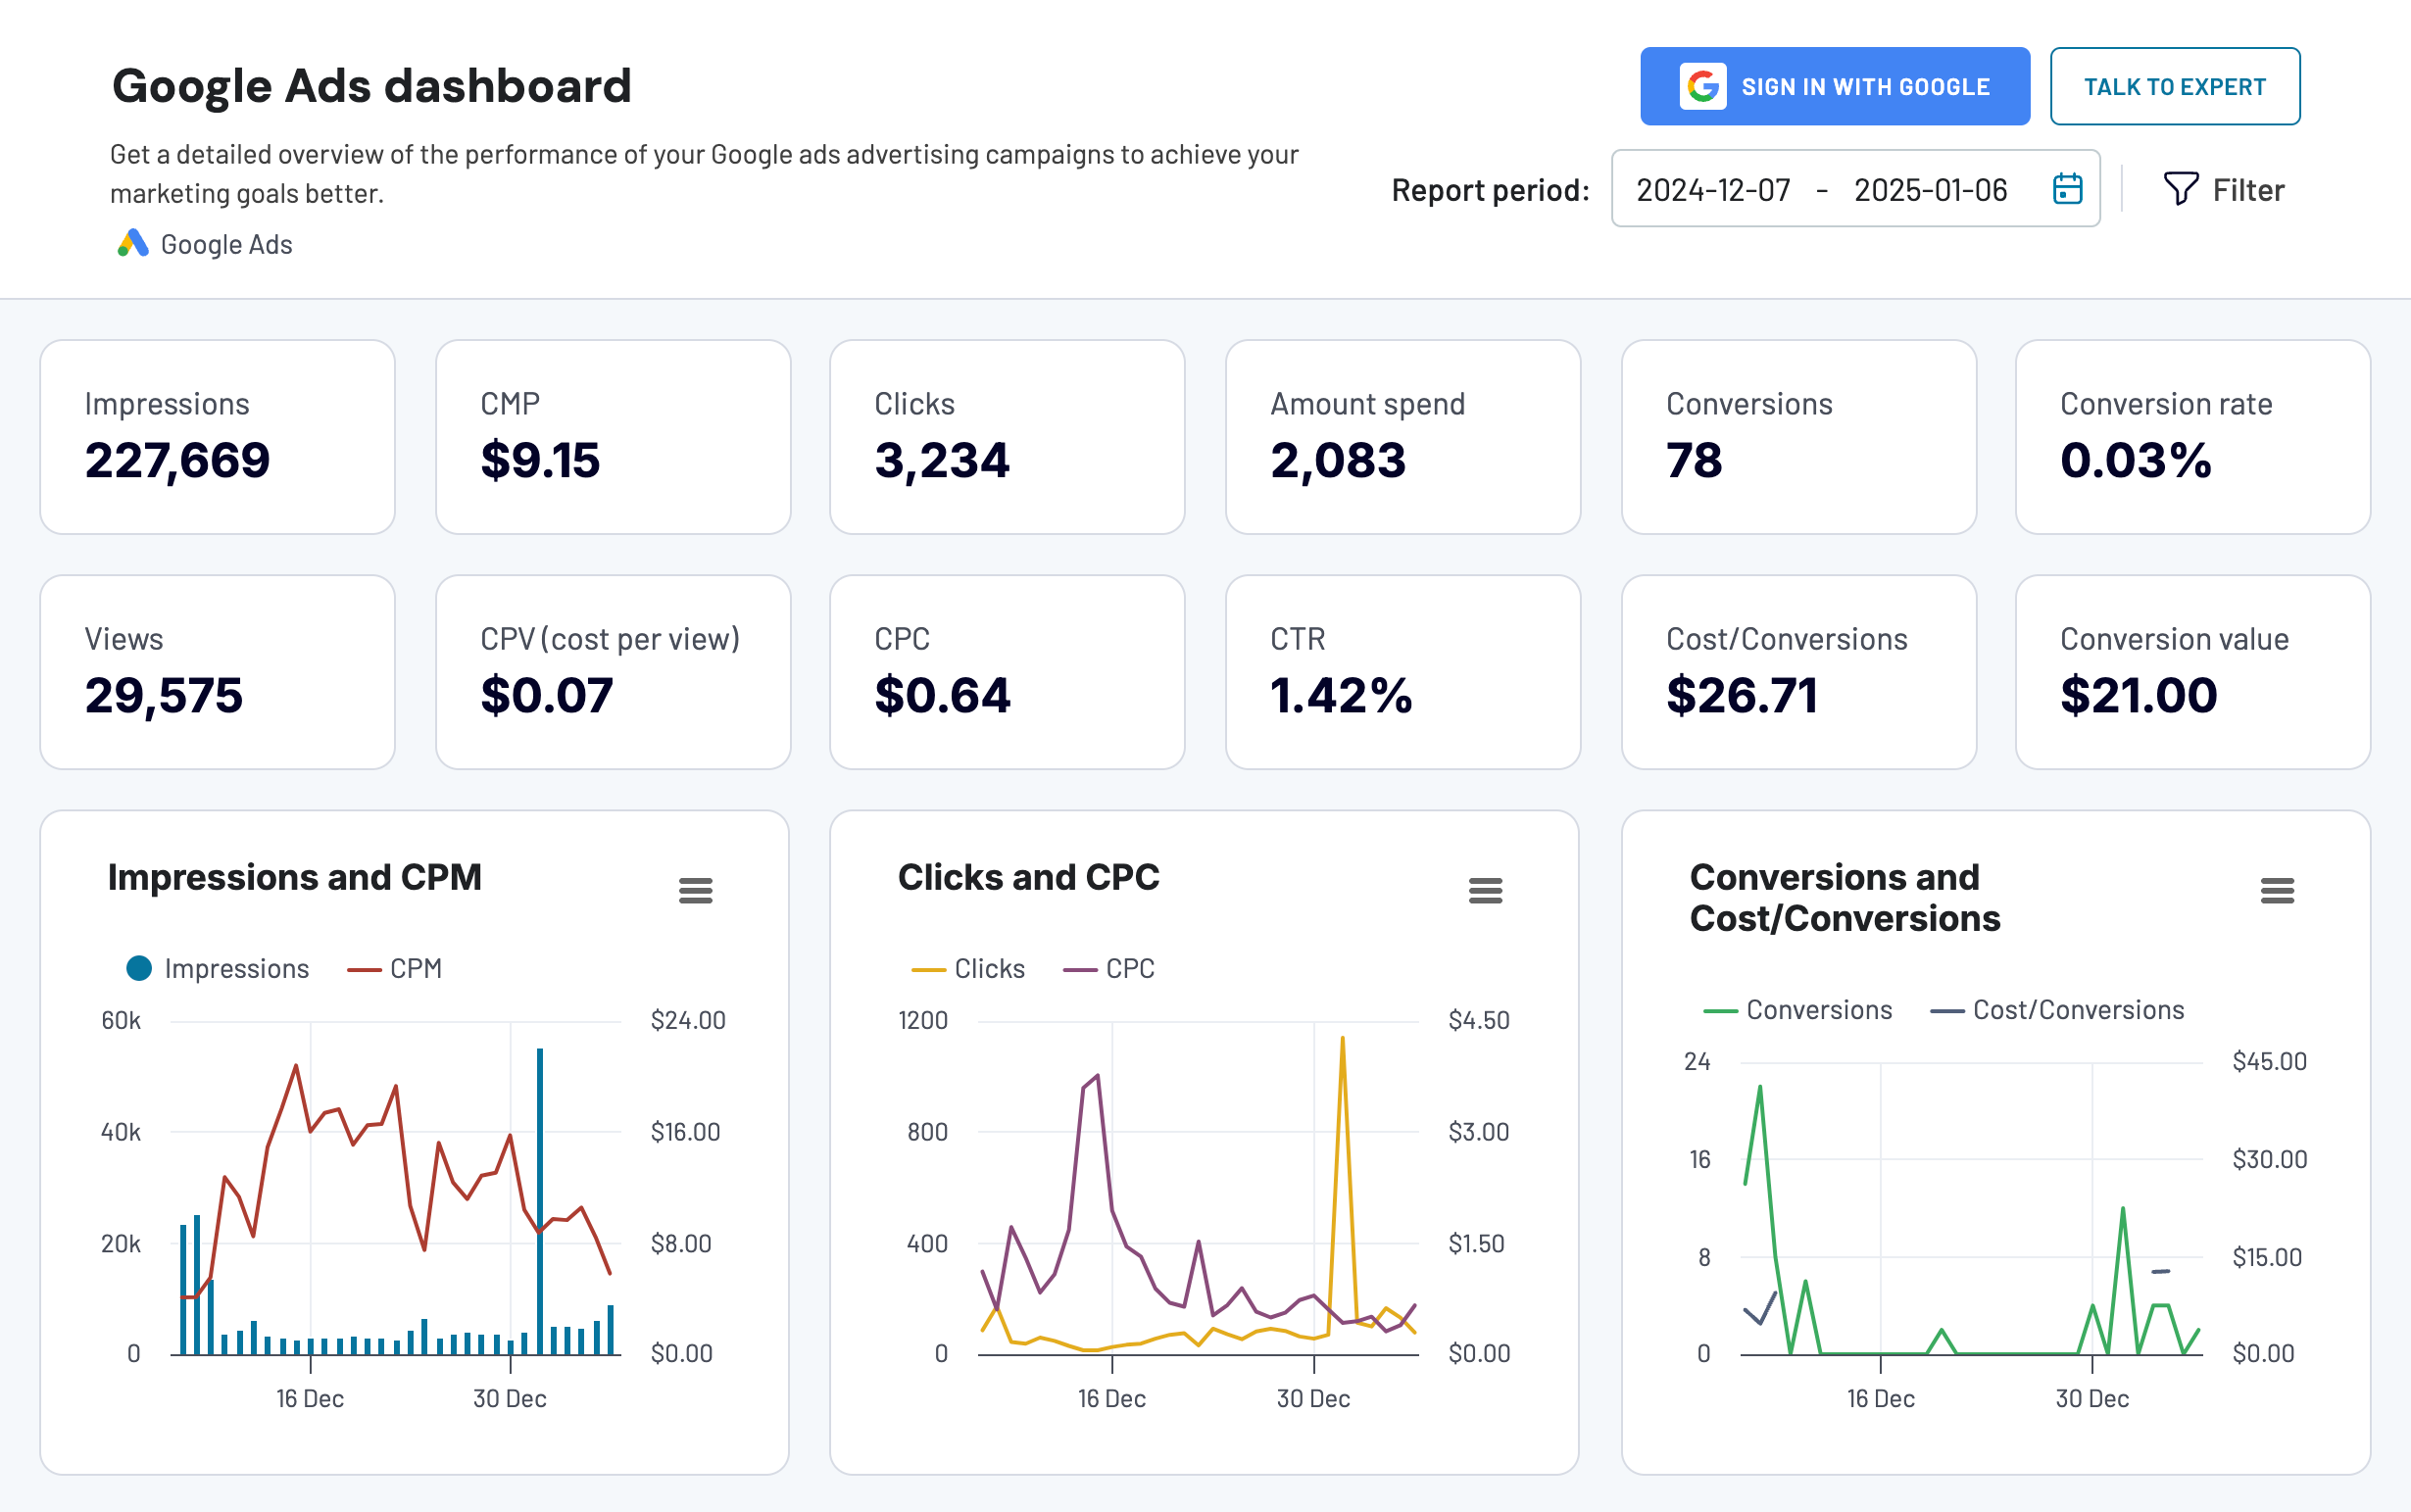
To start investigating whether you are spending your marketing budget wisely, take several steps to set everything up. Once you land on this PPC reporting dashboard, you can connect Google Ads easily thanks to the built-in connector.
What insights you can get
- Monitor campaign performance with comprehensive KPI overview
- Track metrics like impressions, clicks, CTR, and conversion rates
- Analyze conversion funnel performance to identify optimization opportunities
- Compare campaign performance across different time periods
- Visualize demographic and geographic data to refine targeting strategies
If you need to customize the ads dashboard according to your needs, check out the PPC report templates for Google Ads in external tools. Coupler.io offers templates in Google Sheets, Looker Studio, and Power BI.
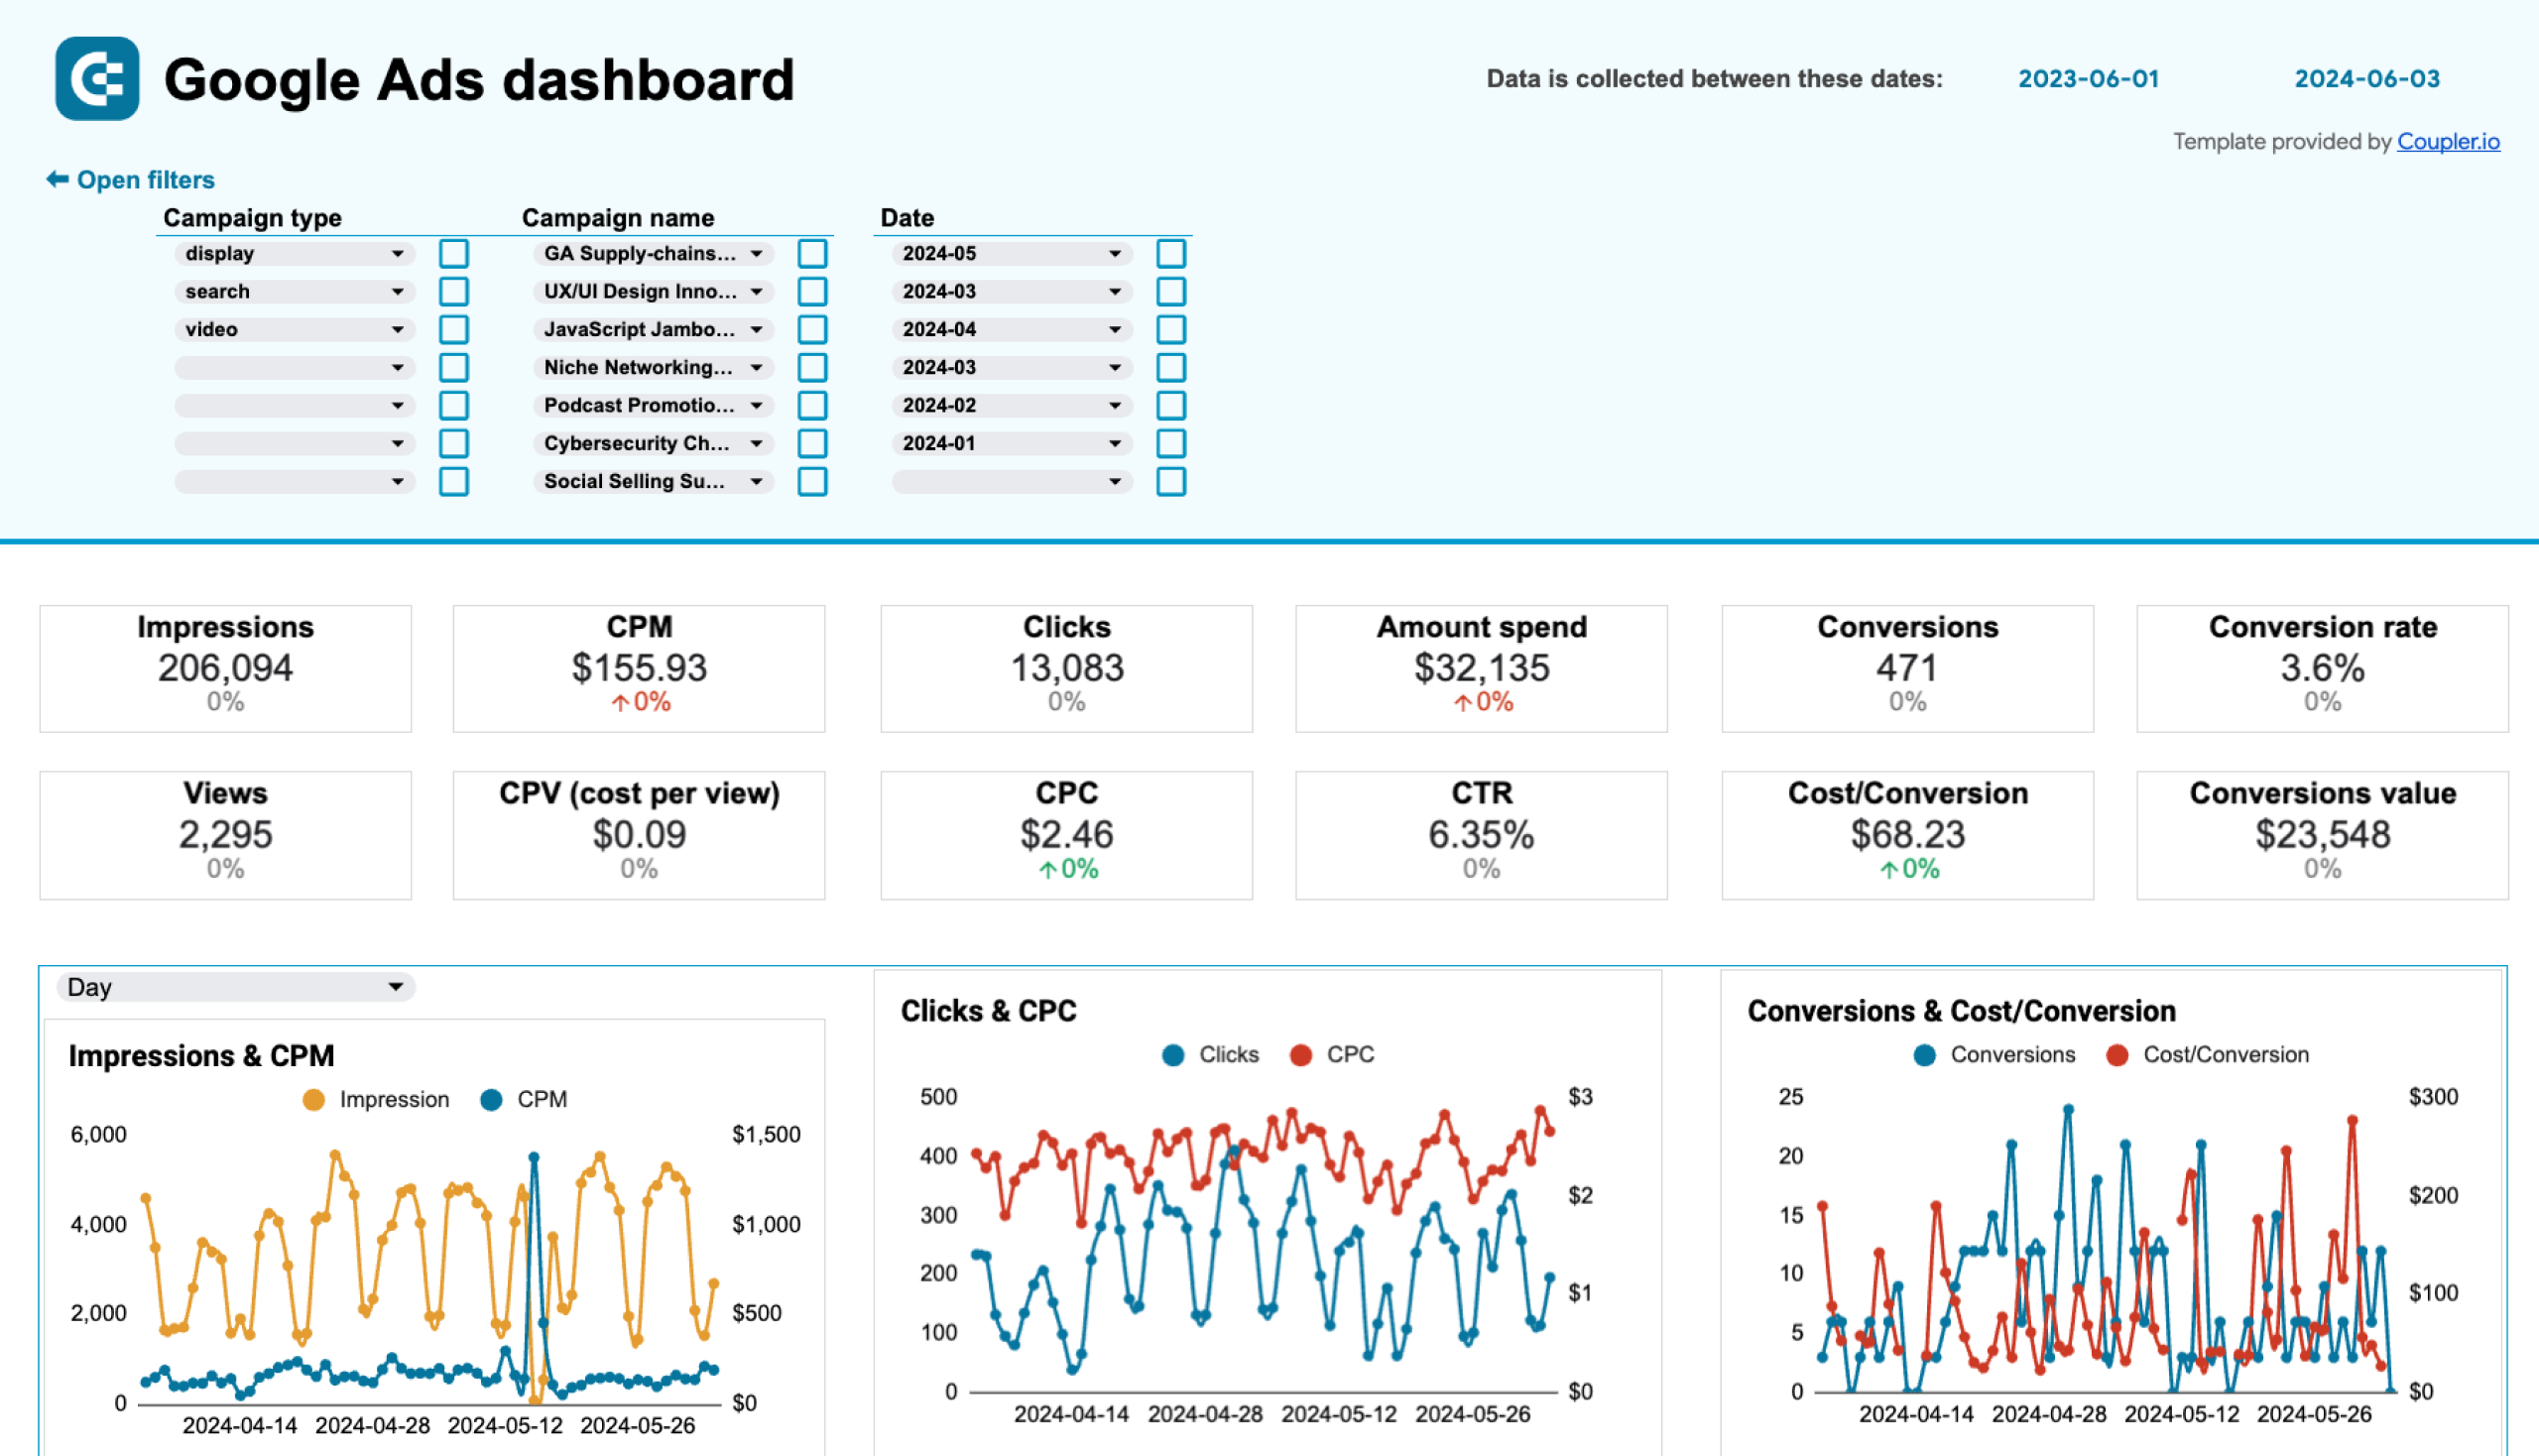
Google Ads dashboard in Google Sheets
Evaluate the performance of your PPC campaigns launched on Google and use these insights to optimize budgeting and conversion.
Google Ads dashboard in Looker Studio
Get a detailed overview of the performance of your Google ads advertising campaigns to achieve your marketing goals better.
Google Ads dashboard in Power BI
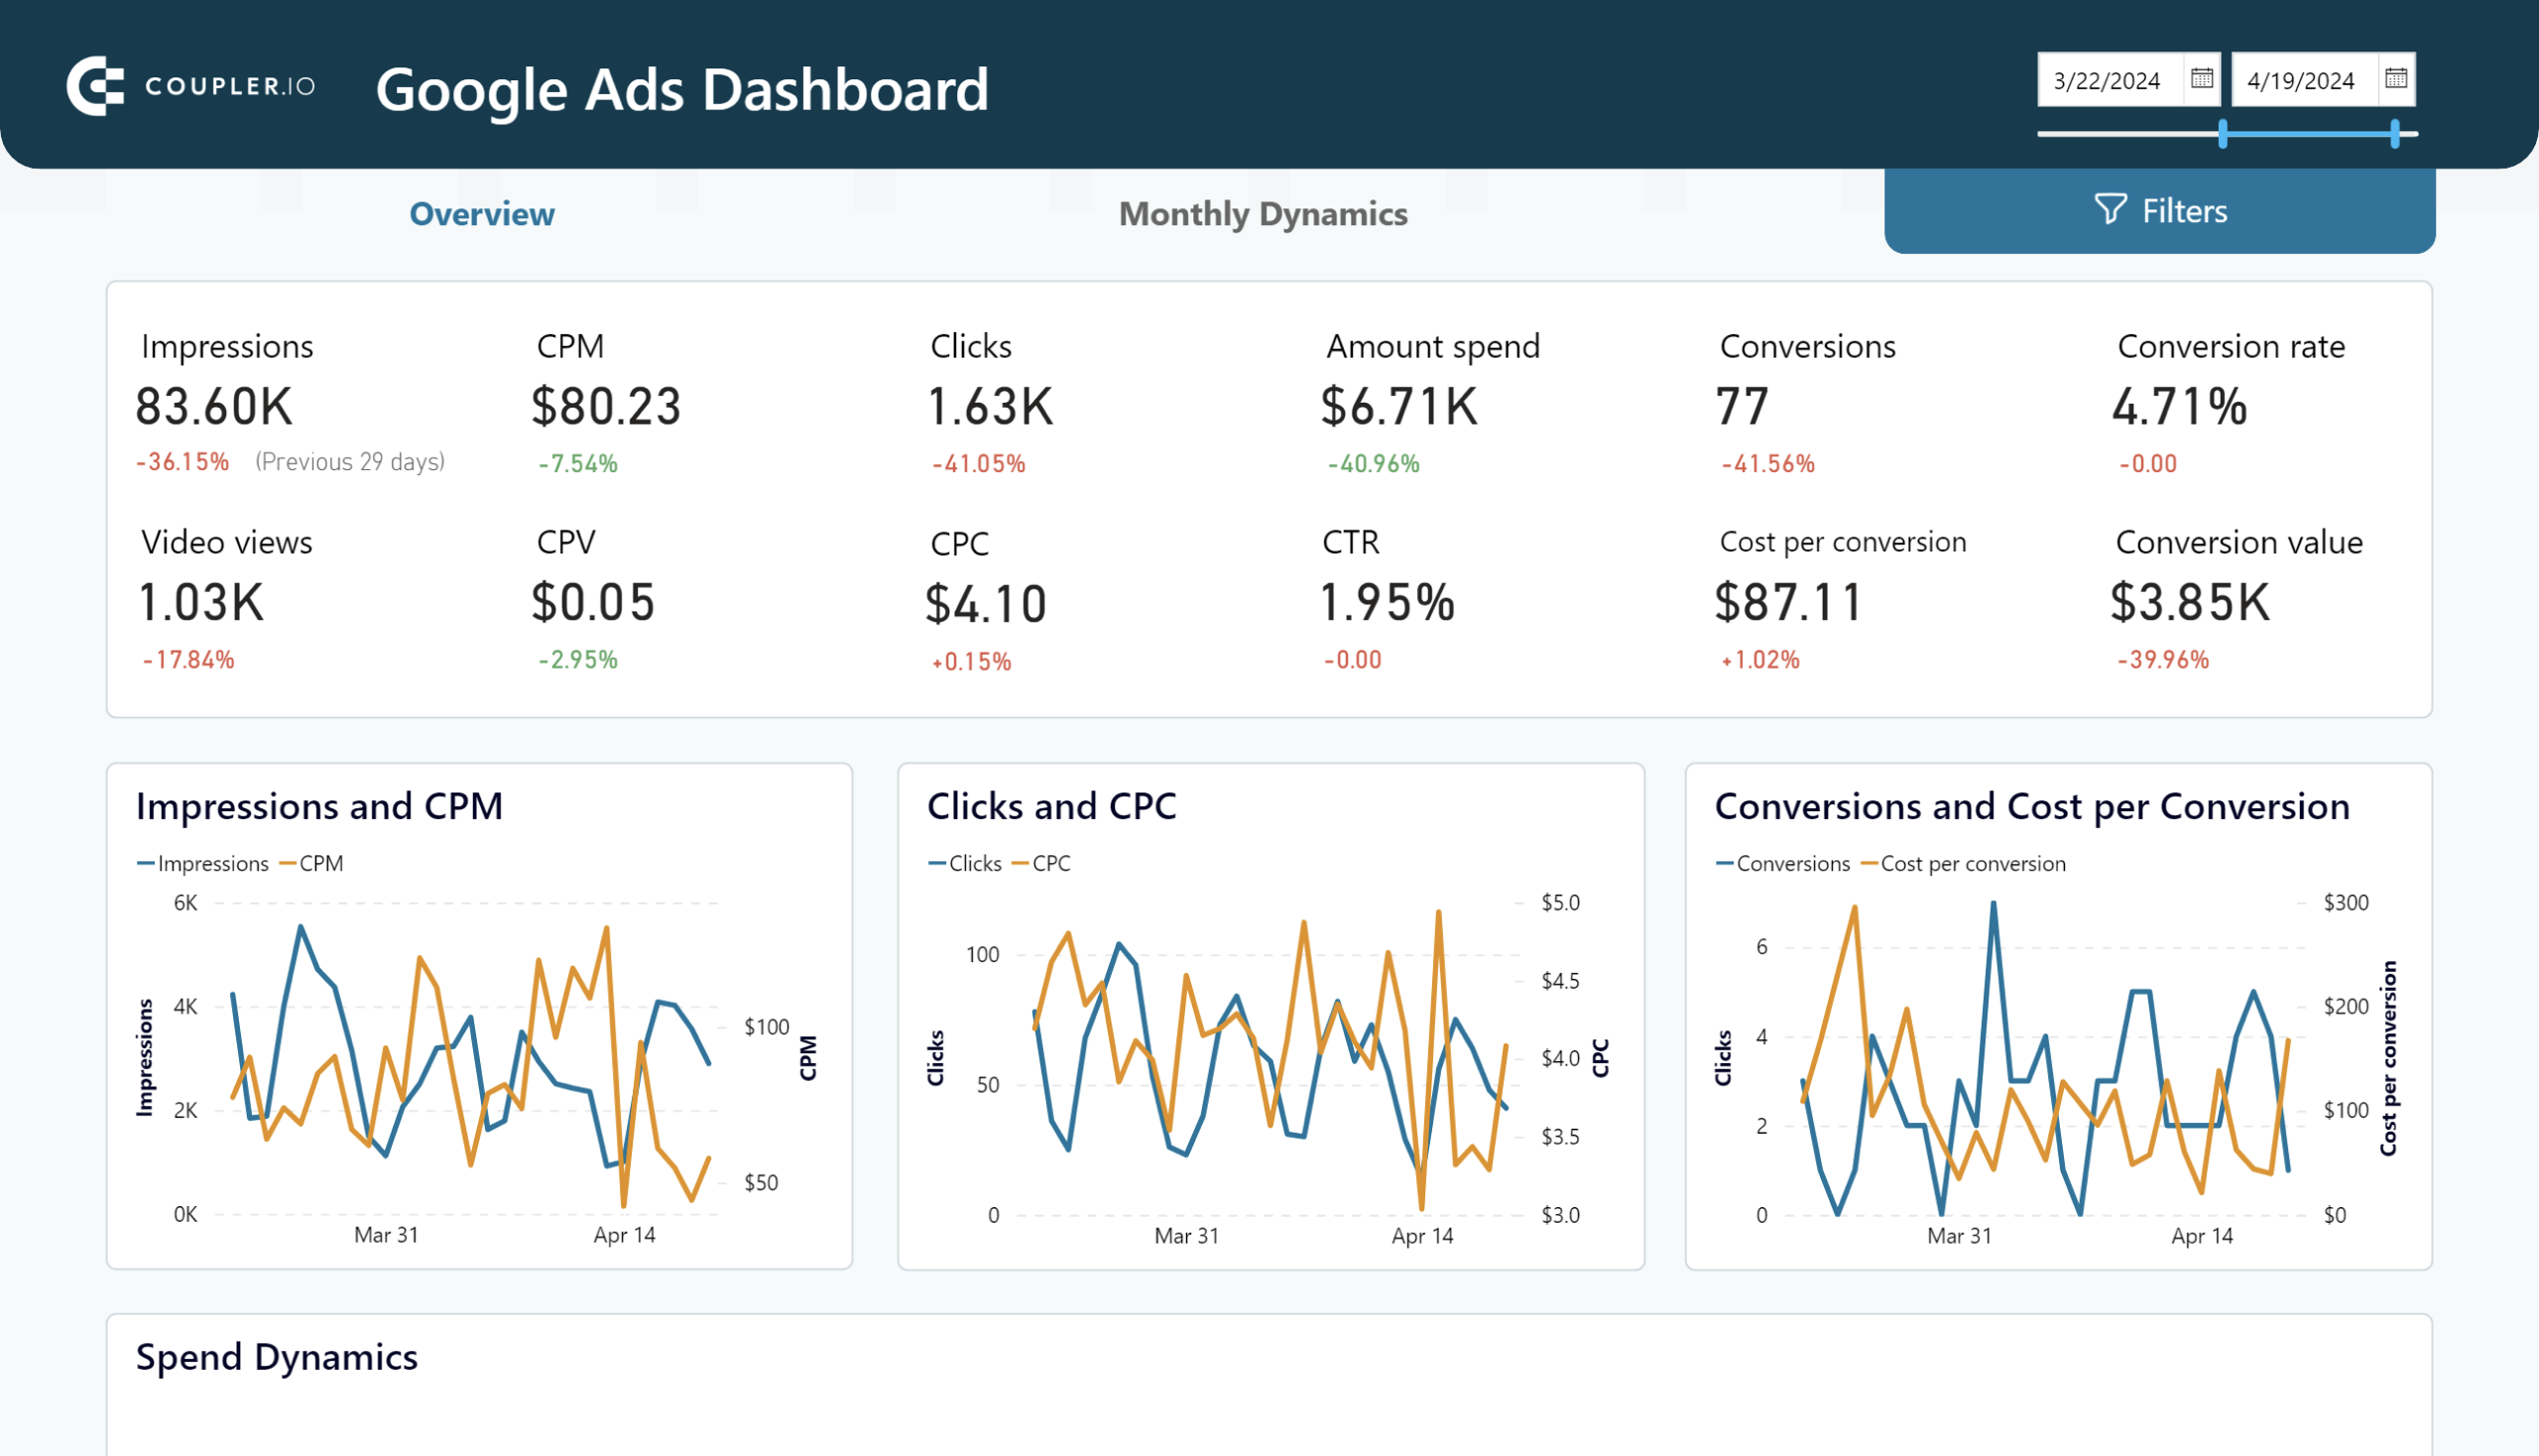
Overview the performance of your advertising campaigns in Google Ads and track monthly dynamics of key metrics.
#5 Quality score analytics template for Google Ads
This dashboard is designed to help PPC advertisers monitor and optimize their ad performance by analyzing quality scores. A quality score is a metric used by advertising platforms like Google Ads to measure the relevance and performance of your keywords, ads, and landing pages. Higher scores lead to better ad placements and lower costs per click.
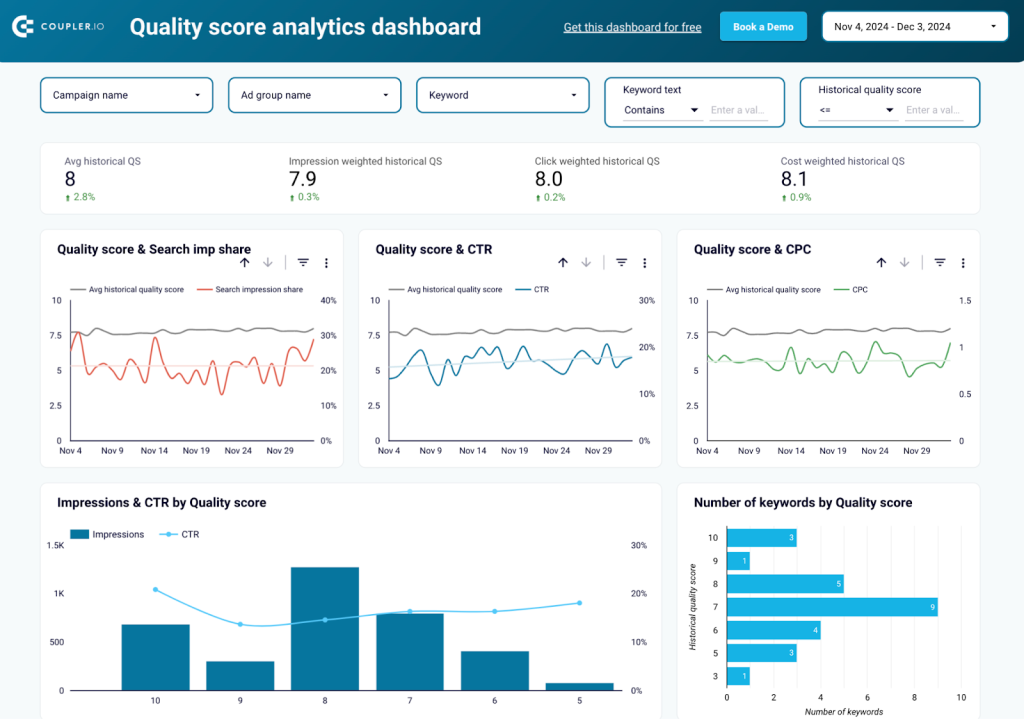
The Quality Score Analytics Dashboard provides a comprehensive view of your campaign performance by linking quality scores to key metrics like CTR, CPC, impressions, and search impression share. With visualizations such as Quality Score vs. CTR and Impressions & CTR by Quality Score, advertisers can pinpoint which areas need improvement for better ad visibility and cost efficiency.
The dashboard also includes tables and pie charts that break down historical landing page quality scores, creative scores, and predicted CTRs to provide granular insights on keyword and ad group performance.
What insights you can get
- Track quality score trends over time to measure optimization efforts
- Identify underperforming keywords that need immediate attention
- Analyze quality score components to pinpoint improvement areas
- Optimize high-spend keywords with poor quality scores for better ROI
- Measure impact of ad copy and landing page improvements on scores
This Looker Studio dashboard template is powered by Coupler.io. It can be easily customized to match your reporting needs. Follow the setup instructions in the Readme tab to integrate your Google Ads data instantly and analyze the impact of quality scores on your campaign performance.
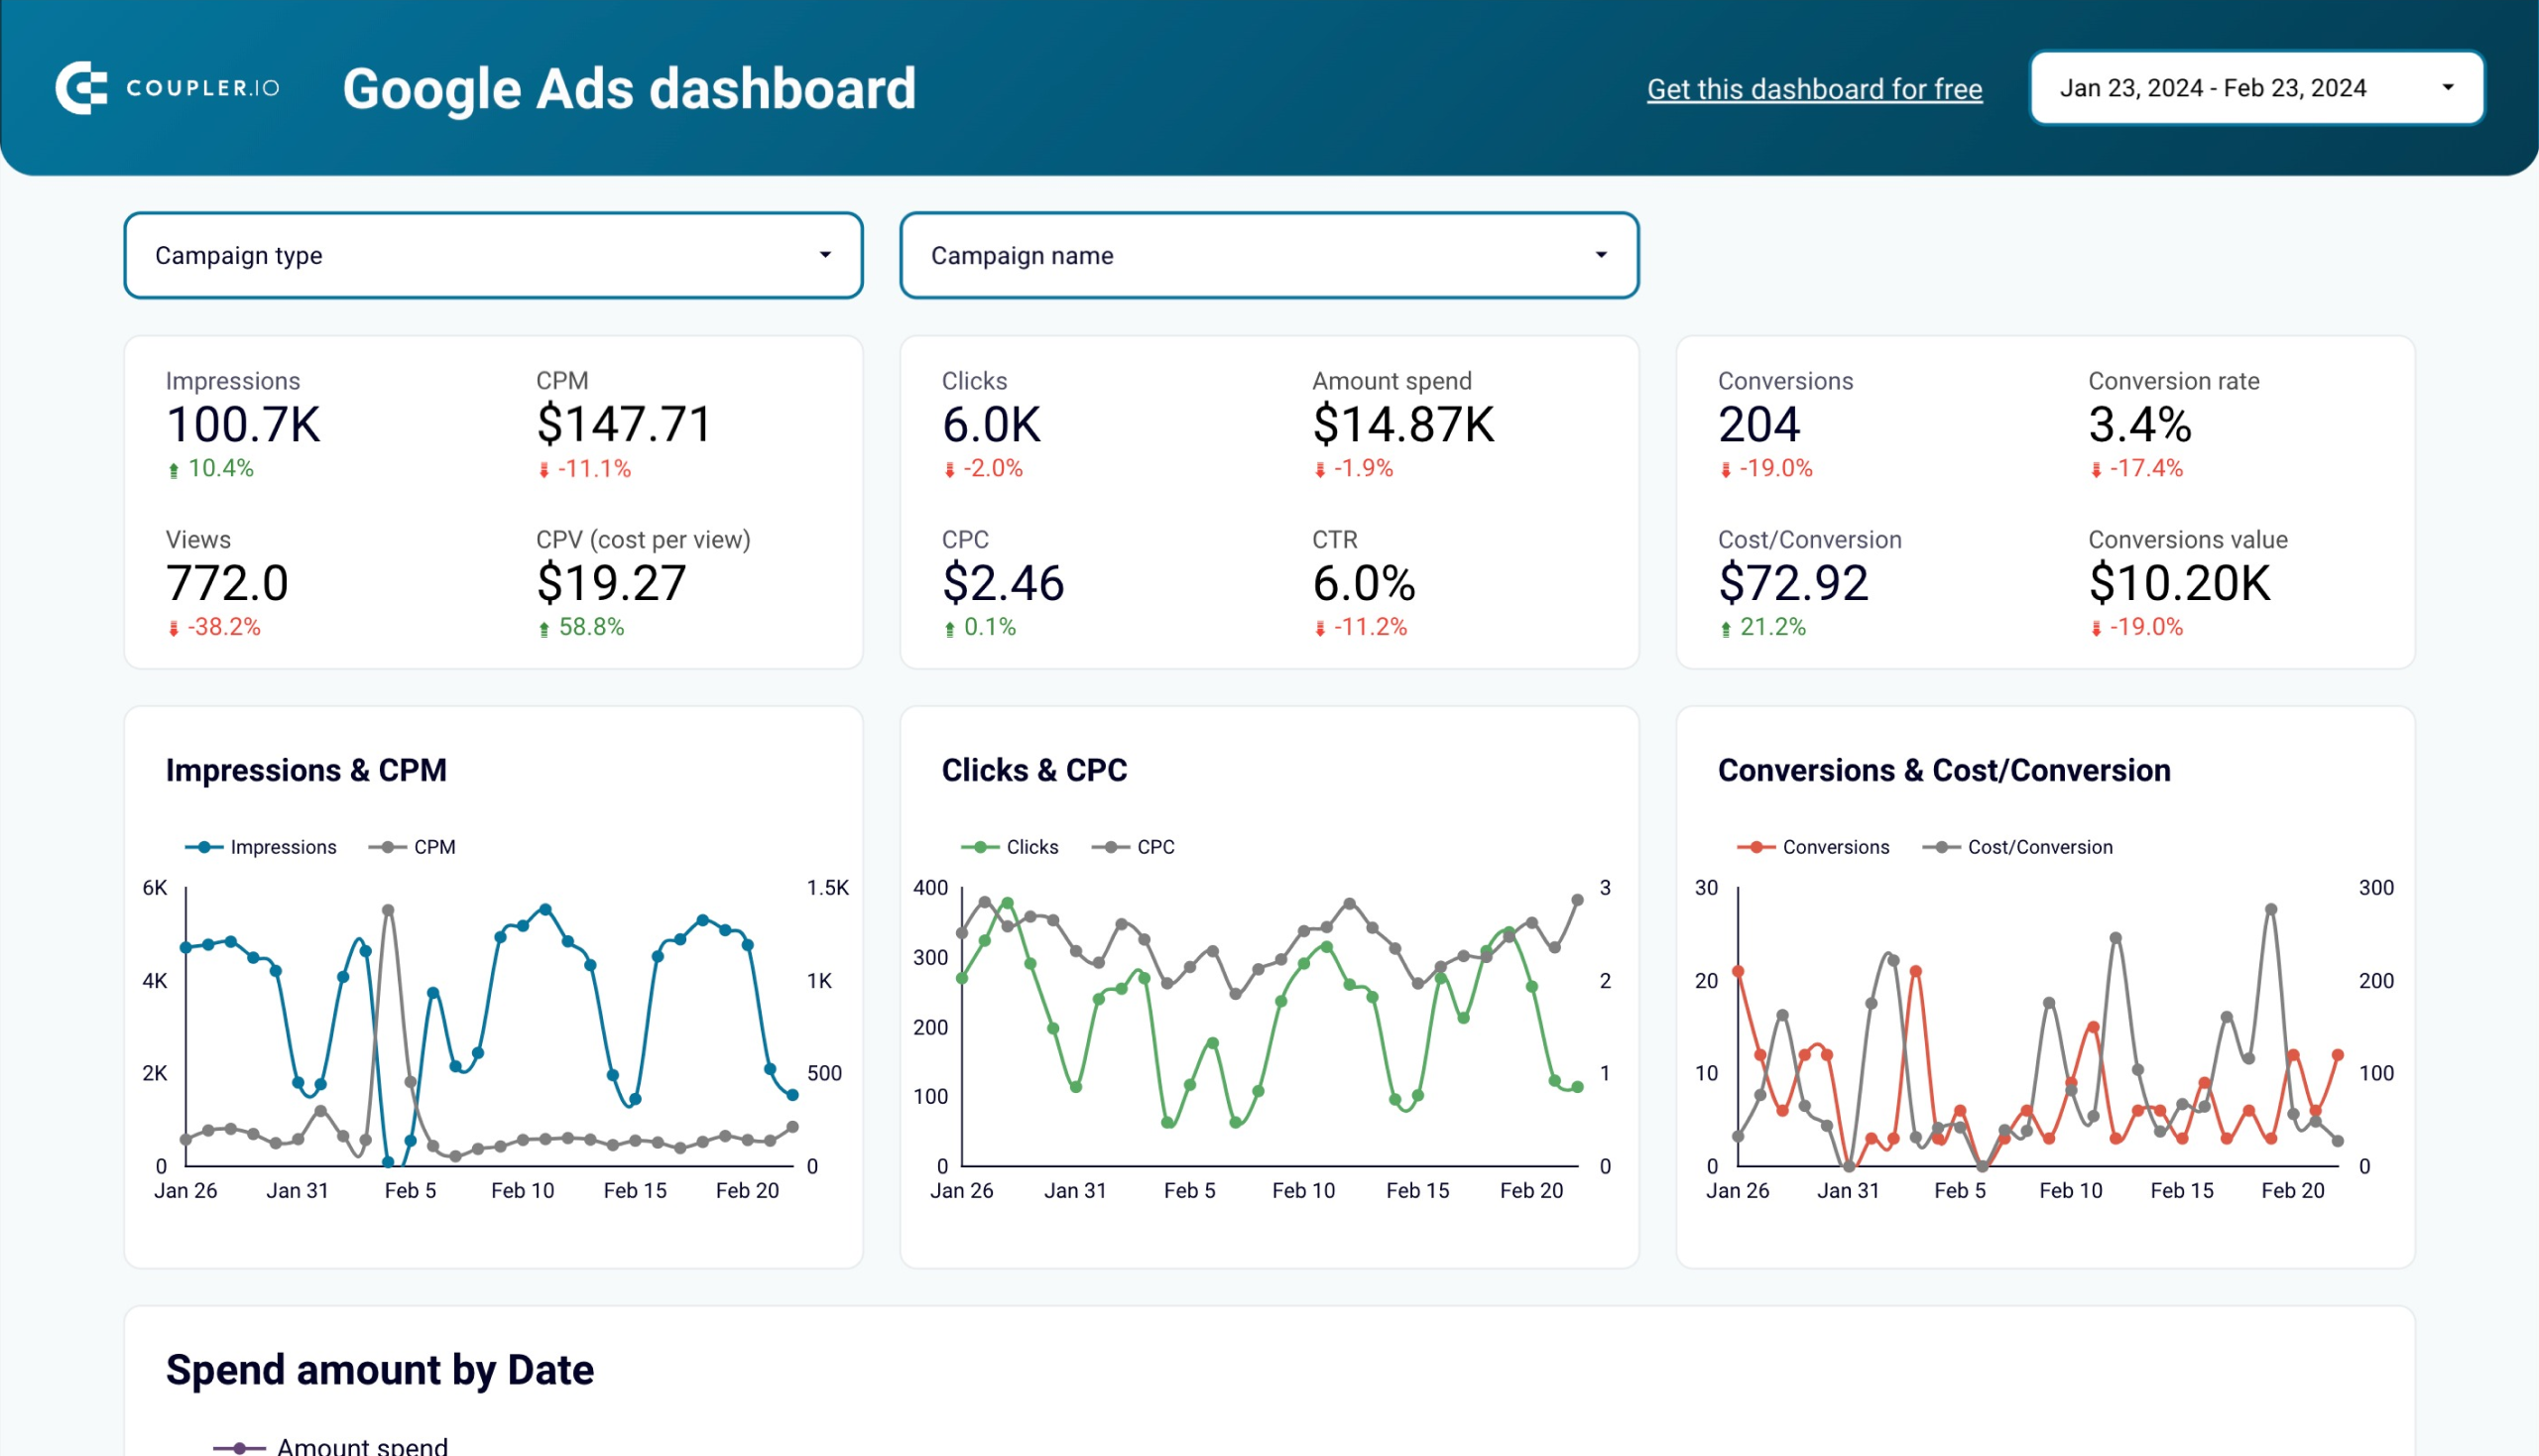
#6 Google Ads creatives template
This dashboard is perfect for understanding the impact of Google Ads creatives on overall ad performance. By analyzing key metrics such as impressions, clicks, CPC, and conversions against creatives, you can pinpoint top-performing ad creatives and identify areas for improvement to maximize campaign ROI.
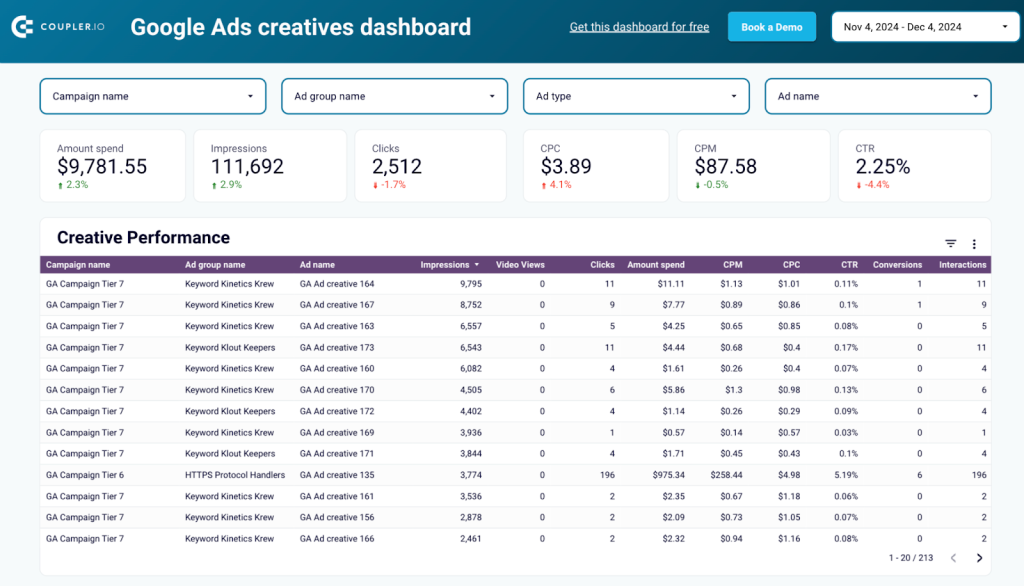
The Google Ads Creatives Dashboard provides detailed insights into creative performance across campaigns and ad groups. Visualizations such as Impressions vs. CPM, Clicks vs. CPC, and Spend Dynamics help to monitor trends and optimize their ad spend. The dashboard also highlights top creatives by conversions, making it easy to focus on what works best.
What insights you can get
- Evaluate creative performance with engagement and conversion metrics
- Track impression and click trends over time for creative iterations
- Monitor cost efficiency metrics to identify the most effective creatives
- Compare creative performance across campaigns and ad groups
- Identify top-performing ad formats and messaging approaches
This report template by Coupler.io is available in Looker Studio and can be customized in minutes. Simply integrate your Google Ads data using the provided setup instructions and start analyzing your ad creatives’ performance to refine your strategy and drive better results.
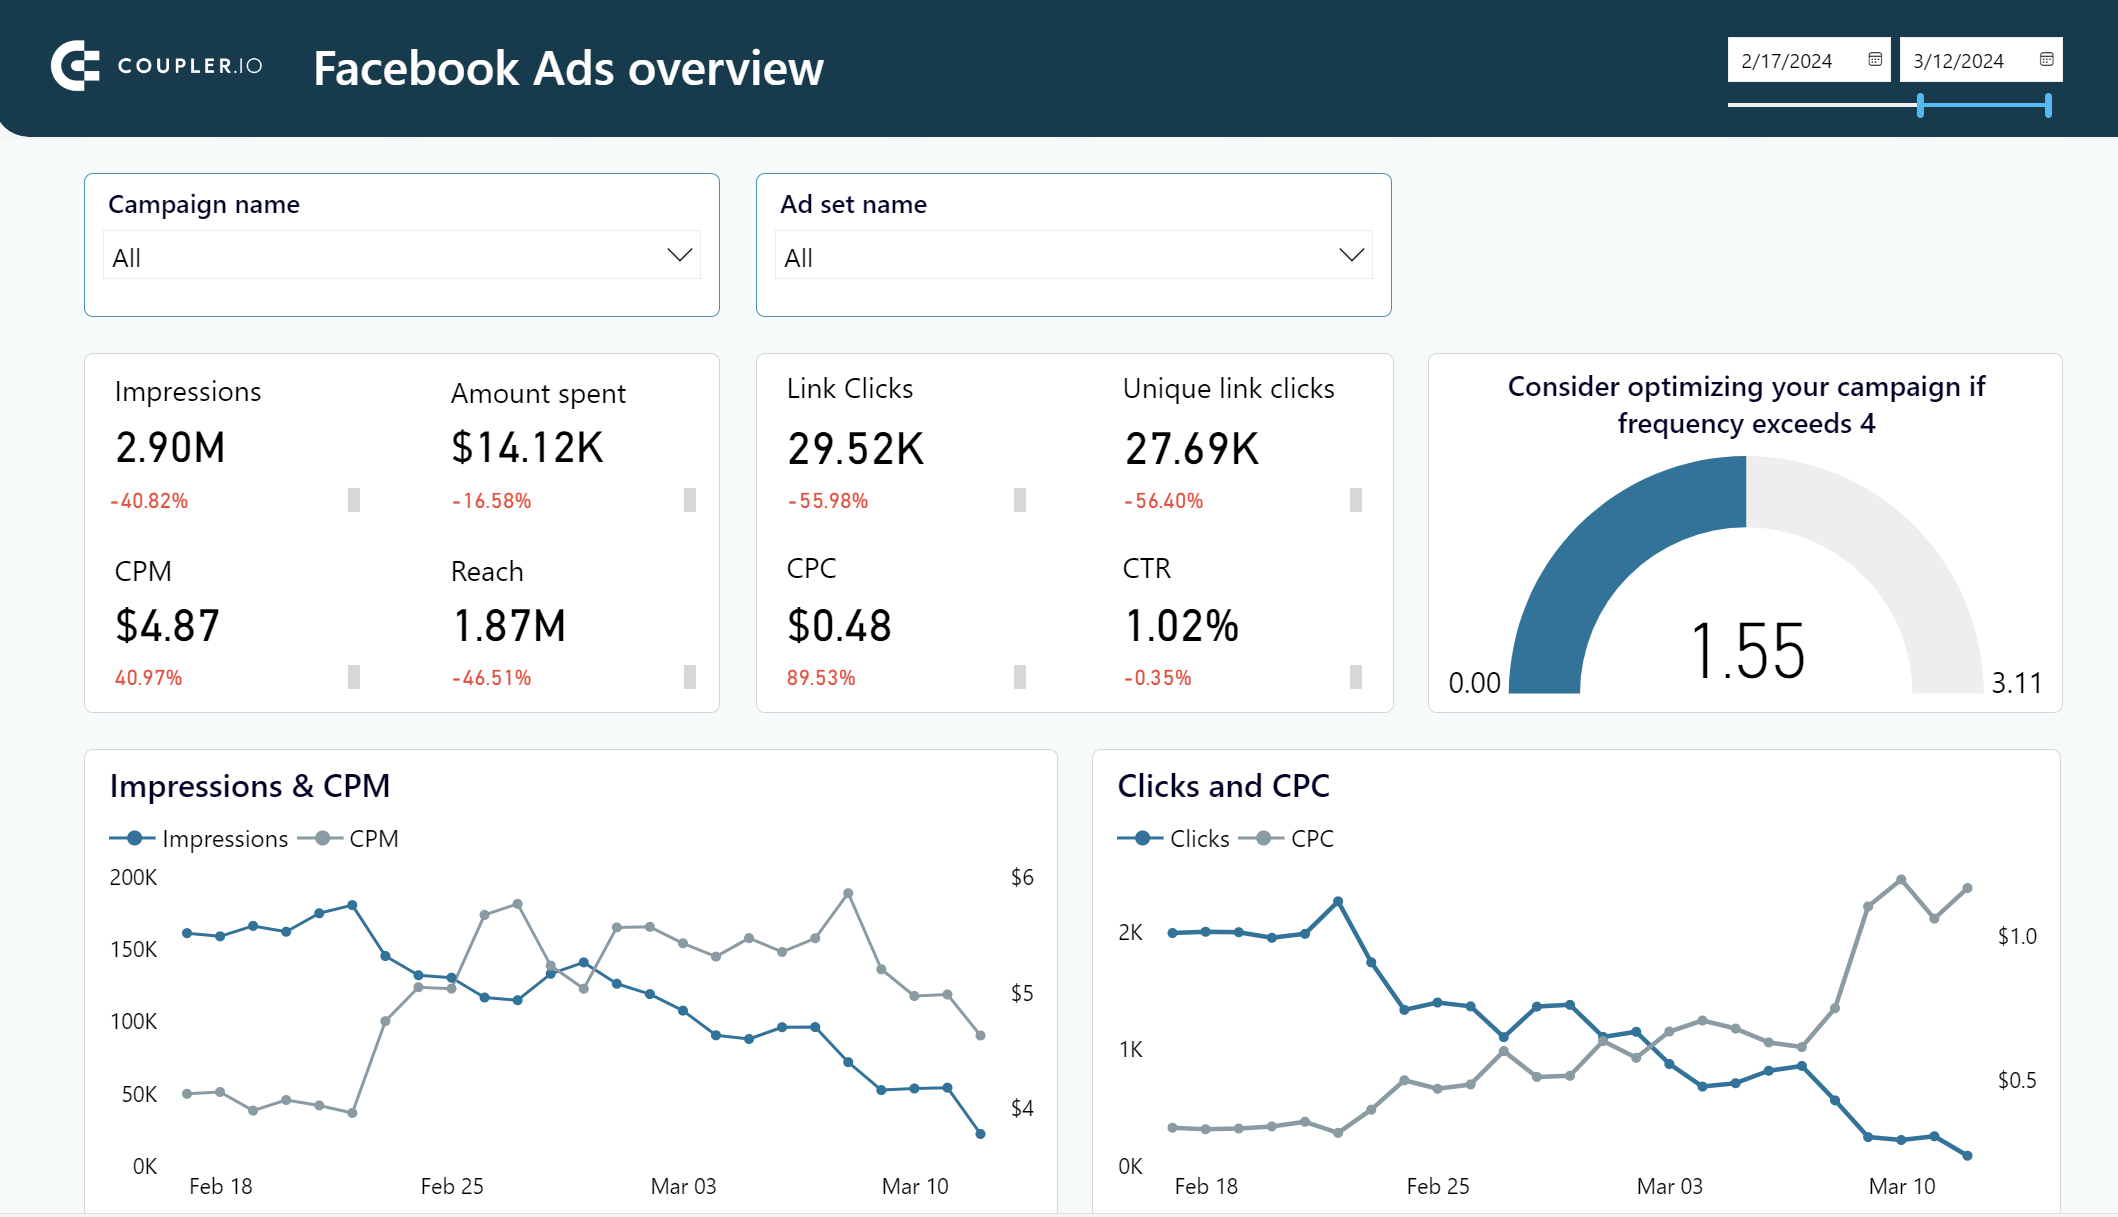
#7 Facebook Ads report template
Executing ad campaigns on Facebook is always a great idea, but evaluating them is even more important, and the Facebook Ads PPC reporting template by Coupler.io is a great tool for that. Like other Coupler.io dashboards, this one also has instructions for setting everything up, connecting Facebook Ads, and configuring regular updates in a few clicks.
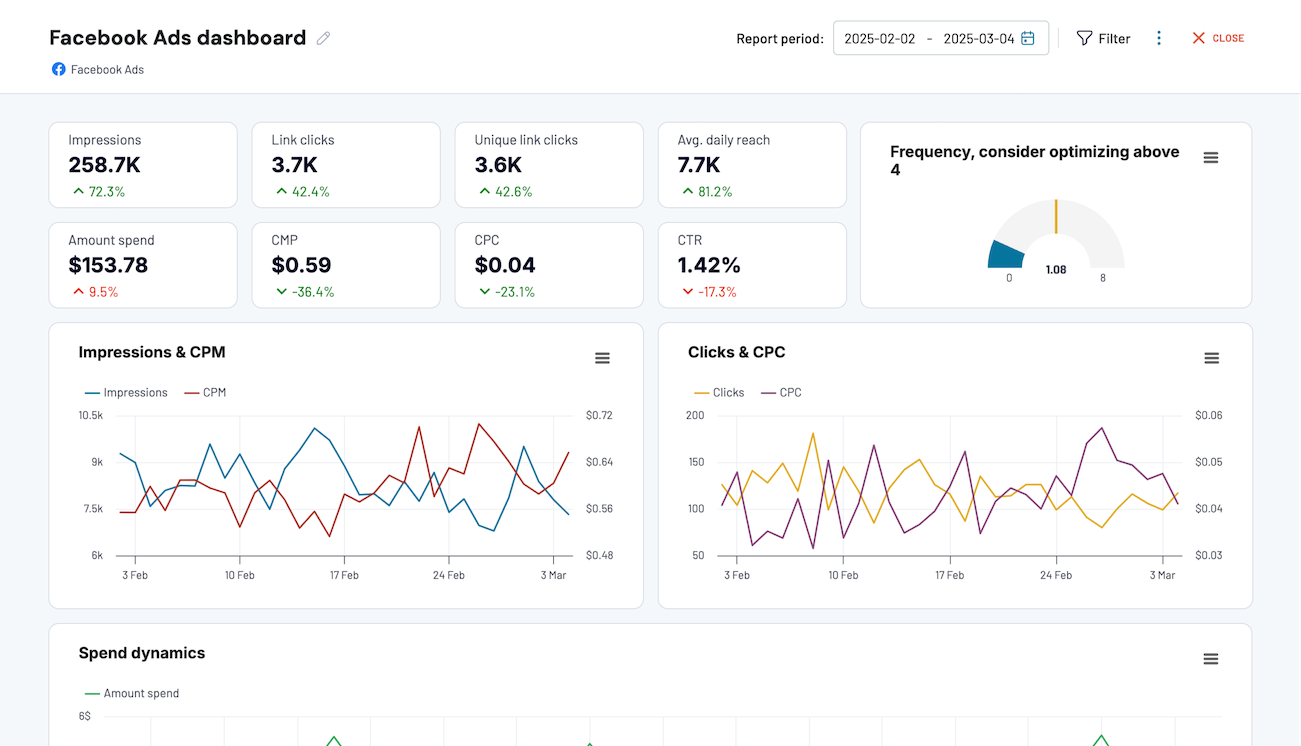
The power of the Facebook Ads dashboard is that it not only includes the key PPC metrics (CTR, CPC, link clicks, etc.), but it also allows marketers to observe the results over time and by country. It’s an incredible opportunity to explore your target audience demographics.
What insights you can get
- Monitor ads frequency to prevent audience fatigue
- Analyze demographic engagement to refine targeting strategies
- Track monthly performance trends for seasonal planning
- Identify geographical performance patterns for regional targeting
- Compare campaign metrics to optimize budget allocation
If you’re interested in having this Facebook Ads template in external BI tools, check out its versions in Looker Studio, Power BI, and Google Sheets.
Facebook Ads dashboard template in Looker Studio
Effectively manage and optimize your Facebook advertising campaigns, reaching your target audience in a data-driven way.
Facebook Ads dashboard template in Power BI
Get a detailed overview of your advertising campaigns’ performance using a dynamic Power BI dashboard template equipped with a no-code Facebook Ads connector
Facebook Ads dashboard template in Google Sheets
Monitor the performance of your advertising campaigns in Facebook and identify top assets to spend your budget wisely.
#8 Meta Ads creatives template
Just like the Google Ads creatives template, this dashboard is useful for analyzing campaign creatives on meta platforms (Facebook and Instagram). It allows marketers to understand which ads drive the most impressions, clicks, and post engagements. By analyzing metrics like CPC, CTR, and CPM, you can optimize their strategies for better results.
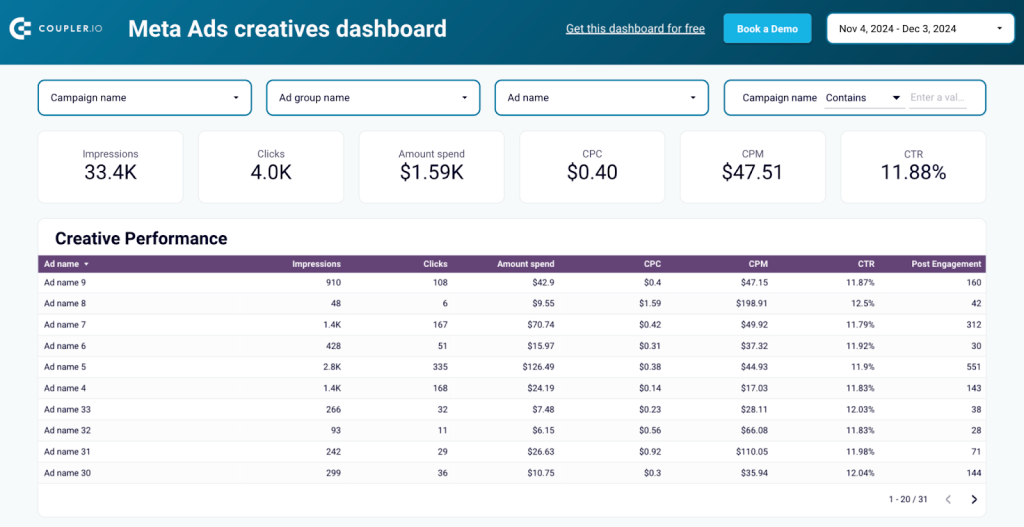
This template allows you to identify top-performing ads and adjust your strategy accordingly to engage your target audience.
The Meta Ads Creatives Dashboard clearly breaks down creative performance by campaign and ad name. With dynamic visualizations, like Impressions vs. CPM and Clicks vs. CPC, you can analyze audience interactions with your ads and understand the cost-efficiency of each creative. The Spend Dynamics chart tracks daily budget utilization, offering deeper insights into how your ad spend aligns with results.
What insights you can get
- Compare creative performance across campaigns and ad groups
- Track impression, click and engagement metrics by creative
- Analyze cost efficiency metrics (CPC, CPM) by creative variation
- Monitor spending patterns to identify high-performing creatives
- Identify top-performing ad formats and creative approaches
Powered by Coupler.io, this Looker Studio template can be quickly customized to suit your needs. Simply integrate your Meta Ads data by following the instructions in the Readme tab, and the dashboard will generate actionable insights. You can also set up automatic data updates as frequently as every 15 minutes to ensure you always have the latest data for analysis.
#9 Google Ads vs Meta Ads template
This dashboard compares the performance of their campaigns across Google Ads and Meta platforms (Facebook and Instagram). Visualizing key metrics side by side allows you to identify which platform delivers better ROI, higher engagement, or lower costs, helping optimize their advertising strategies effectively.
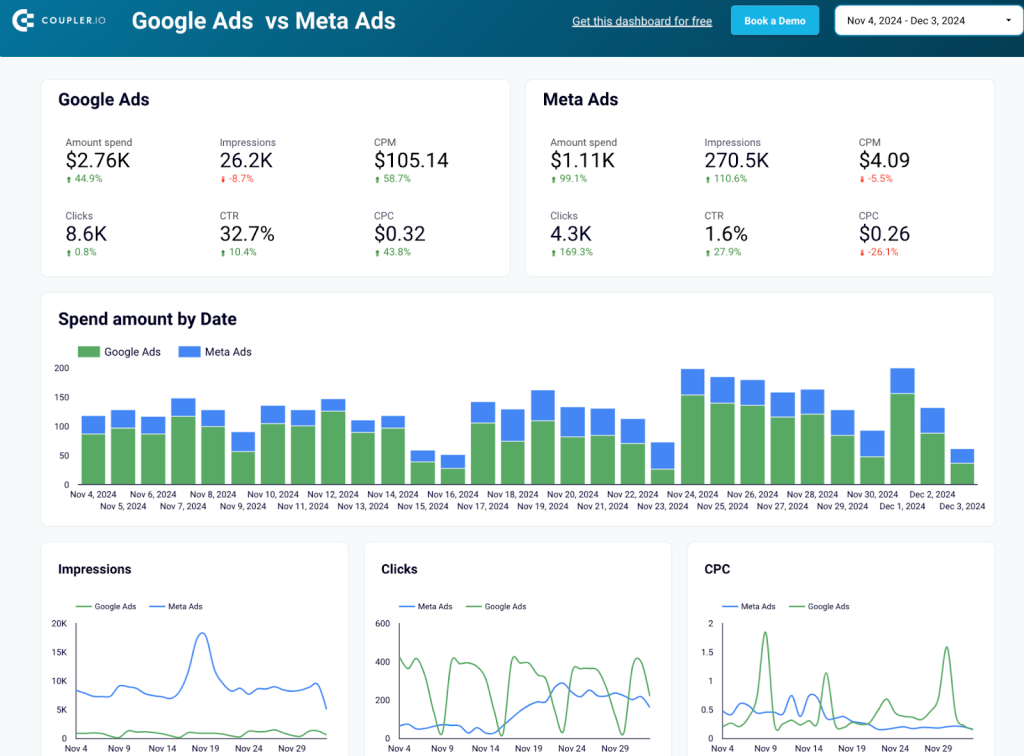
The Google Ads vs Meta Ads Dashboard goes beyond basic reporting with a head-to-head comparison of critical metrics like impressions, clicks, CTR, and CPC. It shows spending patterns, engagement trends, and cost efficiency through visualizations. The campaign-specific tables further break down performance for each platform, highlighting which campaigns are delivering the most value.
This Looker Studio template is ideal for marketers running campaigns on both Google and Meta Ads, providing insights into which platform better suits their goals.
What insights you can get
- Compare performance metrics side-by-side between platforms
- Identify which platform delivers better ROI for specific campaign goals
- Track spending patterns and engagement metrics by platform over time
- Analyze cost efficiency metrics (CPC, CPM) to optimize ad spend
- Compare individual campaign performance across both platforms
Setting up this dashboard with your data is easy. Just follow the setup instructions in the Readme tab to connect your data sources. With automated updates available every 15 minutes, you’ll have the most up-to-date insights at your fingertips for real-time analysis.
#10 LinkedIn Ads report template
LinkedIn claims to be the most powerful resource for bringing quality leads to companies through advertising on the platform. If you rely on LinkedIn Ads, the PPC reporting template by Coupler.io comes in handy to help you decide whether it’s really so.
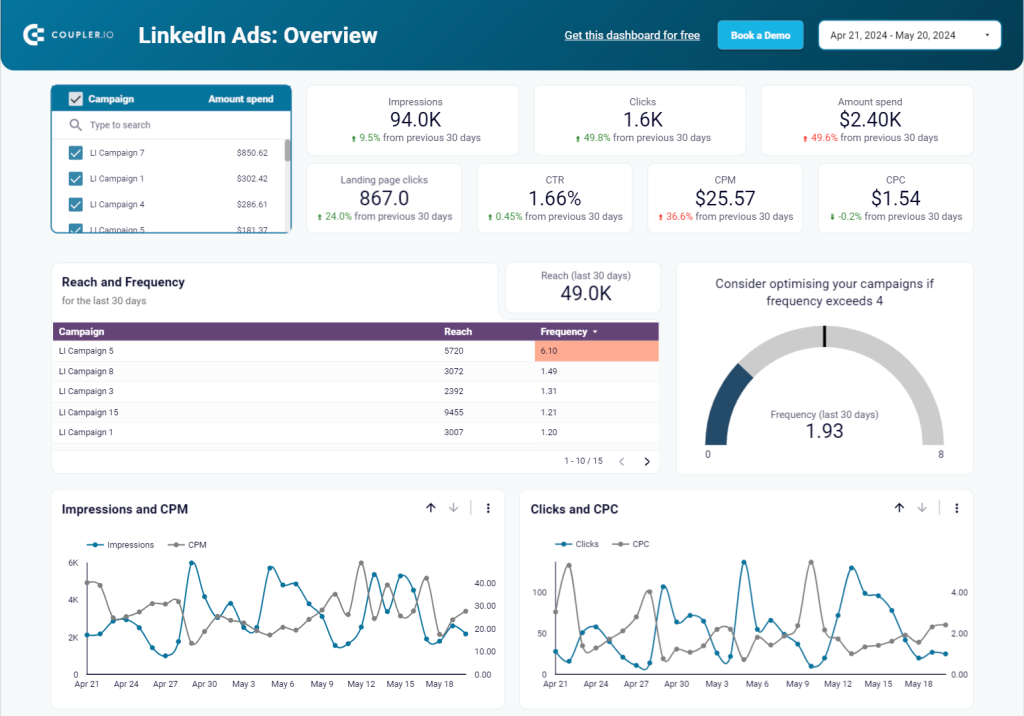
LinkedIn Ads report will help you keep an eye on the PPC campaign KPIs, explore your sales funnel, and understand which campaigns bring the most leads. This template is also easy to customize and connect to LinkedIn Ads, similar to other Coupler.io report templates.
What insights you can get
- Track campaign performance with comprehensive funnel metrics
- Monitor lead form engagement and conversion rates
- Analyze frequency patterns to prevent audience saturation
- Compare campaign performance to optimize budget allocation
- Measure conversion metrics to evaluate campaign effectiveness
#11 LinkedIn Ads creatives template
This dashboard template allows you to dive deep into the performance of your LinkedIn Ads creatives, helping you optimize for professional audiences. With insights into key metrics like impressions, clicks, and engagements, you can maximize LinkedIn’s B2B targeting capabilities.
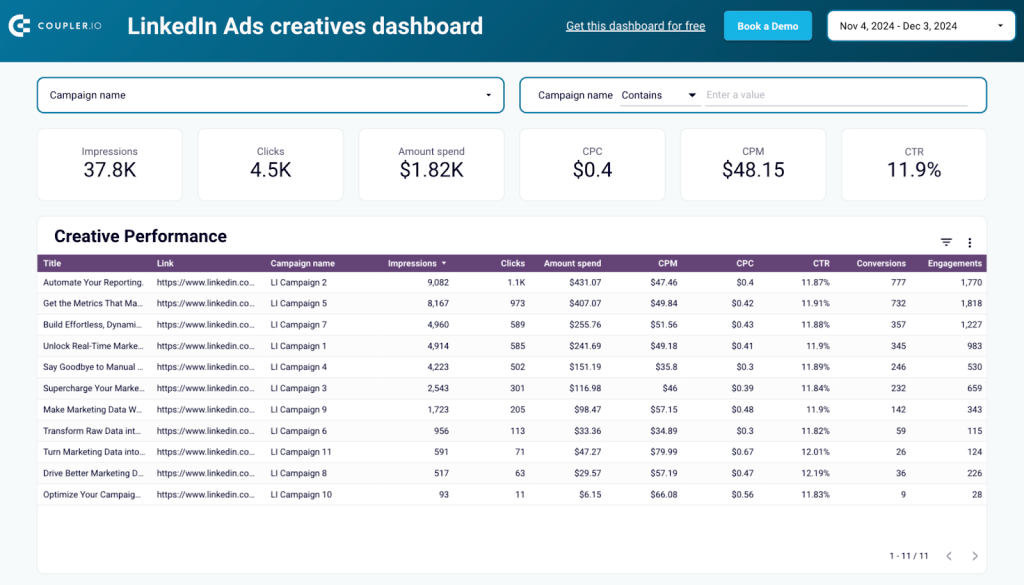
The LinkedIn Ads Creatives Dashboard provides a unique perspective on how your ads perform for the professional audience. It highlights creative-level performance through metrics like conversions and engagements, allowing you to see which ads resonate most with LinkedIn’s targeted audience. Charts like Spend Dynamics and Clicks vs. CPC offer actionable insights into your campaigns’ efficiency and reach.
This template focuses on LinkedIn-specific engagements like lead generation, thought leadership, or professional brand visibility.
What insights you can get
- Evaluate creative performance across LinkedIn B2B campaigns
- Track impression, click, and engagement metrics by creative variation
- Analyze cost efficiency metrics (CPC, CPM) by creative
- Identify which ads resonate best with professional audiences
- Measure creative impact on lead generation and conversions
This template from Coupler.io is easy to set up and use. Follow the instructions in the Readme tab to populate your data in the Looker Studio dashboard and start analyzing instantly. You can also automate data updates every 15 minutes to have real-time insights and improve your LinkedIn advertising strategy.
#12 Apple Search Ads report template
If you are an app developer for iOS and macOS platforms, you might be interested in promoting them on the App Store. Luckily, App Search Ads can help you with that. To assess the success of your advertising efforts, use this Apple Search Ads report template by Coupler.io.
What insights you can get
- Track key performance metrics with period-over-period comparisons
- Monitor daily and weekly campaign performance trends
- Analyze monthly campaign dynamics for long-term strategy planning
- Identify top-performing campaigns by conversions and metrics
- Break down conversions by device type to optimize targeting
This template is designed in Looker Studio and is easily integrated with Apple Search Ads via the built-in Coupler.io connector. Find the instructions on how to set everything up on the Readme page of the report template.
#13 Snapchat Ads report template
If you need to analyze the performance of your advertising campaigns on Snapchat, check out this reporting solution. It’s a predesigned dashboard template in Looker Studio equipped with the Snapchat Ads connector by Coupler.io.
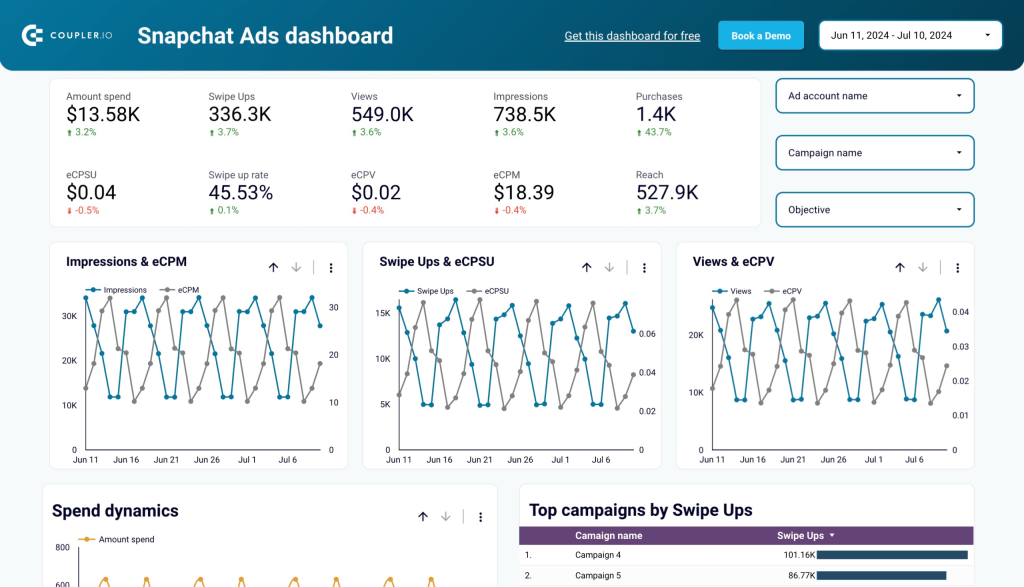
The report provides access to key metrics such as amount spend, swipe ups, eCPSU, eCPV, and others. It also has a separate page where you can monitor the monthly dynamics of your campaign performance. All you need to do is connect your Snapchat Ads account to load your data to the dashboard.
What insights you can get
- Track key metrics like impressions, swipe-ups, and conversions
- Analyze campaign performance with customizable date ranges
- Identify top-performing campaigns by swipe-ups and engagement
- Monitor geographic performance with country-level breakdowns
- Compare campaigns with comprehensive performance metrics
#14 Quora Ads report template
This dashboard helps you monitor and analyze your question-and-answer platform advertising performance on Quora. The dashboard is particularly valuable for B2B marketers targeting professional and knowledge-seeking audiences on Quora.
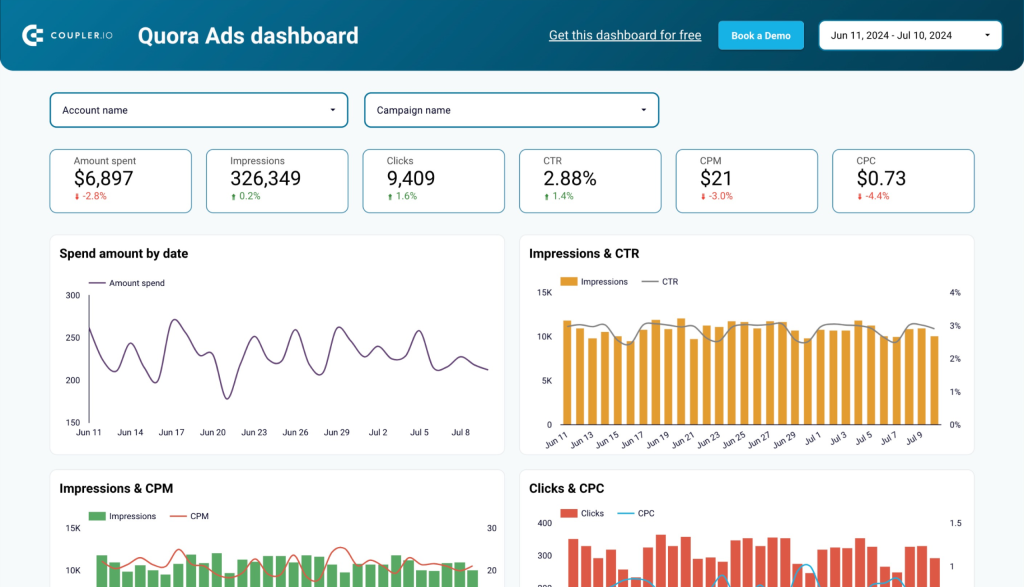
What insights you can get
- Track performance across multiple Quora ad accounts with centralized metrics
- Identify your highest-performing campaigns with dedicated visualization charts
- Monitor lead generation metrics including total leads and cost per lead
- Visualize your marketing funnel stages with conversion analytics
- Compare campaign efficiency across all your Quora advertising initiatives
The template is built in Looker Studio with a Coupler.io connector, it provides a comprehensive view of your Quora ad campaigns with filterable metrics and performance visualizations.
Other PPC reporting templates to consider
While Facebook Ads and Google Ads are the backbone of any PPC campaign, some marketers find other platforms more efficient and applicable. Solutions such as Amazon Ads, Bing Ads, Pinterest Ads, Apple Search Ads, etc., are also frequently used for advertising.
In the sections above, we have presented mostly the PPC report templates designed by Coupler.io for popular advertising sources. Here, we mention another bunch of templates by different providers for other advertising platforms.
NOTE: Check out reporting templates by Coupler.io for marketing, SEO, sales, and other activities.
#15 Amazon Ad report template by Two Minutes Reports
Even if you don’t sell anything on Amazon, you can refer to Amazon Ads to promote your products anywhere online. Amazon Ads use different kinds of ads that appear on product pages, shopping checkout pages, homepage, and other Amazon pages. By using the Amazon Ad report template by Gox, you can monitor your PPC campaign with Amazon and decide whether it’s profitable.
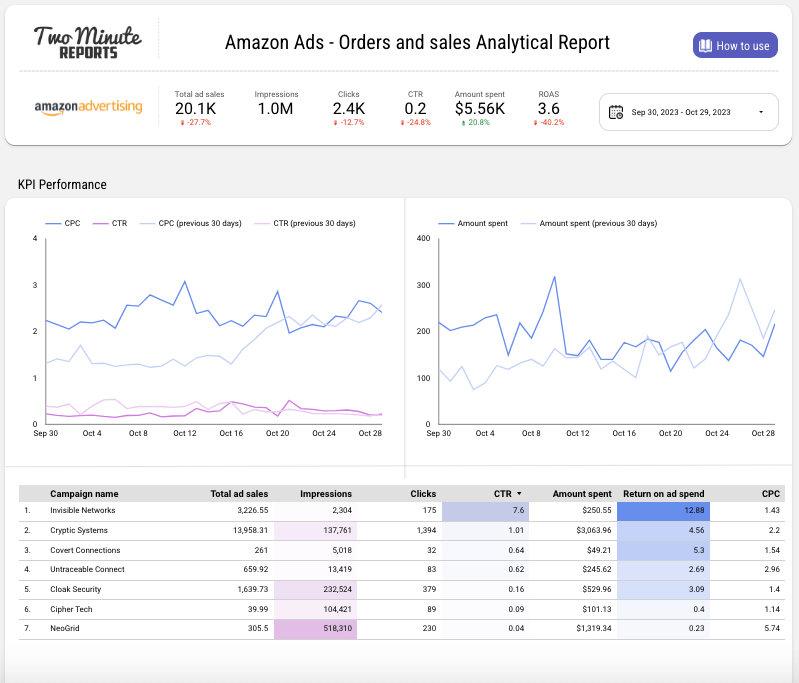
Similar to the Apple Search Ad provided above, this template is also integrated into Looker Studio. The setup instructions appear once you click How to use in the upper-right corner of the screen.
What insights you can get
- Track total ad sales and return on ad spend metrics
- Monitor click performance and conversion efficiency
- Analyze campaign performance across products and ad types
- Identify top-performing keywords and search terms
- Measure advertising cost of sales (ACoS) to optimize profitability
#16 Multi-channel PPC audit report template (Twitter, YouTube, Bing ads) by OWOX
In case you consider YouTube Ads, Bing Ads, X (Twitter) Ads, Facebook Ads, and Google Ads in your PPC campaign, you might consider the multi-channel PPC report template by OWOX. It helps track the key PPC campaign metrics for each channel and discover which of them best interacts with your target audience.
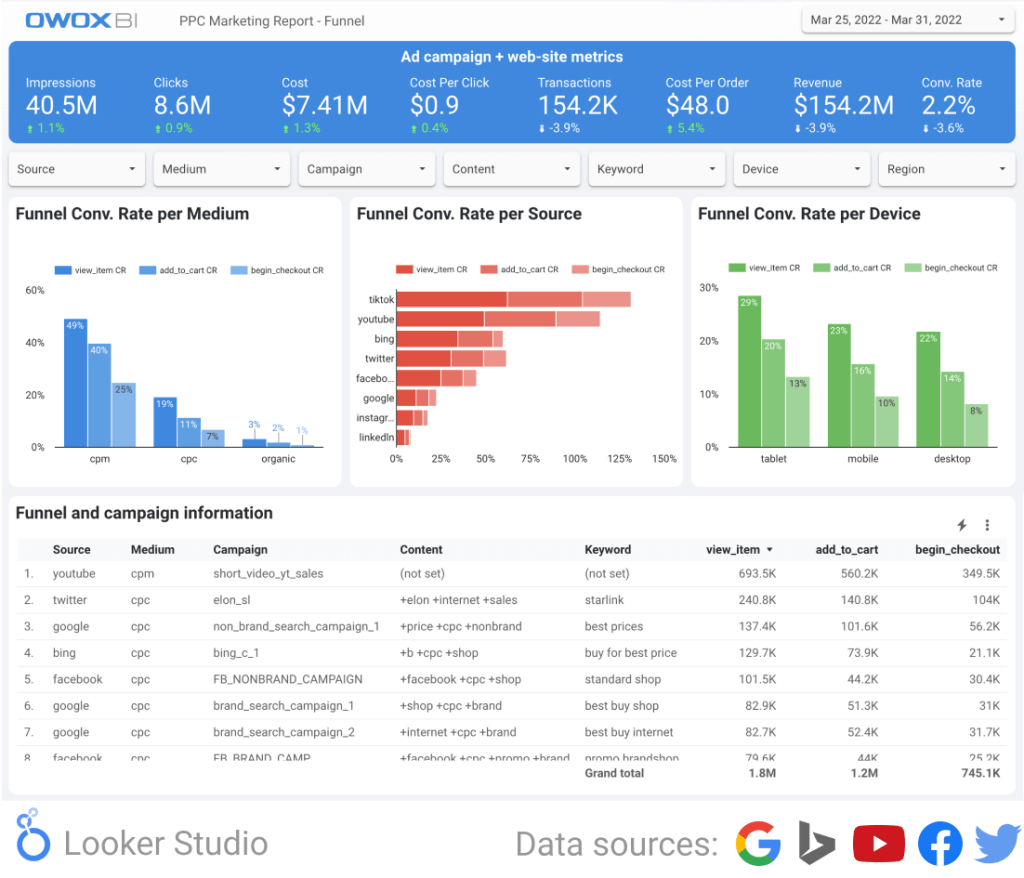
This template is also designed for Looker Studio, but you’ll first need to book a demo with OWOX to see how it works and find out more details about this template.
What insights you can get
- Compare performance across multiple platforms (Twitter, YouTube, Bing)
- Identify strengths and weaknesses in cross-channel campaigns
- Track conversion metrics across different ad platforms
- Monitor cost efficiency metrics to optimize budget allocation
- Analyze audience engagement across different platforms
#17 Microsoft Ads (Bing Ads) report template by POWERMETRICS
Google encompasses more than 90% of global search engine traffic, but Bing and Yahoo are also popular. Both these search engines provide the possibility for ad promotion via a cost-per-click model generally known as Microsoft Ads (previously Bing Ads). If you rely on these channels within your PPC campaign, consider the report template by POWERMETRICS.
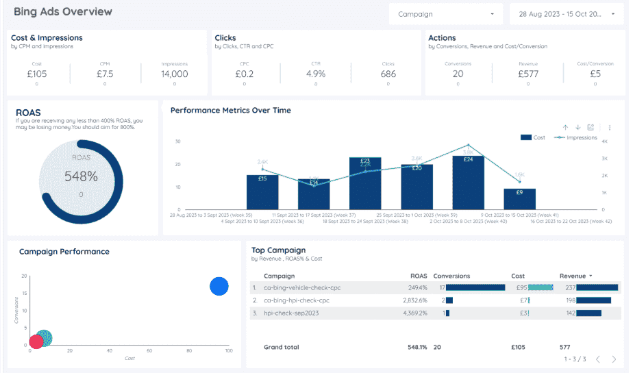
Microsoft Ads report template allows you to examine campaigns, locations, keywords, and network analytics for ROI optimization. This report template works with Google Looker Studio, but it can’t be used for free. Its cost starts from £70 ($90), but further customization is available at extra cost.
What insights you can get
- Track campaign performance across locations and ad networks
- Monitor keyword performance to optimize search targeting
- Analyze device performance to refine targeting strategies
- Identify top-performing campaigns by conversion metrics
- Track position and placement impact on campaign performance
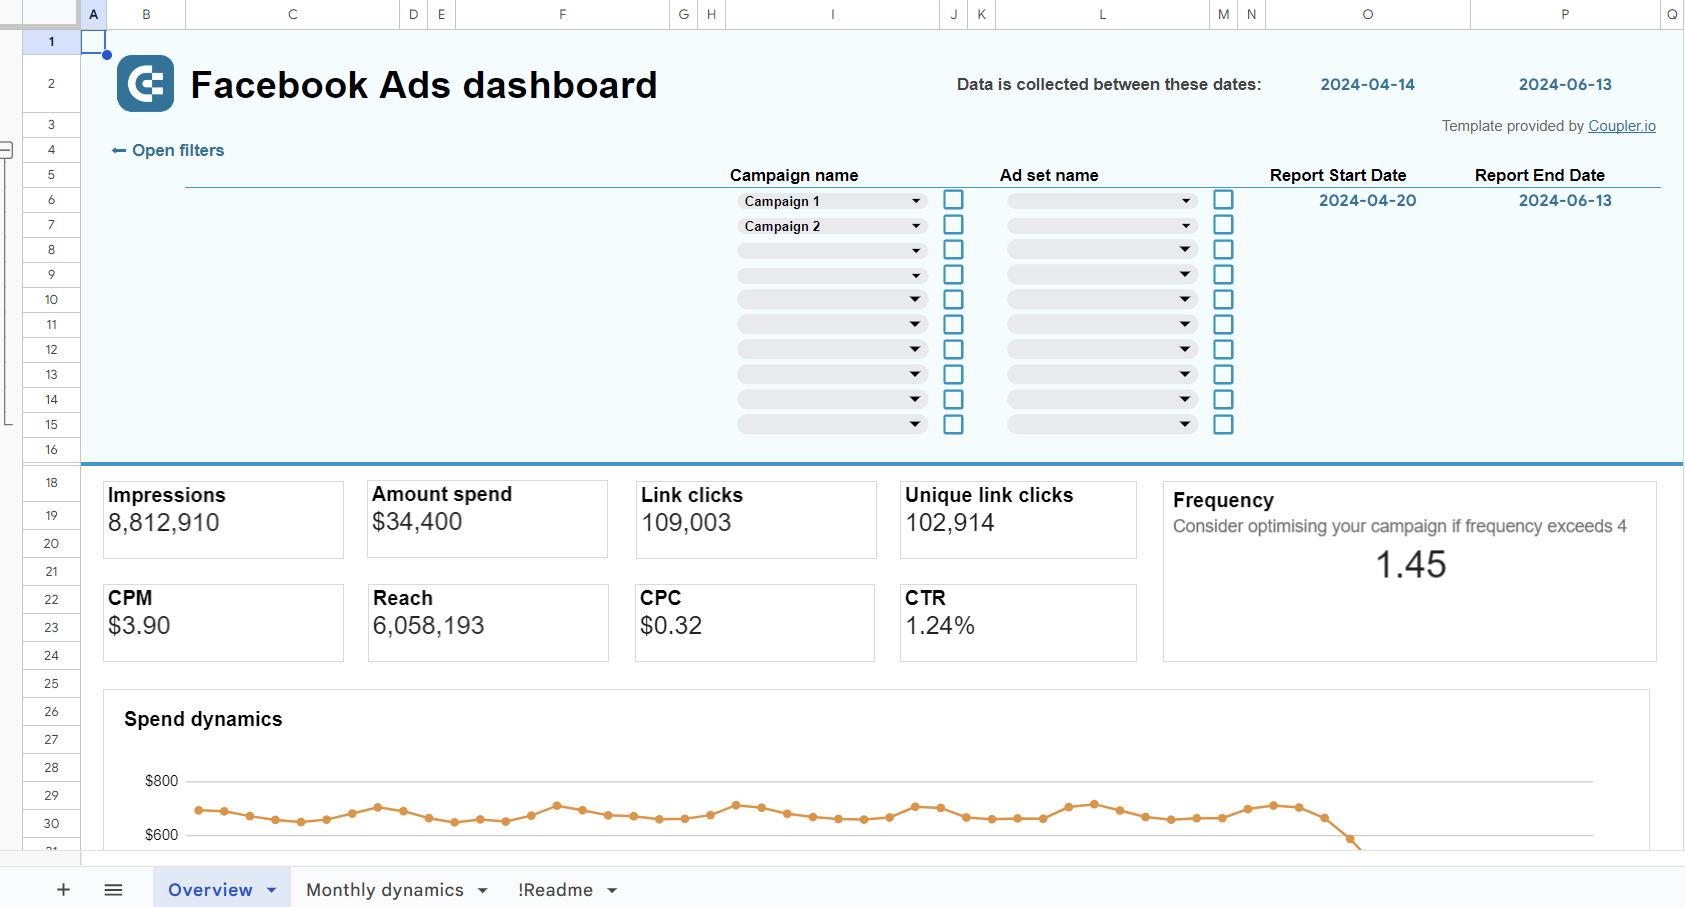
#18 PPC report Excel template
If you’re used to working with spreadsheet-like reports using Microsoft Office and configuring everything manually, you can try the Excel report template.
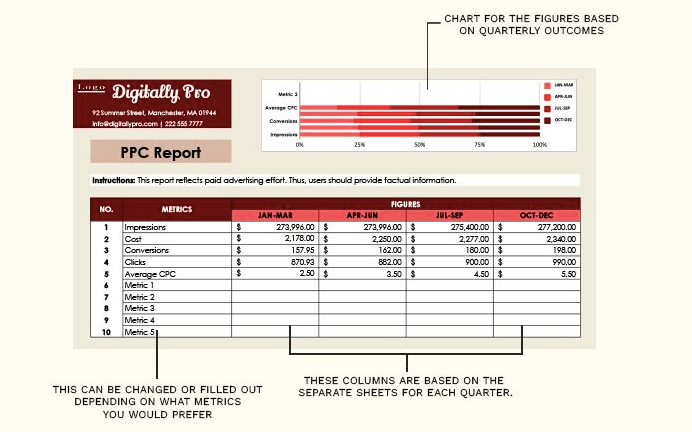
This Excel report template contains key metrics with predefined formulas and calculations for your PPC campaign evaluation. It’s also possible to modify those metrics and add other necessary ones that suit your specific needs. It also contains charts using the information from the sheets for each quarter.
There’s also an online version in the spreadsheet format designed for Google Sheets.
What insights you can get
- Track key performance metrics with customizable reporting
- Measure ROI with built-in formulas and calculations
- Analyze campaign performance with quarterly comparison views
- Compare performance across different time periods
- Create custom metrics tailored to specific business goals
How to create a report using a free PPC template
We have presented multiple types of PPC report templates above – online and offline, multi–channel and mono-channel, etc. Given that marketers often rely on a variety of platforms in PPC campaigns, we focus on creating a PPC multi-channel report for Looker Studio with Coupler.io.
This shows Facebook Ads, Google Ads, and other advertising channels on one page and allows marketers to compare ads performance. You’ll learn how to integrate marketing campaign data from advertising platforms, adjust the ad campaign performance metrics, and tune up other essential parameters.
The setup itself is quite intuitive and takes no more than 3 minutes:
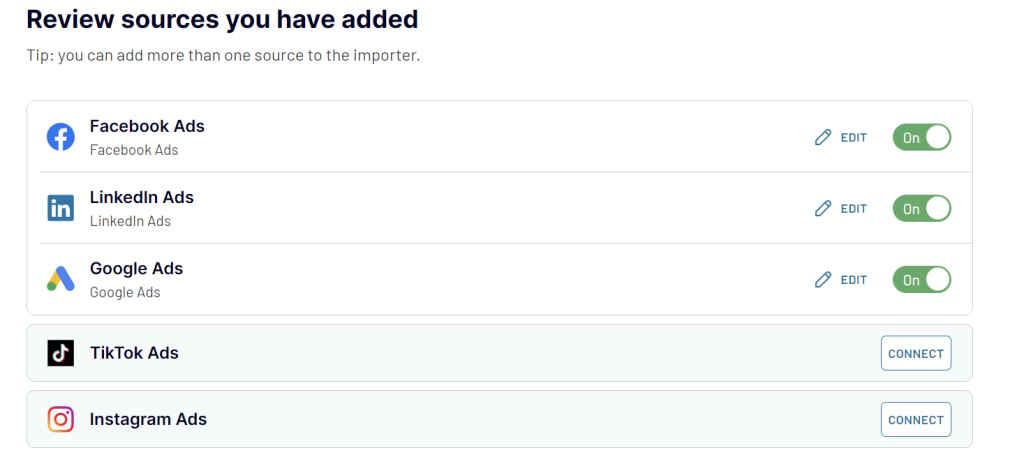
- Follow this link to start configuring the PPC report template. If you are a new user, you’ll be asked to create a Coupler.io account first.
- Connect ads accounts for the sources included in your PPC campaign and ignore those that you don’t use.
- Click Proceed to preview the data to be loaded. No actions are needed here.
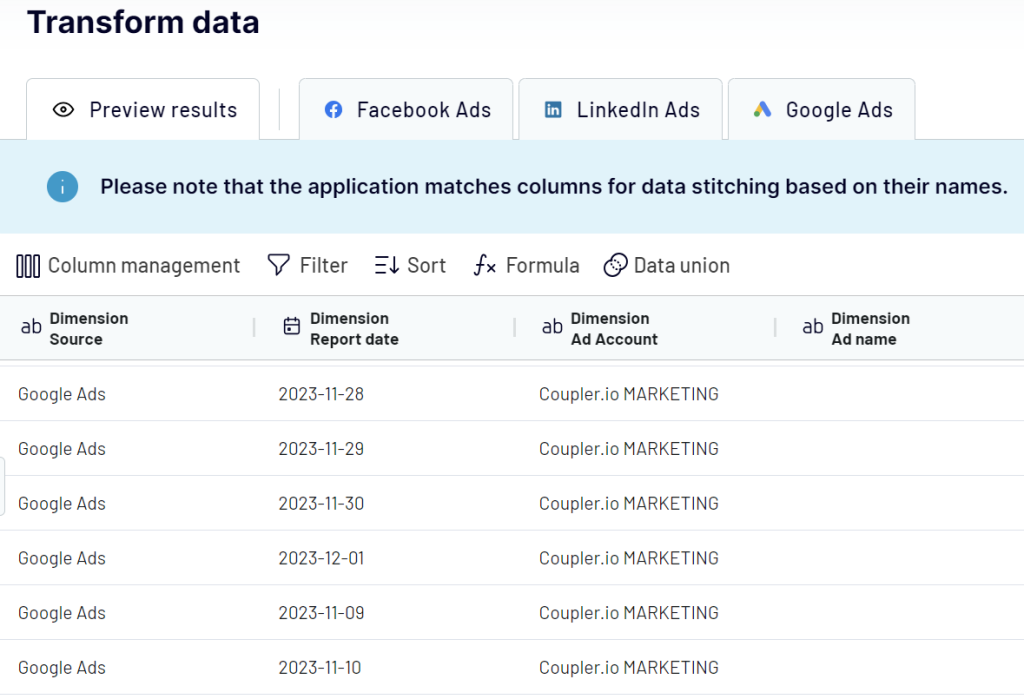
- Click Proceed and follow the widget instructions to authorize the connector and create a data source in Looker Studio.
- Click Create report in Looker Studio.
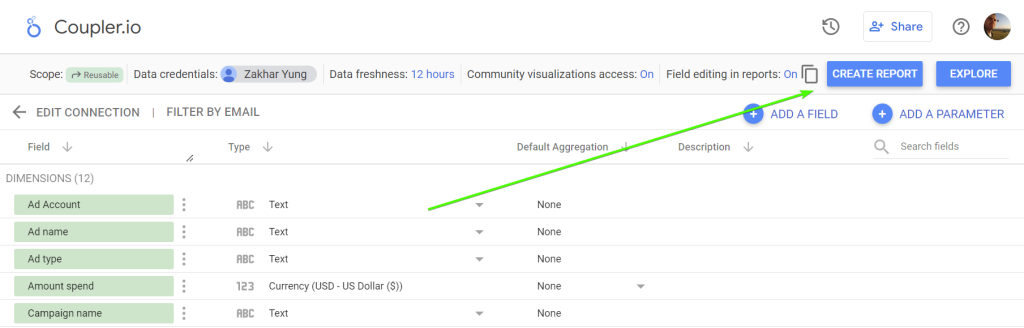
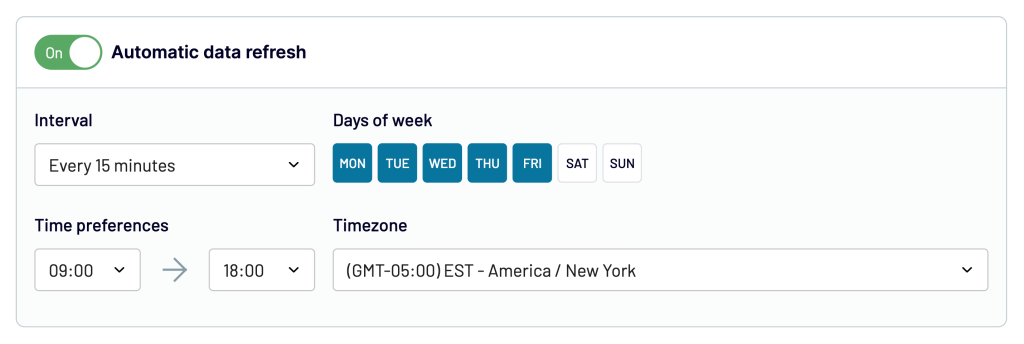
Then, you will be redirected to the copy of the PPC report containing your data. The dashboard will be updated automatically every day by default. If you want to have a more frequent data refresh, go back to Coupler.io and schedule updates to your taste. Every 15-minute refresh will make your dashboard near real-time!
Bookmark your new PPC dashboard to always have the performance data of your ad campaigns at your fingertips.
After you sign up for Coupler.io for free and click Add New Importer, you can craft your custom reports with our 60+ data sources or discover the gallery of our ready-to-use dashboards!
Benefits of using PPC report templates for e-commerce businesses
Some of the main reasons marketers use PPC advertising include increased brand awareness, quality traffic, transparency, and measurable results. The latter point emphasizes that assessing your ad campaign performance is not rocket science. Anyway, you need to be careful in picking up the right performance indicators.
Other reasons why marketers choose PPC report templates include but are not limited to:
- Templates come preconfigured, so they save marketers much time on setting up and running everything from scratch.
- They contain all the necessary metrics for selected ad channels, which best reflect their effectiveness and performance.
- They easily connect to advertising platforms and integrate all the necessary marketing data for reporting.
- A multi-channel PPC report template also allows marketers to compare performance across channels and reconfigure the PPC campaign based on the obtained results.
- PPC report templates for Looker Studio can be easily shared with your team members.
The importance of choosing the right PPC monthly report templates
As your business develops, you might try different platforms for advertising your products or services. However, to better understand which ones work best for you, you need to regularly craft the PPC reports.
Doing everything manually can be a nightmare, and it might not truly reflect the effectiveness of your ad campaigns. Consider PPC reporting templates by Coupler.io to get clear and precise results.
Working with Coupler.io’s PPC report templates means that you gain:
- Connection to all principal ad channels (Facebook Ads, LinkedIn Ads, Google Ads, Twitter Ads report templates, etc.).
- Easy configuration and setup.
- Near-real-time report updates.
- Assessing the results of paid search, including ROI and ROA.
- Marketing campaign automation.
Overall, these reports will help you discover whether the ad campaign spending is justified, explore your lead funnel, and discover more facts about your target audience. For the best effect, use them together with Looker Studio SEO report templates and other marketing dashboards.


