Pay-per-click advertising has long been one of the top three go-to channels for driving results. Marketers are drawn to its strong ROI, targeting capabilities, and budget control flexibility. But what can you actually achieve with PPC marketing in 2025? This article breaks down PPC’s potential with stats by ad type and key benchmarks across the 10 biggest industries.
Top PPC statistics for 2025
Let’s start with a list of essential PPC stats based on research across all industries:
- 93% of marketers consider PPC an ‘effective’ or ‘highly effective’ marketing channel.
- Research by Google estimates that businesses earn $2 for every $1 spent on PPC advertising, with optimistic returns as high as 800%.
- In the US market, Google is the main platform where 98% of PPC marketers run their campaigns. Meanwhile, 76% use Facebook and 70% use Instagram.
- Around 45% of SMBs spend between US$100 – $10,000 on PPC advertising every month, according to WebFX.
- 84% of polled marketers report having achieved good results with PPC campaigns.
- One study found that PPC converts about 50% better than SEO and is easier to measure than organic search.
- Surveys by WebFX found that 1/3 of businesses spend between US$500 – $3000 on monthly PPC services from an agency.
- 49% of PPC marketers believe it’s harder than it was 2 years ago to manage campaigns, according to The State of PPC 2024 report. The key reasons are:
- Fewer audience insights due to the decline of third-party cookies and new privacy regulations.
- Reduced control over ad outcomes due to growing reliance on automated bidding.
- An increasingly saturated market and highly competitive auctions.
Platform-specific PPC benchmarks for 2025
What kind of results should you expect and aim for in your PPC campaigns this year? In the table below, we’ve compared performance benchmarks for the most popular PPC platforms.
| Platform | Avg. CTR (%) | Avg. CPC ($) | Avg. CPA/L ($) | Avg. CPM ($) | Avg. Conversion rate (%) |
| Google Ads(Search) | 3.17 [1] | 2.69 [1] | 48.96 [1] | 0.51 – 1.00 [2] | 3.75 [1] |
| Facebook Ads(Lead gen campaigns) | 2.53 [3] | 1.88 [3] | 21.98 [3] | 13.57 [4] | 8.78 [3] |
| Instagram Ads | 1 – 2 [5] | 0.01 – 0.25 [5] | 5.00 – 15.00 [6] | 0.01 – 4.00 [5] | 1.08 [7] |
| LinkedIn Ads | 0.54 [8] | 5.58 [8] | 15.00 – 350.00 [8] | 26.91 [8] | 6.10 [8] |
| YouTube Ads | 0.51 [9] | 3.56 [9] | – | 9.00 [9] | 0.05 – 0.5 [10] |
| TikTok Ads | 0.84 [11] | 0.20 – 2.00 [11] | – | 3.21 [11] | 0.46 [11] |
| Microsoft (Bing) Ads | 2.83 [12] | 1.54 [12] | 41.44 [12] | – | 2.94 [12] |
Sources:
[1] https://www.wordstream.com/blog/ws/2016/02/29/google-adwords-industry-benchmarks
[2] https://www.webfx.com/blog/ppc/much-cost-advertise-google-adwords/
[3] https://www.wordstream.com/blog/facebook-ads-benchmarks-2024
[4] https://ninjapromo.io/how-much-do-facebook-ads-cost
[5]https://sproutsocial.com/insights/instagram-stats/#instagram-advertising-and-marketing-statistics
[6] https://www.wask.co/instagram-advertising-costs/cpl-cost-per-lead
[7] https://www.webfx.com/blog/social-media/how-much-does-it-cost-to-advertise-on-instagram/
[8] https://www.theb2bhouse.com/linkedin-ad-benchmarks/
[9] https://www.adconversion.com/blog/youtube-ads-cost-benchmark#5th
[10] https://www.storegrowers.com/youtube-ads-benchmarks/
[11] https://lebesgue.io/tiktok-ads/tiktok-ads-benchmarks-for-ctr-cr-and-cpm
[12] https://www.wordstream.com/blog/ws/2017/11/06/bing-ads-performance-benchmarks
Search advertising statistics
Search is the dominant channel for PPC marketers in 2025, but it also faces the most competition.
- The worldwide search advertising market is projected to be worth US$351.55bn in 2025.
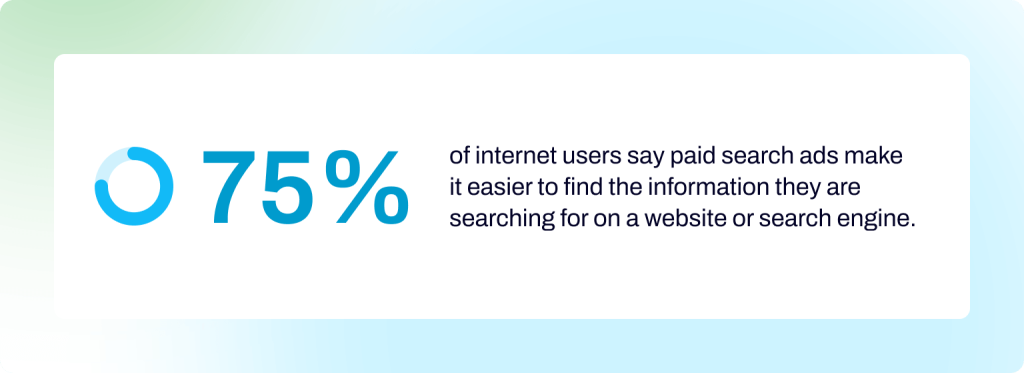
- Clutch research revealed that 75% of users say paid search ads ‘make it easier to find the information they are searching for on a website or search engine.’
- In 2025, businesses are expected to spend an estimated US$58.21 per internet user on search advertising, according to Statista.
Google Search Ads
- Google is the largest platform for search advertising, holding around 89% of the search engine market share, according to StatCounter.
- In 2023, Google Search’s annual global ad revenue reached $175 billion, with a CAGR of 19%.
- The average CTR for Google Search ads across all industries is about 3.17%, based on benchmarking research by Wordstream.
- PPC marketers pay an average of US$2.69 per click for their Google Search ads.
- Google Search ads have an average CPA of US$48.96, reflecting the platform’s competitiveness, as this is only marginally higher than Microsoft ads at US$41.44.
- 42% of surveyed PPC marketers slightly or significantly increased their budget for Google keyword-based text ads in 2024.
- With an estimated 29% market share, Google Ads is the leading advertising software for businesses, followed by AdRoll (10.40%), Criteo (10.12%), and Outbrain (7.68%).
Pro tip
To optimize Google Ads for conversions, don’t hyperfocus on copy tweaks and quick quality score boosts. Use a PPC dashboard to track key metrics, enhance your understanding of audience demographics and behavioral patterns, and ultimately improve targeting accuracy.
Microsoft (Bing) Ads
- Bing receives 4% of the search engine market share and about 500 million unique visitors per month, making it the second biggest platform for search advertising.
- Statista research shows that Bing ad revenues have increased YoY since 2016, totaling US$12.58bn in 2024.
- The average CPC of Bing Ads is US$1.54, around 40% lower than that of Google Ads.
- Paid search is Bing’s most underutilized marketing channel for customer acquisition, accounting for less than 0.01% of website traffic.
Pro tip
Detailed report templates can provide much-needed visibility into the performance of your Bing Ad campaigns. Tracking impressions, spend dynamics, clicks by demographics, and more can reveal key insights for optimization.
Key search advertising benchmarks for your industry
Let’s take a closer look at key search advertising benchmarks for the top 10 industries, such as e-commerce, technology, and B2B. The data is derived from a 2024 LocaliQ study of 17,000 search campaigns marketers ran on Google and Microsoft platforms.
Average click-through rate (CTR) by industry
| Industry | Avg. CTR |
| E-commerce & Retail | 7.81% |
| Finance & Insurance | 7.71% |
| Healthcare & Medical | 6.88% |
| Education | 6.21% |
| Real Estate | 9.20% |
| Travel & Hospitality | 10.16% |
| B2B & Business Services | 5.62% |
| Technology | 2.09% (Google only, no Bing data) |
| Legal Services | 5.30% |
| Automotive | 5.69% (For Sale) / 8.58% (Repair, Service & Parts) |
Average cost-per-click (CPC) by industry
| Industry | CPC |
| E-commerce & Retail | $2.61 |
| Finance & Insurance | $3.00 |
| Healthcare & Medical | $4.71 |
| Education | $4.31 |
| Real Estate | $2.10 |
| Travel & Hospitality | $1.92 |
| B2B & Business Services | $5.37 |
| Technology | $3.80 (Google only, no Bing data) |
| Legal Services | $8.94 |
| Automotive | $2.34 (For Sale) / $3.39 (Repair, Service & Parts) |
Average conversion rate by industry
| Industry | Conversion rate |
| E-commerce & Retail | 3.49% |
| Finance & Insurance | 2.78% |
| Healthcare & Medical | 7.40% |
| Education | 7.91% |
| Real Estate | 2.91% |
| Travel & Hospitality | 5.36% |
| B2B & Business Services | 5.78% |
| Technology | 2.92% (Google only, no Bing data) |
| Legal Services | 5.64% |
| Automotive | 6.49% (For Sale) / 12.96% (Repair, Service & Parts) |
Average cost-per-lead (CPL) by industry
| Industry | CPL |
| E-commerce & Retail | $42.10 |
| Finance & Insurance | $75.94 |
| Healthcare & Medical | $61.56 |
| Education | $71.52 |
| Real Estate | $87.36 |
| Travel & Hospitality | $66.02 |
| B2B & Business Services | $105.64 |
| Technology | $133.52 (Google only, no Bing data) |
| Legal Services | $144.03 |
| Automotive | $42.95 (For Sale) / $27.94 (Repair, Service & Parts) |
Social media PPC statistics
Besides search engines, social media platforms are the most popular channel to run PPC campaigns on, thanks to their high engagement rates and massive reach.
- Global social media ad spending currently amounts to an estimated $234.14 billion, an increase of 140% in under 5 years.
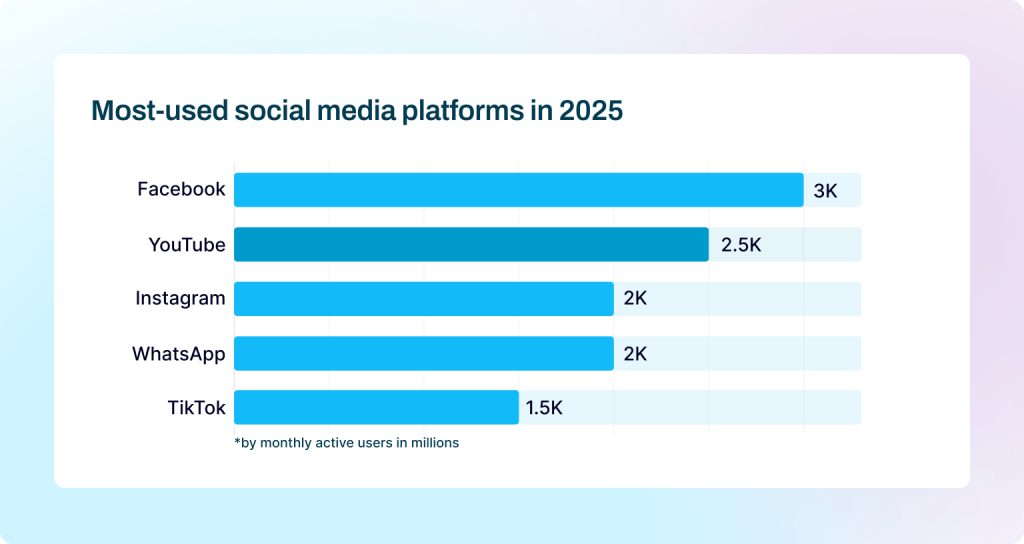
- The top 3 most-used social media networks in 2025 are Facebook with 3 billion monthly active users (MAU), YouTube (2.5 billion MAU), and Instagram (2 billion MAU).
- In 2024, people spent an average of 2 hours and 20 minutes daily on social media apps, according to Statista.
Facebook Ads
- Around 76% of PPC marketers regularly run ad campaigns on Facebook.
- Enhancing existing ad sets with video ads can lead to an 18% increase in conversions, research by Meta shows.
- Wordstream research reveals that the B2B and Business Services industry enjoys one of the lowest CPLs from Facebook Ads, with an average cost of US$16.95.
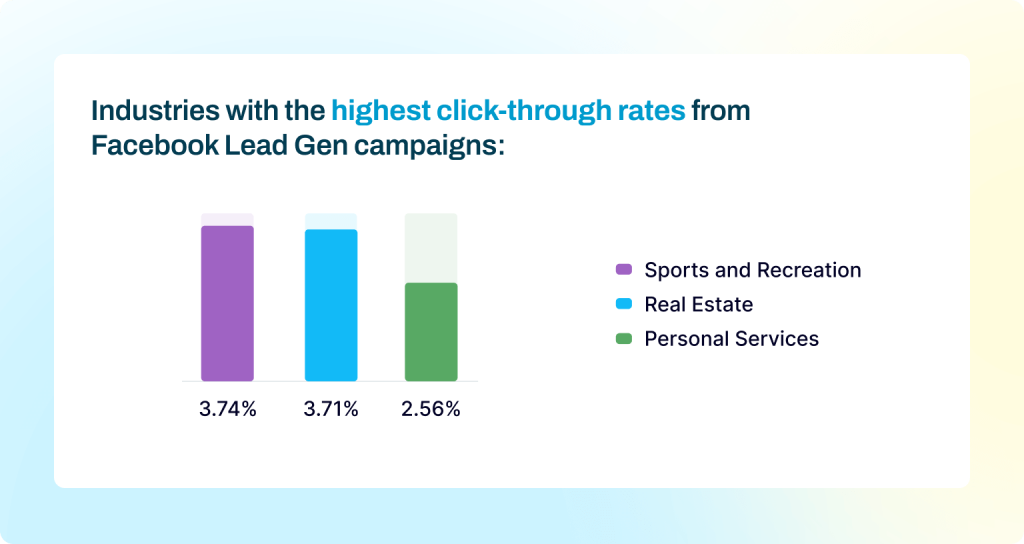
- The industries with the highest click-through rates for Lead Gen campaigns are Sports and Recreation (3.74%), Real Estate (3.71%), and Personal Services (2.56%).
- The average CTR for Traffic campaigns slightly increased YoY from 1.51% in 2023 to 1.57% in 2024, according to Wordstream research.
- The most-used Facebook ad objectives are Engagement (42%) and Traffic (33%), according to a short global study in 2024.
- Videos are among the most cost-effective ad formats, with some marketers reporting a CPC as low as US$0.18.
- 40% of marketers say that Facebook is one of the major drivers of ROI for their teams, according to the 2025 State of Marketing Report by HubSpot.
- 19% of marketers in 2025 plan to invest more of their budget in Facebook than in any other social media channel.
- Facebook reported ad revenues of US$116 billion in 2025, the second-highest behind Google (Alphabet).
Pro tip
Segmenting Facebook ads based on the audience’s position in the buyer funnel helps align your content with their interests and intent. This full-funnel approach can lead to higher return on investment and ROAS for your campaigns.
LinkedIn Ads
- According to LinkedIn’s own research, brands observed a purchase intent increase of 33% after running targeted paid ads on LinkedIn.
- Audiences are 6x more likely to convert when exposed to both brand and acquisition ads on LinkedIn.
- Research by The B2B House puts the average global CPC for LinkedIn ads at US$5.58 – about twice as expensive as Google Ads.
- People working in business development, education, and media & communication spaces are most likely to click on LinkedIn ads, with CTRs averaging between 0.63–65%.
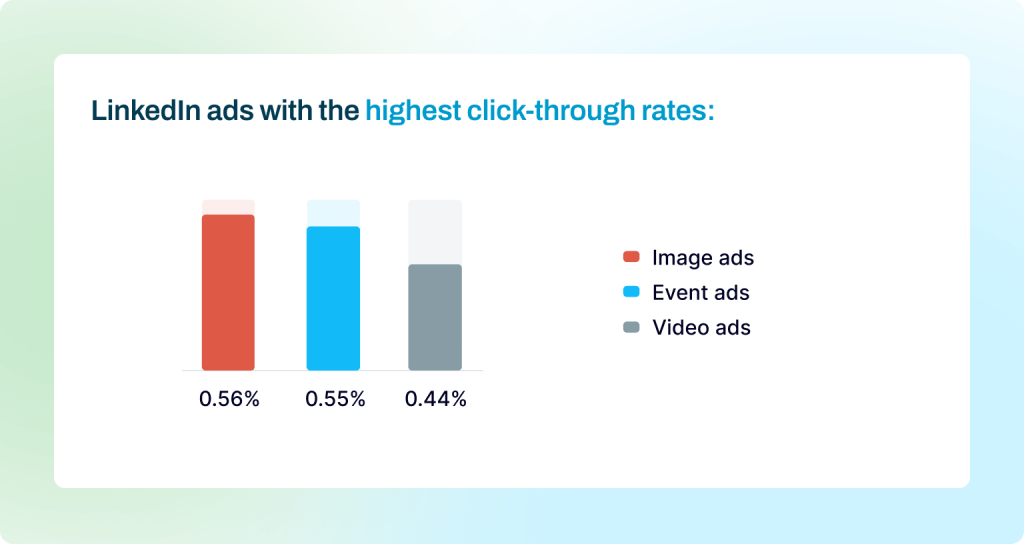
- Image-based ads tend to receive the most clicks on LinkedIn (0.56% CTR), with event (0.55%) and video ads (0.44%) close behind.
- The average engagement rate for non-video ads is 0.5% and 1.6% for video ads.
- Businesses should aim for a Lead generation form completion rate of around 10%.
- Video content is growing at about 2x the rate of other formats on LinkedIn.
- LinkedIn is the third most important social media platform for marketers worldwide, right behind Facebook and Instagram (Statista).
- eMarketer reports that 70% of marketers are confident LinkedIn can deliver a good ROI for their business.
Pro tip
Maximizing the performance of your LinkedIn ads relies on several interconnected factors, such as strong calls to action and finding the lowest CPC bid. Learn more about how to achieve this in our guide to LinkedIn optimization.
Instagram Ads
- In-feed (image, video, carousel, shopping, etc.) are the most popular ad formats, accounting for 54% of Instagram’s ad revenue.
- A CTR of between 0.58% and 1.20% is considered average-to-good for Instagram ads, depending on the ad format, industry, and campaign objective.
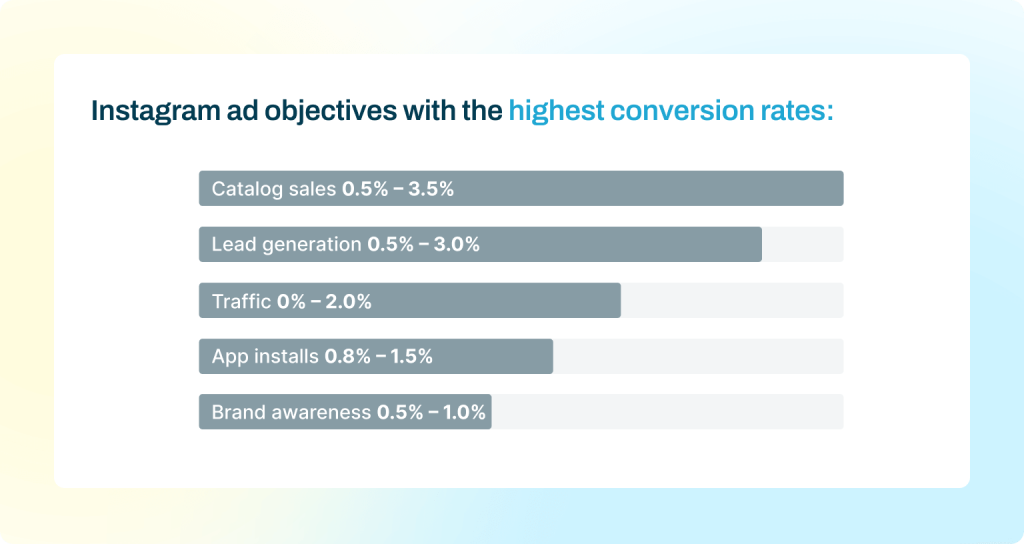
- SproutSocial reports that lead generation campaigns typically receive the most engagement with a potential conversion rate of up to 3%.
- Hootsuite puts the average CPC for Instagram ads at $0.40-0.70, with CPM averaging at $2.50-3.50 in 2025.
- 46% of PPC marketers plan to slightly or significantly increase their budget for Instagram Ads in 2025.
- Instagram is the second most-used social media channel by marketers worldwide, according to Statista.
- 61% of social media users look to Instagram for inspiration on their next purchase.
Pro tip
Storytelling is at the heart of Instagram ads’ success this year, but it’s not the only key element. Read our expert guide on the 12+ best practices for Instagram ads in 2025.
Pinterest, Reddit, and X Ads
- Ad spending on Pinterest has risen YoY, increasing by 430% between 2020 and 2024.
- Pinterest is fast becoming a go-to advertising platform. Marketers saw a 35% increase in impressions in 2024, according to the Tinuiti benchmarking report.
- 59% of small businesses surveyed by WebFX spend US$0–500 per month on Pinterest ads.
- Habitual Reddit users are 46% more likely to trust ads they see on Reddit than ads they encounter on other web and social media sites.
- 30% of Reddit users are not on Facebook, 45% are not on Instagram, 58% are not on TikTok, and 68% are not on LinkedIn. This makes Reddit a critical platform for capturing more leads if you already advertise on several other platforms.
- An annual HubSpot report named Reddit as an emerging digital marketing platform alongside Discord and Threads; around 10% of marketers use them in 2025.
- Marketers are spending less and less on X (Twitter) ads. The platform’s ad revenues dropped by an estimated 50% between 2022 and 2024, according to Statista.
- 26% of marketers plan to cut their spending on X ads in 2025.
- Still, you don’t have to spend a lot of money to get your ads seen on X. A 2024 experiment by a marketer showed that an investment of just US$130 could yield 150,000 impressions, a CTR of 1%, and a CPC of around $0.08.
Video advertising statistics
Video is one of the fastest-growing channels and is already delivering impressive ROI for PPC marketers.
- Ad spending on short-form videos is expected to reach US$111 billion in 2025.
- 21% of marketers agree that short-form videos deliver the highest ROI compared to image and text-based content, according to a 2025 HubSpot report.
Tiktok
- TikTok has a global advertising audience of 1.5 billion users, or 13.1% of the total world population.
- DemandSage reports that ad revenue for TikTok is expected to reach US$33.12 billion in 2025, up 40% from last year.
- 97% of viewers were motivated to tune in to TV content (shows, movies, live events, etc.) after seeing an ad on TikTok, according to Statista research.
- 64% of consumers who made a purchase after seeing TikTok ads were only exposed to TikTok, making it a powerful platform for driving sales.
- In fact, up to 22% of bottom-of-the-funnel conversions can be attributed to TikTok Ads.
- Around 28% of marketers are using TikTok with the goal of increasing brand exposure and traffic.
- 35 hours is the average amount of time TikTok users spend on the app each month.
Pro tip
Monitoring the right metrics is vital for TikTok ads success in 2025. If you’ve been tracking the basics so far, now is the time to go deeper and focus on the metrics that matter for your goals. We explain it all in this ultimate guide to TikTok Analytics.
Youtube
- YouTube is the sixth most popular digital ad platform in the US and the ‘most-used’ social media platform in the world.
- 27% of marketers say that YouTube has the best audience targeting capabilities compared to Facebook, Instagram, and TikTok.
- YouTube Ads have an average cost-per-view (CPV) of US$0.05. This is counted when someone watches your video ad for more than 30 seconds.
- The average CTR for YouTube in-stream ads is 0.51%, based on benchmarking data from Ad Conversion.
- The average CPC for YouTube Ads is US$3.56, about 2.5x higher than TikTok’s.
- Viewers consider YouTube Shorts ads to be more personally relevant and engaging than ads on TikTok, according to Google research.
- The highest-performing YouTube Shorts videos contain clear calls to action (e.g., share or purchase).
Pro tip
Experiment with different ad formats (especially Shorts) to find the right fit for your target audience. YouTube offers plenty of options, and you can discover tips on how to optimize them in this guide to maximizing YouTube ads ROI.
Shopping ads statistics
Shopping ads on Amazon and Google continue to deliver great results for marketers in the e-commerce and retail industry.
Amazon Ads
- Similarweb data shows that Amazon receives 2.3 billion visits per month and ranks as the #1 e-commerce and shopping marketplace in the United States.
- Amazon sellers typically spend an average of US$260 per day on PPC ads, according to benchmarking research by Ad Badger.
- The average click-through rate for Amazon Ads across all industries is between 0.25 and 0.45%.
- The average Advertising Cost of Sales (ACOS) ranges between 25 and 36% depending on the industry. According to Ad Badger research, beginners should aim for around 30%.
- Daily average ad impressions exceed 57 million on the platform, with major peaks (+170 million) during Prime Day and the winter season.
- Amazon Ads tend to convert at a rate of 9.96% – about 7x higher than the typical e-commerce conversion rate of 1.33%.
- Marketers rated Amazon’s targeting effectiveness as ‘excellent’ or ‘very good’ in a survey of U.S. consumer packaged goods.
Google Shopping campaigns
- In the e-commerce space, about 85% of all clicks on Google Ads go to shopping campaigns.
- The average CPC for shopping ads is US$0.66, which is 3 times cheaper than the Search Ads CPC.
- Research by StoreGrowers found that optimizing product titles in the Google Product Feed led to a 147% increase in impressions and a 67% increase in ad clicks.
- AI-driven Performance Max is the most popular campaign type for shopping ads, with 93% of marketers choosing this option, according to a Tinuiti benchmarks report.
- Shopping campaigns can generate better quality leads for e-commerce businesses thanks to unique elements like product photo(s) and price displays.
Display ads statistics
A picture is worth a thousand words – or potentially thousands of dollars for marketers leveraging display ads in 2025.
- By 2026, display advertising spending is expected to reach US$266.6 billion, an almost 30% increase over 3 years (Statista).
- An estimated 27% of consumers conduct an online search for a business after seeing a display ad.
- Around 22% of marketers incorporate display ads into their advertising strategies, according to HubSpot.
- eMarketer research reveals that 90% of display advertising budgets are spent on programmatic, reflecting its importance for optimization and targeting in this ad niche.
- Traditional display ads receive around 50% fewer clicks than native ads (e.g., sponsored links on relevant sites).
- PPC ads on the Google Display Network (which comprises over 2 million websites and apps) have the potential to reach up to 90% of global internet users.
Pro tip
Display ads can be highly effective when shown to audiences in the middle of the buyer funnel. Their visual component helps you reach customers who are actively researching your brand or planning to make a purchase.
Retargeting ads statistics
- Retargeting ads deliver around 150% higher click-through rates for B2B compared to B2C.
- DemandSage reports that 77% of marketers retarget audiences by advertising on Facebook and Instagram.
- The average CTR for retargeting ads is about 0.7% across industries.
- However, click-through rates for retargeting ads plummet by about 50% once they have been running for over 5 months.
- Retargeting software can potentially triple ad conversion rates on products that were abandoned in the cart, according to Criteo research.
- The retargeting software market is expected to be worth around US$8.8 billion by 2029.
Local PPC advertising statistics
- 80% of consumers prefer to see ads tailored to their local surroundings (city, zip code, etc.).
- Local service ads (LSAs) have a much lower click-through rate than regular Search ads. Potentially, only 0.02% of ad impressions may become leads, according to Wordstream analyses.
- Close to 50% of all Google searches are centered around finding local services.
Mobile PPC statistics
- Mobile devices generate over 60% of global web traffic, making mobile-optimized ads vital for PPC marketing success.
- 63% of consumers use mobile search to find information on brands and products they are interested in.
- Research by G2 in 2025 found that marketers will dedicate about 64% of their digital ad budget to mobile advertising.
- An estimated 73% of e-commerce sales will be made via mobile devices in 2025.
- Worldwide spending on mobile advertising reached approximately US$400 million in 2024, based on data collected by Statista.
AI usage in PPC statistics
- According to Google, marketers who ran AI-powered (Demand Gen) campaigns alongside Search and/or Performance Max campaigns saw a 14% increase in conversions on average.
- 69% of PPC marketers surveyed for The State of PPC 2024 report said they were satisfied with AI’s ability to create effective ad copy, while only 31% were happy with its budget management applications.
- In a McKinsey global study, 47% of businesses reported that implementing Gen AI in their marketing functions helped reduce costs over a 12-month period.
- 92% of businesses are utilizing AI-powered personalization techniques in different functions (including paid advertising) to drive growth.
PPC trends you can’t ignore in 2025
Let’s explore the top three PPC trends that can impact and accelerate your campaign success this year:
1. The shift to first-party data. With the sharp decline of third-party cookies, marketers are turning to first-party data for crucial audience insights. Analyzing CRM data, conducting surveys, and tracking offline conversions can help you fine-tune targeting based on customer preferences and behaviors.
2. Rise of PPC automation. 58% of marketers are using automation to eliminate time-consuming routine tasks. Automated bidding and AI-powered content creation are helping PPC professionals create more tailored campaigns and free up time for strategic planning, experimentation, etc.
3. The value of UGC and influencer ads. Both B2B and B2C brands are finding success with micro-influencers (10-100K followers), according to a HubSpot survey. User-generated content has become a priority as audiences gravitate toward ads with an under-produced look and feel.
Key sources
- Statista
- 2025 State of Marketing Report by HubSpot
- The State of PPC Global 2024 report by PPCSurvey.com
- Wordstream
- WebFX
- Think with Google
- eMarketer research and reports
- SproutSocial social media trends
- The B2B House
- G2 mobile marketing statistics
- StoreGrowers
- Ad Badger