What is a P&L report?
A profit and loss report, also known as a P&L statement, is a financial document that summarizes revenues, expenses, and profits or losses over a specific period. It provides insight into your company’s ability to generate revenue, control costs, and achieve profitability.
In this article, you will explore how to prepare your P&L step by step and automate reporting. Plus, we’ll give you free templates that help you do this. But before we begin, let’s examine how a P&L report can add value to your business.?
Why a profit & loss report is necessary for your business
First, a P&L report is required by IFRS and other standards to present financial performance at least annually, particularly for public companies. Second, it serves many additional purposes and can be helpful even if it’s not mandatory for you:
- Assess your business’s profitability: A P&L report allows you to evaluate whether you generate enough revenue to cover costs and produce a profit by comparing your earnings with your expenses. This way, you know whether your business is financially healthy or needs adjustments.
For instance, if you run a digital marketing agency and earn $50,000 for the month while your expenses (salaries, software, rent, etc.) total $31,000, you’d have a net profit of $19,000. This shows profitability, but if expenses were higher than revenue, it would indicate a loss.
- Track changes in financial performance: By comparing P&L metrics across different periods, you track shifts in financial performance and identify what’s driving them.
For example, when you compare this year’s results to last year’s, you’ll see whether certain expenses are growing faster than predicted. If r evenue increased by 20%, but expenses rose by 75%, it’s worth investigating to understand the cause of the discrepancy.
- Ensure accurate tax reporting: Tax preparation is another key scenario where a profit and loss report is beneficial.
Let’s say you rely on an annual P&L to prepare your company’s tax return at the end of the fiscal year. In that case, you’d use the report to calculate taxable income based on revenue and various expenses. Otherwise, tracking these numbers becomes much more complicated, leading to mistakes or missed deductions.
- Identify cost-saving opportunities: Your profit and loss report may reveal opportunities to renegotiate vendor contracts, optimize workflows, or discontinue products or services that don’t deliver enough value.
Suppose once again that you run a digital marketing agency, and the P&L statement shows that a specific tool contributes only 5% of your revenue but accounts for a large portion of your monthly costs. If so, it might make sense to replace or eliminate this tool.
- Develop advanced revenue strategies: If you sell multiple products or services, you can break them down across various lines on your P&L. This helps you identify which ones are more profitable and whether some are growing while others are shrinking. As a result, you can adjust marketing strategies or reallocate resources to maximize revenue streams.
Imagine you’re running a digital subscription service, and your report shows that the basic plan is consistently more profitable than the premium one. This insight would encourage you to focus your marketing efforts on the basic plan.
- Predict future trends: You can detect revenue patterns and trends by analyzing multiple P&L reports over time. This allows you to predict future outcomes with greater accuracy.
Referring back to the example above, if your reports show consistent growth in a specific service, you can predict that this trend will continue. Likewise, if revenue from a particular service drops over several periods, you can forecast a decline and adjust your strategy accordingly.
Types of PnL report explained
There are two types of P&L reports: cash-based and accrual-based. Let’s go over them in more detail:
Cash-based P&L report
The cash-based profit and loss report is a financial statement that simply tracks cash inflows and outflows. It is used when cash transactions are the primary basis for recording revenue and expenses, and only accounts for cash that is received (as revenue) or paid out (as expenses). This type of P&L is typically prepared by smaller businesses and individuals managing personal finances, as it focuses on actual cash flow rather than credit or future obligations.
Imagine you run an individual web design business. In one month, you receive $3,000 from a client (recorded as revenue), and you pay $500 for a software subscription (recorded as an expense). In a cash-based report, only the $3,000 received and the $500 paid would be recorded.
Let’s now present the simple P&L report example in table format:
| Category | Description | Amount (USD) |
|---|---|---|
| Revenue | Client payment for web design | $3,000 |
| Expenses | Software subscription | $500 |
| Net profit | Revenue – Expenses | $2,500 |
Accrual-based profit and loss report
Unlike a cash-based P&L, the accrual-based profit and loss report records revenue when it is earned, not necessarily when the payment is received. It also recognizes expenses when they are incurred, not when they are paid. This approach provides a more accurate picture of financial performance during a specific period and is commonly used by medium to large businesses.
For example, suppose your company delivers a $10,000 software project in December, but the client pays in January. In the accrual report, you would still record the $10,000 as revenue in December, when the service was completed. Likewise, if you receive a $2,000 invoice for advertising services in December but plan to pay it in January, you would still record the $2,000 as an expense in December.
Here’s how the results would look when put into a table:
| Category | Amount ($) |
|---|---|
| Revenue | |
| Software project billed (Dec, paid in Jan) | 10,000 |
| Website retainer (paid in Dec) | 5,000 |
| Total revenue | 15,000 |
| Expenses | |
| Salaries | 6,000 |
| Advertising (invoiced, not yet paid) | 2,000 |
| Software licenses | 1,000 |
| Total expenses | 9,000 |
| Net profit | 6,000 |
How to create a P&L report in 7 steps
For your information, ready-made profit and loss reports are available in accounting systems like Xero and QuickBooks. However, if you don’t use these systems or need to create a custom P&L report that provides specific insights beyond what standard accounting software offers, follow the steps below:
Step 1: Define the reporting period
Decide whether you’re creating a monthly, quarterly, or annual P&L to focus on the specific time frame for your analysis. For example, a quarter 1 (Q1) profit and loss report would include revenue and expenses from January 1 to March 31.
Tip: If you’re just starting or prefer more frequent insights, a monthly report is ideal for tracking cash flow and identifying trends quickly. For businesses with more stable cash flow or seasonal variations, it makes sense to do this quarterly. Annual reports are best for long-term strategic planning and high-level performance reviews, but may not provide the agility needed for day-to-day operations.
Step 2: Choose a method for reporting
Select between the two reporting methods to determine the level of detail in your P&L:
| Method | How to use |
|---|---|
| Single-step | Subtract all expenses and taxes from total income in one simple calculation to arrive at a profit figure. It’s fast and easy when you just need to know your bottom line. |
| Multi-step | Calculate different levels of profit (gross ? operating ? pre-tax ? net) using detailed cost components: COGS, operating expenses, and non-operating expenses. This lets you analyze cost efficiency and profitability at various stages. |
Step 3: Collect the necessary financial data
??To build a reliable P&L report, you need to collect complete and accurate financial data for the chosen period, including:
- Revenue records from client work, product sales, service retainers, etc. – to measure total income and identify your business’s earning sources.
- Receipts and invoices for contractors, freelancers, outsourced services, employee-related expenditures, and others – to capture direct costs tied to product or service delivery.
- Vendor payments like subscriptions to platforms and tools – to account for recurring operational expenses.
- Bank and credit card statements – to reconcile all financial transactions and verify that nothing has gone unnoticed.
This data is mainly found in accounting and partially in billing systems. To use this information for your P&L, you must extract it and pull it into spreadsheets or BI tools. However, accounting and billing systems typically lack native automation for integrating with spreadsheets and BI tools. As a result, a substantial amount of time goes into downloading and uploading data for report creation. This is also prone to human error and inaccuracies in calculations.
This data is typically stored across various systems – from spreadsheets and project management tools to CRM platforms and accounting software. Of course, you can collect and consolidate this information manually, spending a few hours per week.
On the other hand, use Coupler.io to automate data flows from the required sources to the tool you use for financial reporting. This data automation platform allows you to:
- Pull financial data from over 60 sources, including business apps, spreadsheets, CRMs, databases, e-commerce tools, and more.
- Extract data from accounting and financial software, such as Xero, QuickBooks Online, and Stripe.
- Combine data from multiple disparate systems into a single source of truth.
- Organize data using aggregation, filters, column management, calculations, etc.
- Automate the data refresh on a schedule.
- Get instant insights into your data with predesigned financial dashboard templates like the one below for Xero.

With Coupler.io, you can automatically extract data from various sources and consolidate it in spreadsheets or BI tools. This automation eliminates manual data entry, reduces human error, and ensures your custom P&L report contains accurate, up-to-date information from all relevant systems.
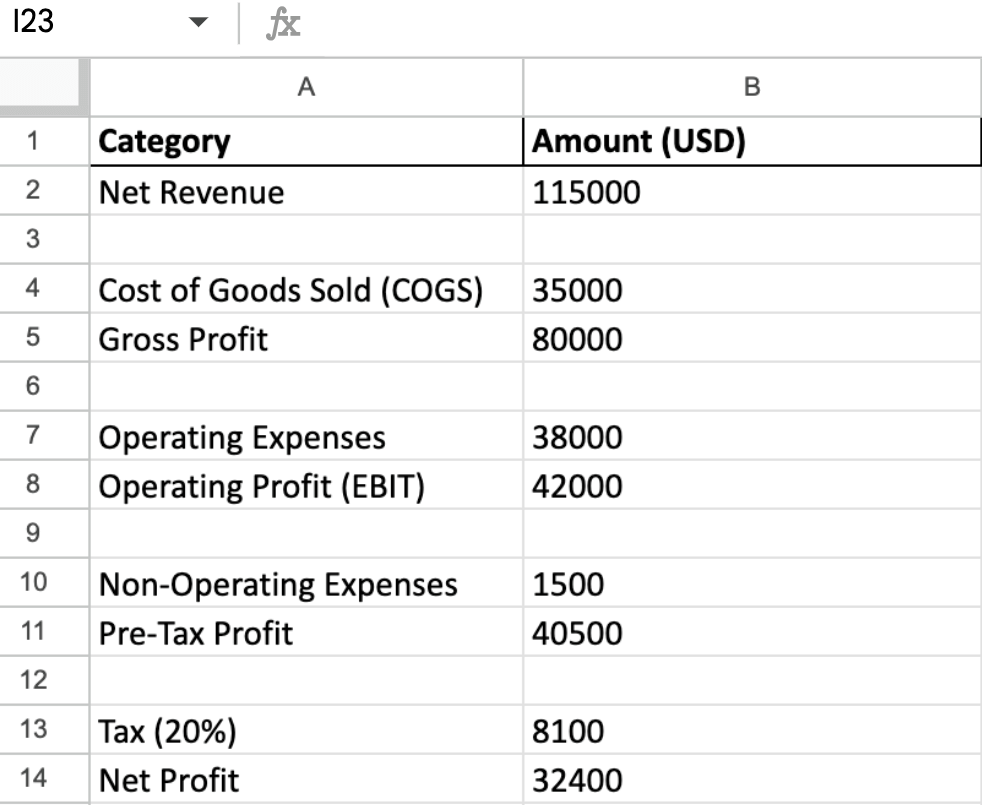
Step 4: Calculate net revenue
The first action here is to add up all your earnings during the reporting period to find your gross revenue. Then, subtract any discounts or refunds to calculate your net revenue (also known as net sales).
Suppose you’re a SaaS company with the following earnings for the quarter:
- Monthly subscriptions: $90,000
- One-time onboarding fees: $20,000
- Upsell features or add-ons: $10,000
In that case, gross revenue = $90,000 + $20,000 + $10,000 = $120,000.
At the same time, refunds and discounts totaled $5,000. As a result, net revenue is $120,000 – $5,000 = $115,000.
Step 5: Identify expenses
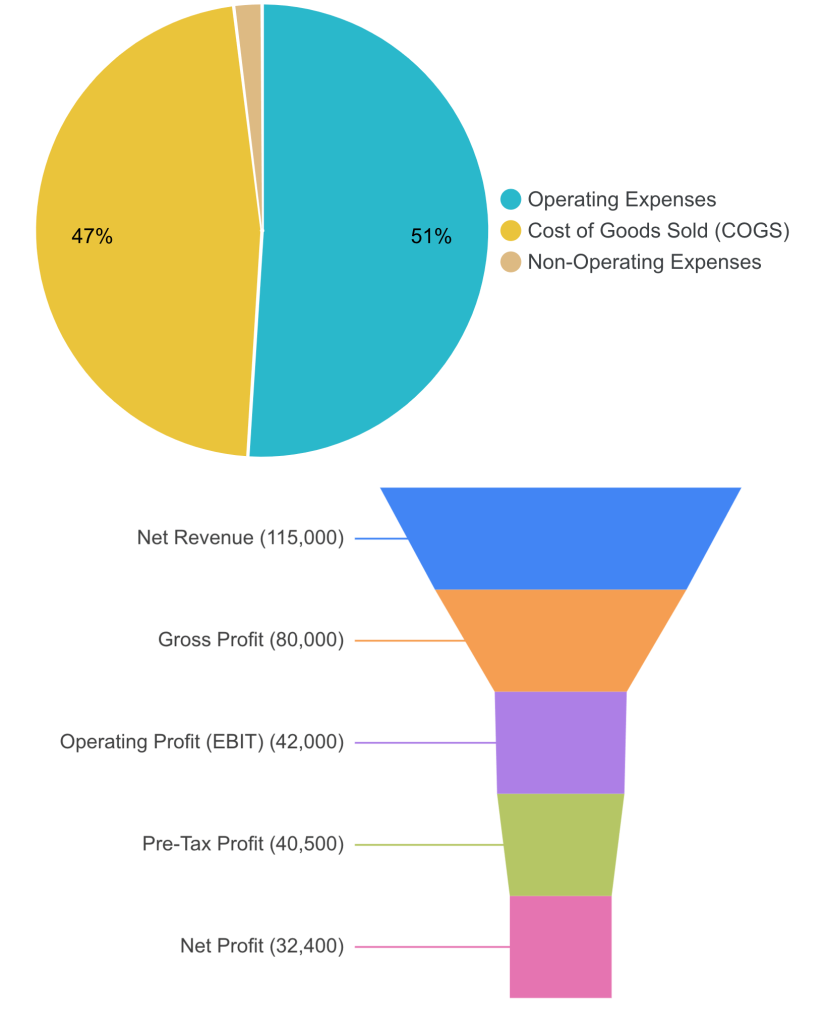
To understand the costs you’ve incurred to run your business during the period, find your expenses. In the single-step reporting method, you’ll simply add up all expenses in one category, for example, totaling $74,500. However, if you use the multi-step method, it will break down into the following:
- Cost of goods sold (COGS) – to assess direct expenses related to making your product or delivering your service.
- Operating expenses – to evaluate the day-to-day costs of running your business, such as software subscriptions, advertising spend, and payroll.
- Non-operating expenses – to identify costs not directly related to core operations, like interest payments or investment losses.
Let’s review each category one by one using our SaaS company example?
COGS
In our case, COGS will be the direct costs associated with delivering your software service to customers. This includes infrastructure, outsourced technical support, and third-party tools required to keep the platform running.
For example:
- Cloud hosting: $20,000
- DevOps support: $8,000
- Third-party integrations: $7,000
When we add these up, the total COGS comes to = $35,000.
Operating expenses
Operating expenses are costs necessary for running your business, but don’t directly relate to delivering your services. These could include ongoing team salaries, essential software subscriptions, workspace costs, or internal marketing tools that support operations.
For instance:
- Employee salaries: $25,000
- SaaS tools: $4,000
- Rent and utilities: $6,000
- Internal marketing (email tools, lead gen): $3,000
In total, operating expenses come to $38,000.
Non-operating expenses
Non-operating expenses are costs related to items not directly tied to core business operations, such as depreciation on the company’s assets or interest on loans.
Suppose you have the following:
- Interest paid on business loan: $800
- Depreciation on laptops and servers: $500
- Investment fees and losses: $200
This brings the total non-operating expenses to $1,500.
Step 6: Determine net profit
To calculate net profit – the ultimate measure of how much your business has earned (or lost) – subtract expenses and taxes from your net revenue. In the single-step method, it would look like this:
Net profit = (Net revenue – Total expenses) – ((Net revenue – Total expenses) ÷ 100 × Tax rate)
In our example:
- Net revenue: $115,000
- Total expenses: $74,500
- Tax rate: for instance, 20%
The net profit will be:
Net profit = ($115,000 – $74,500) – (($115,000 – $74,500) ÷ 100 × 20%) = $32,400
If, however, you had chosen the multi-step method for your P&L reporting, the calculation would be done for several levels of profit:
| Level of profit | Formula | Calculation |
|---|---|---|
| Gross profit | Revenue – Cost of goods sold (COGS) | $115,000 – $35,000 = $80,000 |
| Operating profit | Gross profit – Operating expenses | $80,000 – $38,000 = $42,000 |
| Pre-tax profit | Operating profit – Non-operating expenses | $42,000 – $1,500 = $40,500 |
| Net profit | Pre-tax profit – (Pre-tax profit ÷ 100 × Tax rate) | $40,500 – ($40,500 ÷ 100 × 20) = $32,400 |
Step 7: Finalize the P&L report format
Now that you’ve completed your calculations, upload the P&L report to your desired destination depending on the required format, and finalize it. For example:
- Spreadsheets (Google Sheets, Excel): Ideal for internal reviews, collaboration, and easy editing.

- BI tools (Looker Studio, Power BI, Tableau, Qlik): Best suited for building interactive dashboards, conducting advanced financial analysis, and trend monitoring. These tools are especially effective for presentations to executives, investors, or other stakeholders.

Congratulations! You now have a P&L report ready to support your financial analysis goals.
Free templates for your profit and loss report (and more!)
As you know, to create a profit and loss report, you must collect data and perform the necessary calculations to make it analysis-ready. Plus, it’s not just the P&L that’s required for financial data analytics; you also need the cash flow statement to understand how money moves in and out of the business and the balance sheet to see what you own and owe at a given time, etc.
To save you time and effort, Coupler.io offers a gallery of free financial dashboard templates, which include prebuilt P&L and other reports. Each template has a built-in Coupler.io connector, so the data is automatically loaded into the dashboard and visualized. Let’s take a look at some. ?
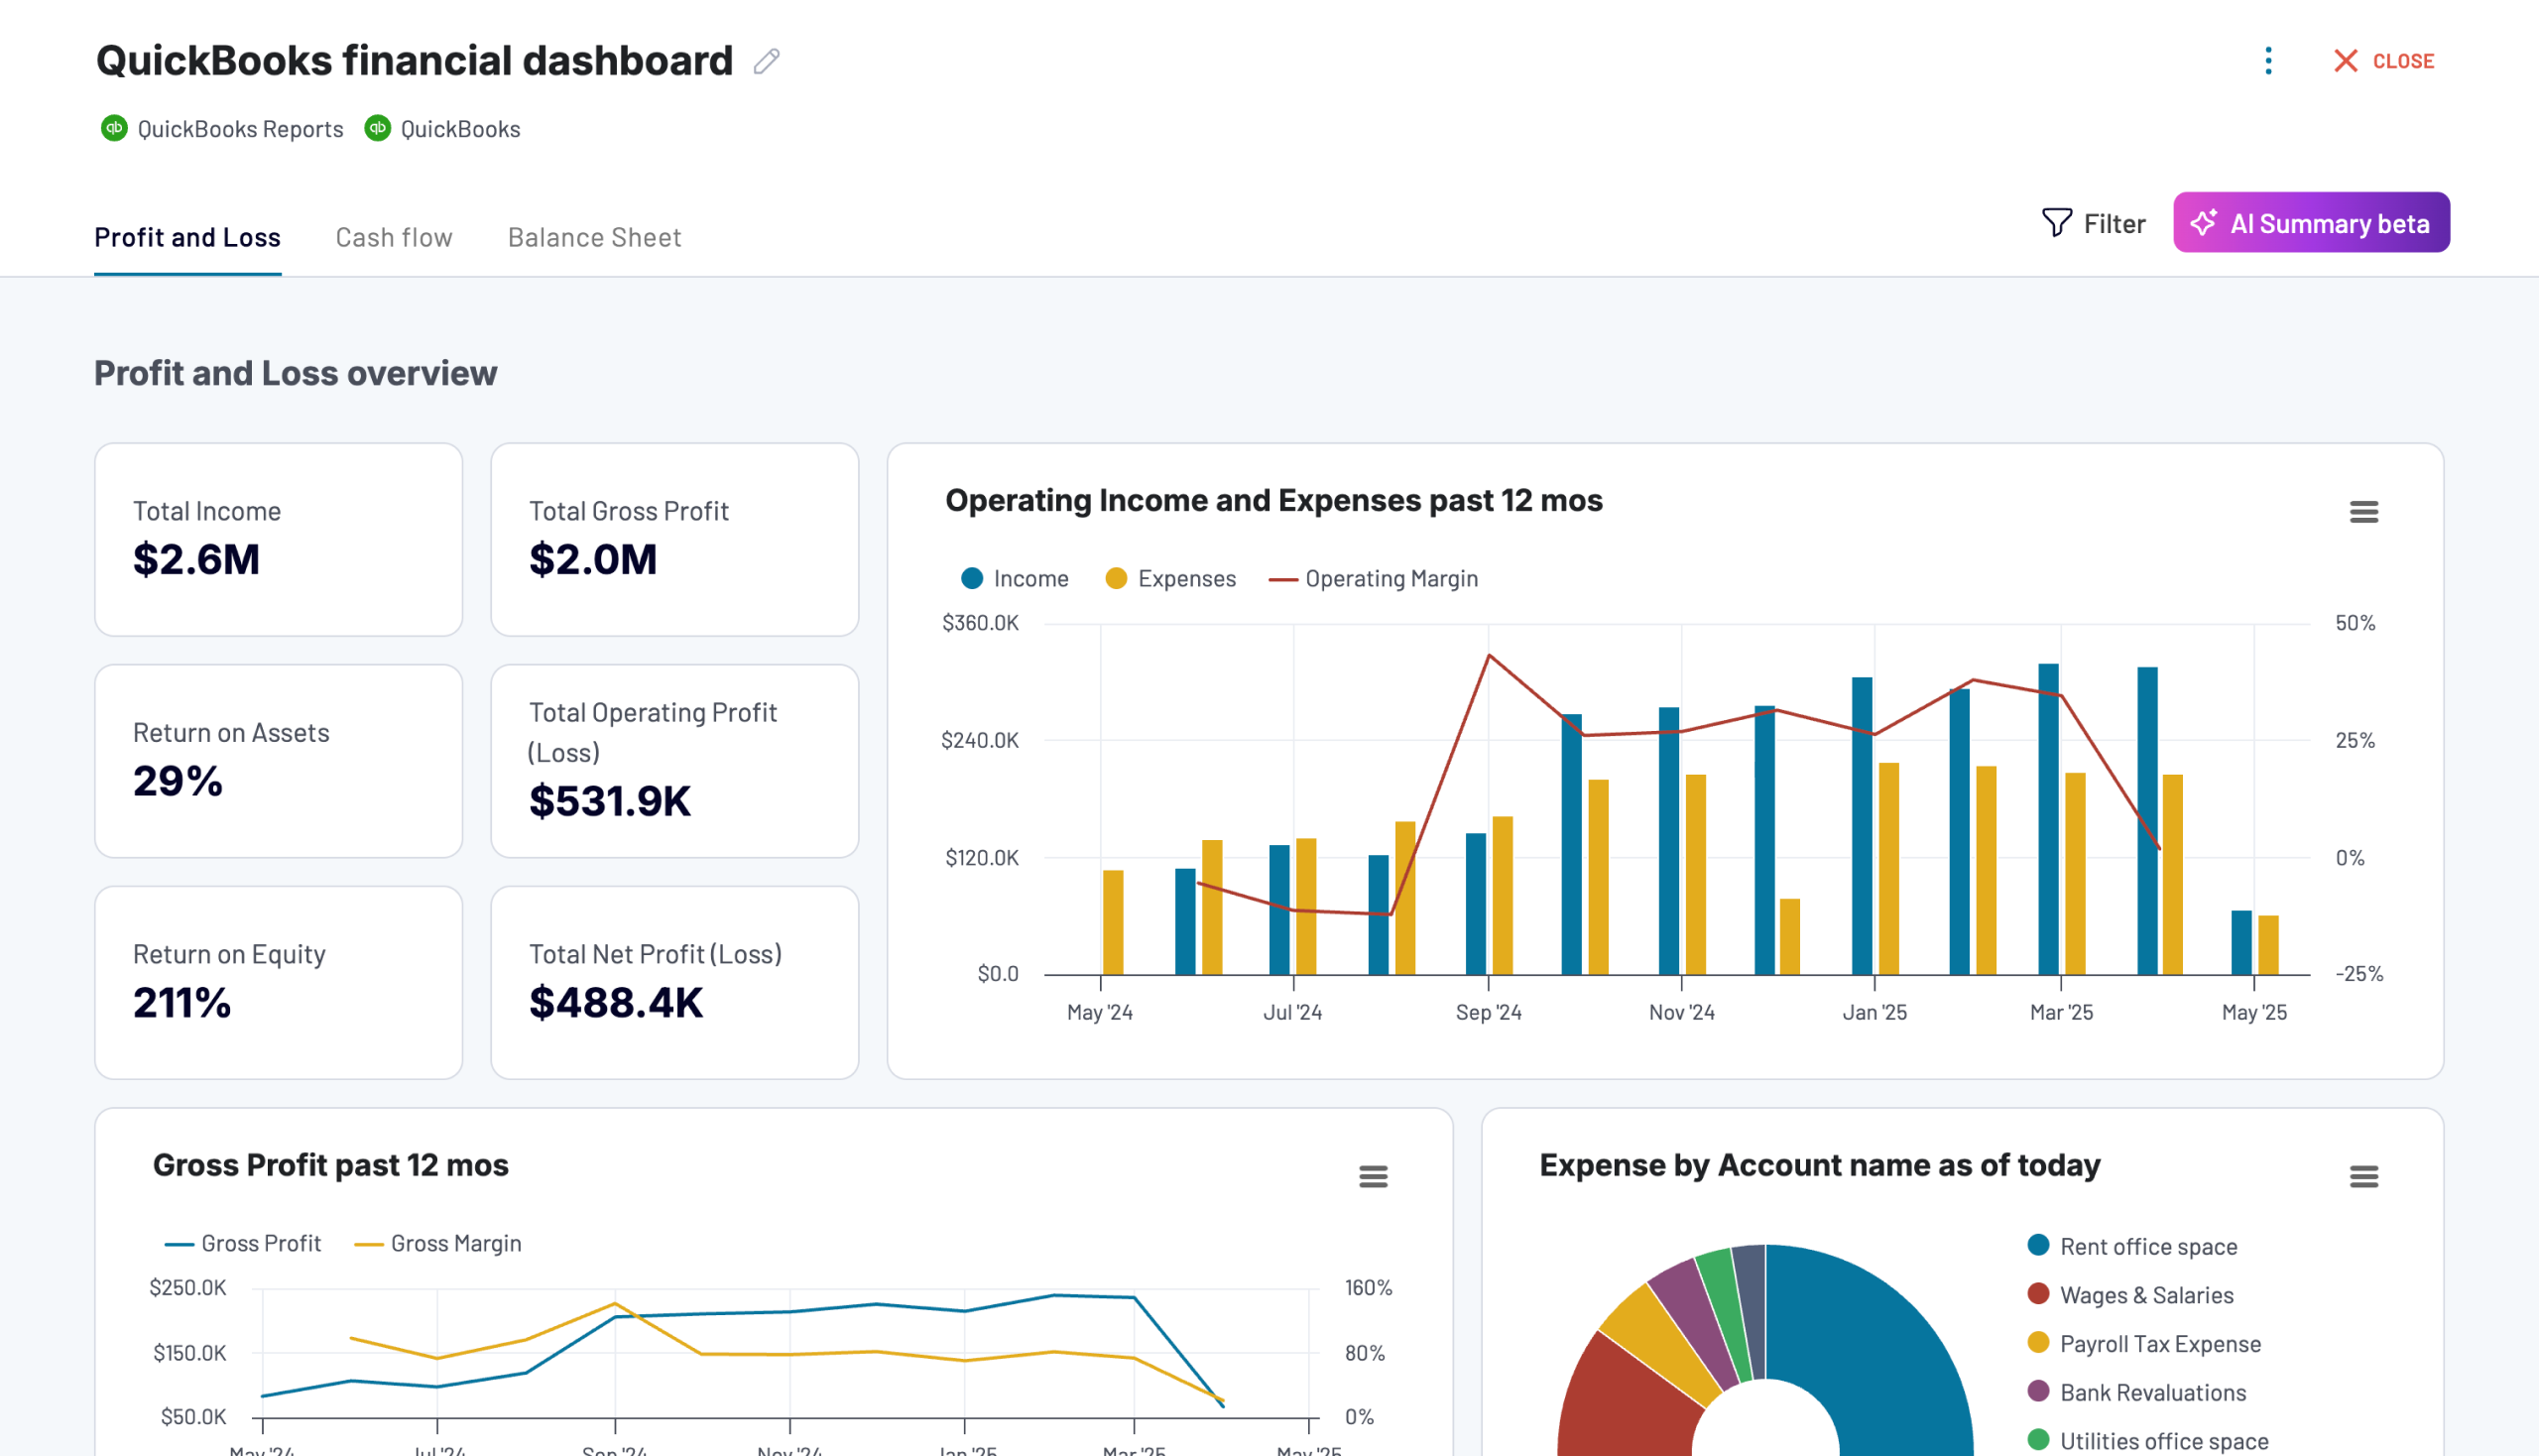
Financial dashboard for QuickBooks
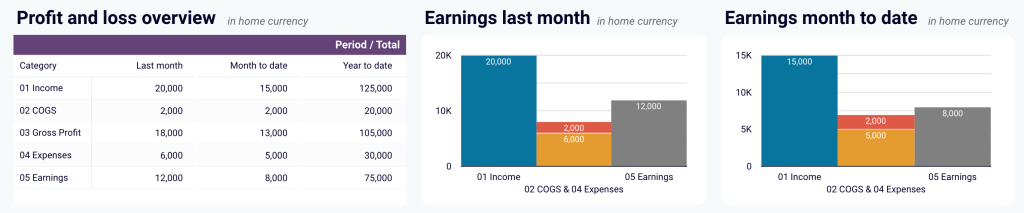
The QuickBooks financial dashboard allows you to track your profit and loss, along with cash flow and balance sheet changes. It’s perfect for getting an at-a-glance understanding of the company’s financial health without diving into detailed spreadsheets or reports.

Use this profit and loss dashboard to get a summary of your revenue, expenses, and net profit for the last month, month-to-date, and year-to-date, enabling you to monitor profitability and control costs. You can also compare your earning trends to identify growth patterns or areas needing improvement.

Beyond the P&L, there are other reports that allow you to:
- Take a snapshot of your assets, liabilities, and equity to understand your financial position, liquidity, and overall business health.
- Examine net cash changes over the reporting period to see how your position evolves, ensure effective liquidity management, and assess your financial stability.
- Review your available funds and list balances for all linked bank and cash accounts to help verify that all are reconciled.
This dashboard is designed in Coupler.io with AI insights available. Also, you can use it as a Looker Studio and Google Sheets template. To make it serve your reporting needs, go to the template’s Readme tab to set it up.
QuickBooks financial dashboard
Tracks earnings, monitor cash flow, and analyze balance sheet changes with a dedicated dashboard that provides a clear picture of your business finances.


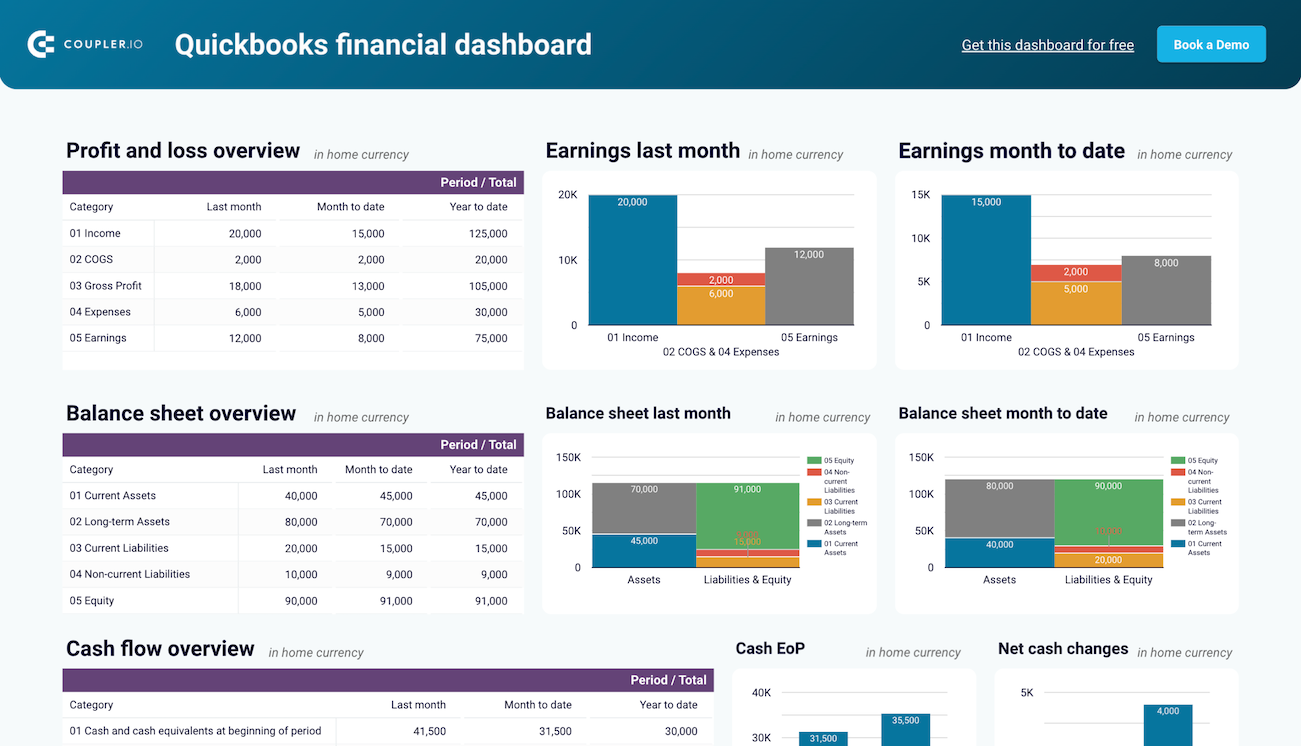
QuickBooks financial dashboard in Looker Studio
Monitor and analyze your business’s financial health with real-time insights into profit and loss, balance sheet, cash flow, and bank & cash accounts.
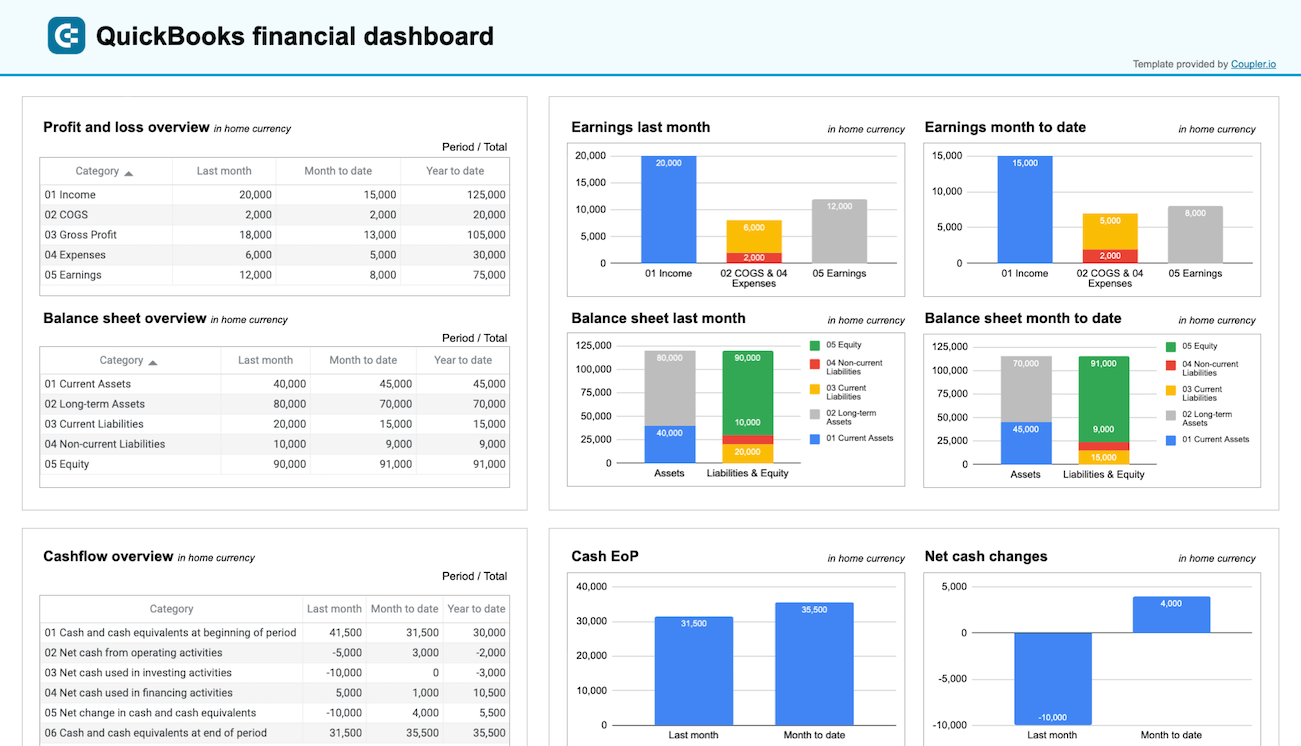
QuickBooks financial dashboard in Google Sheets
Get a clear snapshot of your business finances, including cash flow, P&L, balance sheets, and bank accounts, powered by data from QuickBooks Online.
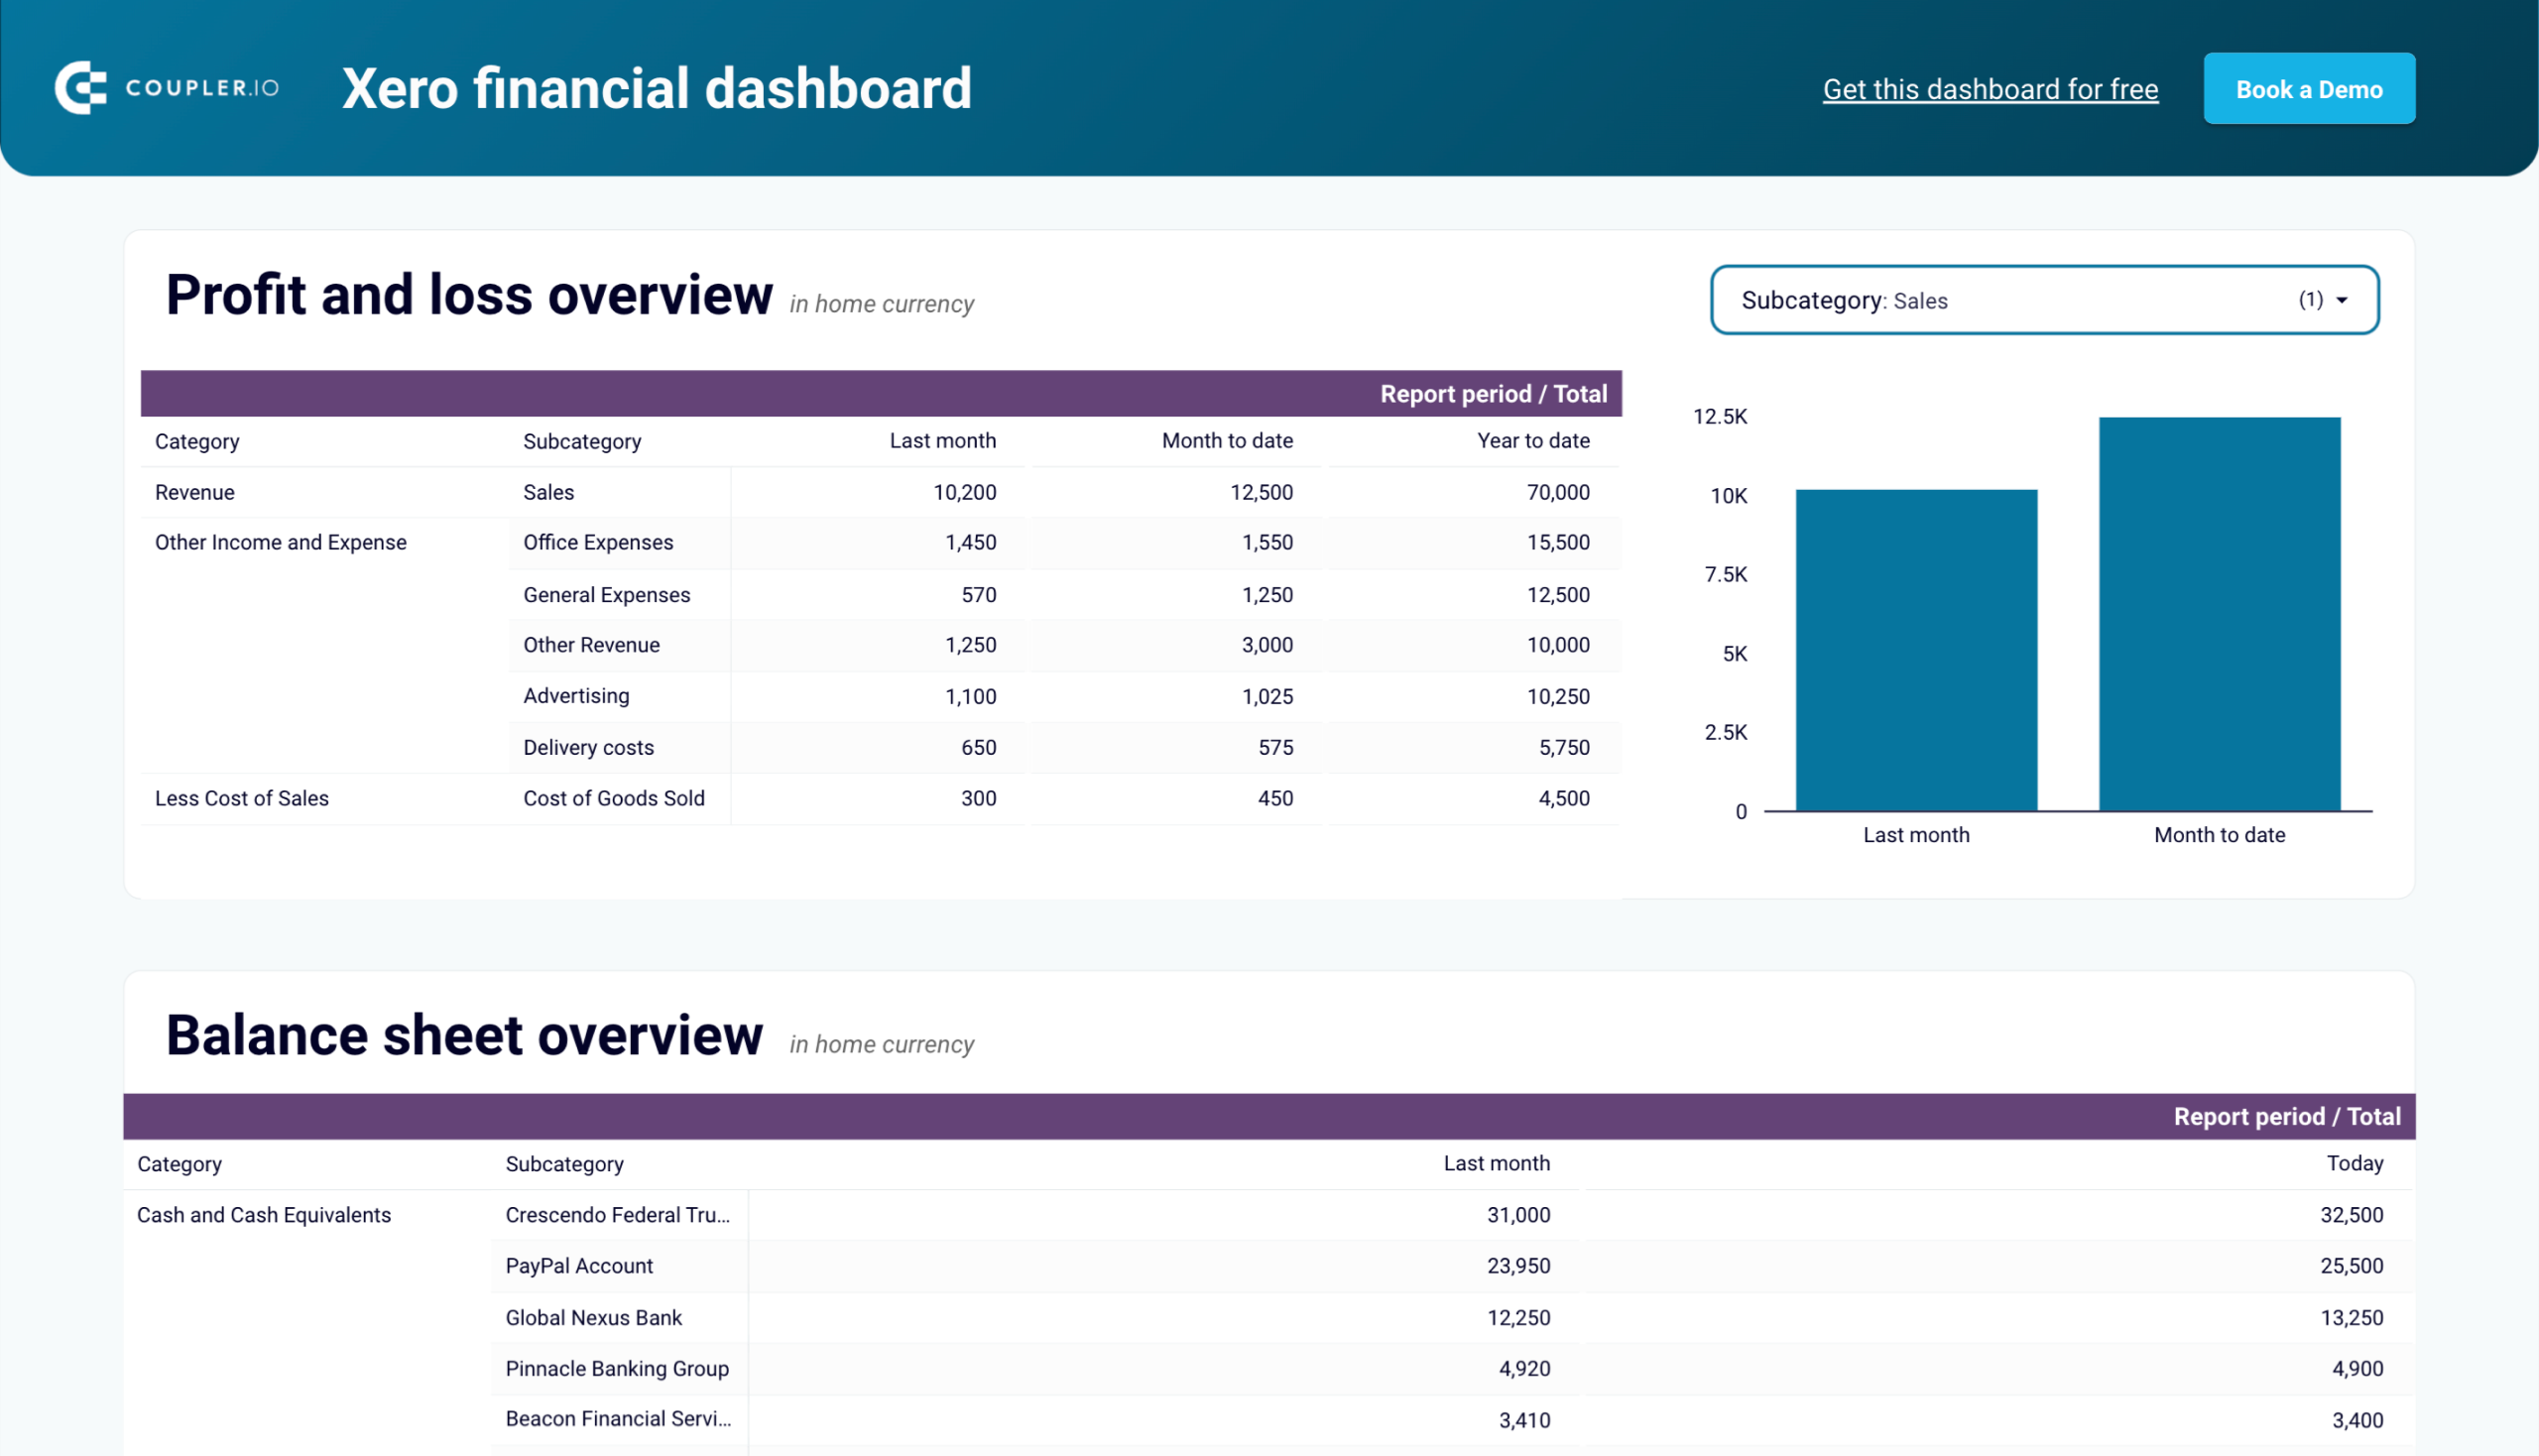
Financial dashboard for Xero
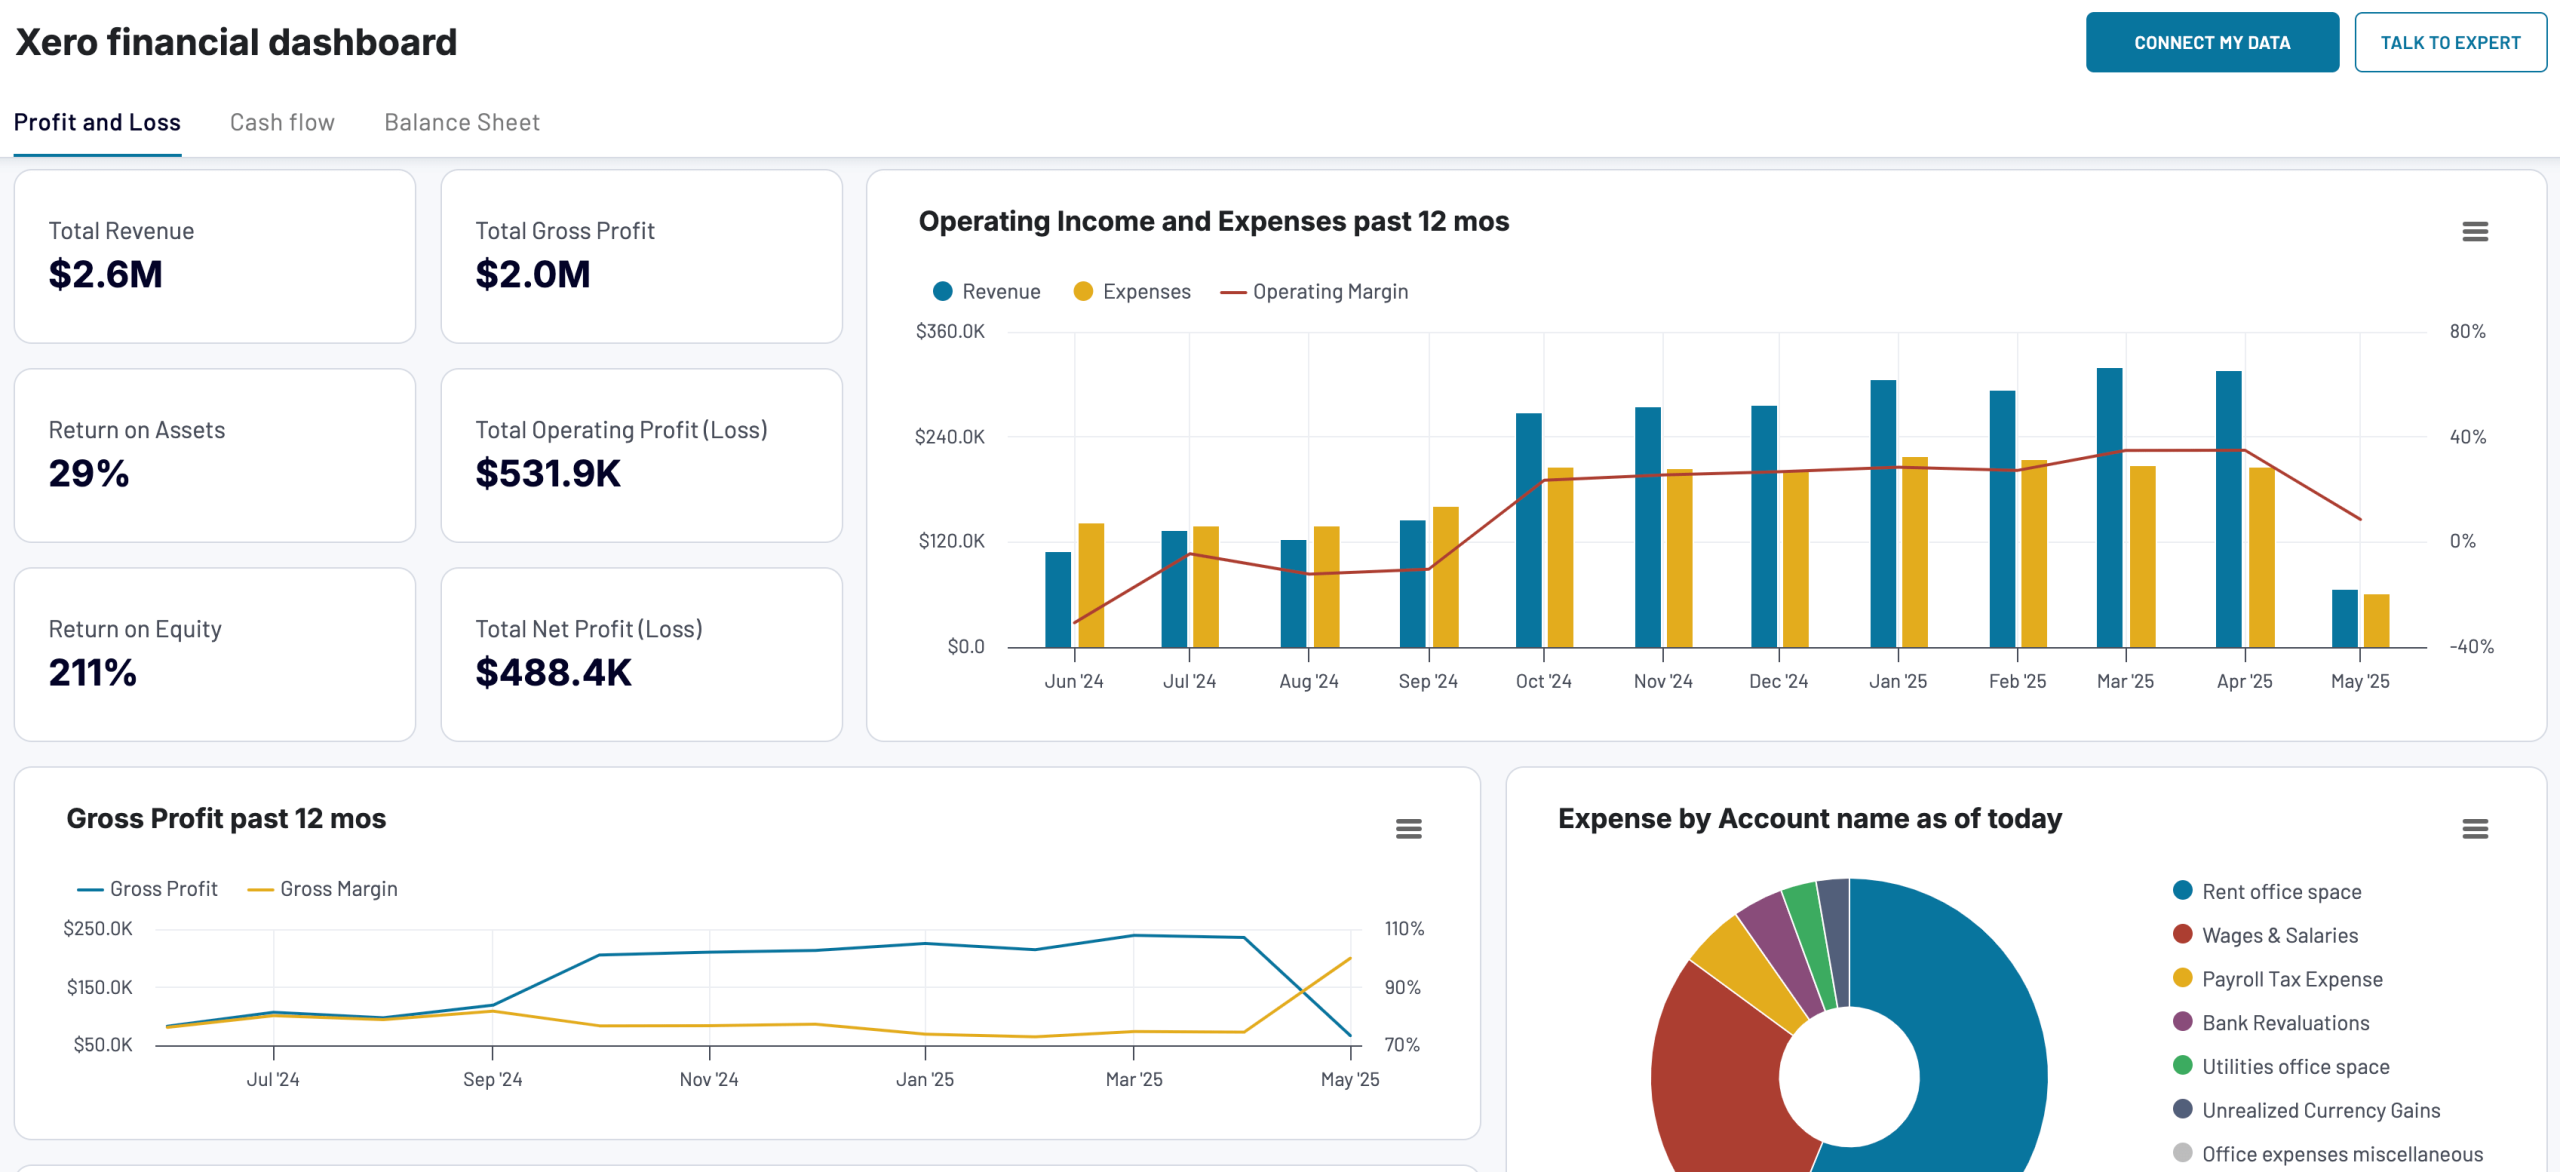
This dashboard loads data from your Xero account to provide you with the overall business financial performance. It shows details on profit and loss, balance sheet, cash flow, and other key indicators. This lets you explore your company’s financial health without diving deep into specific accounting procedures.
The dashboard allows you to
- Track your net income and expenses for the previous months and year to determine whether your business remains profitable over time.
- Check the current and long-term assets and liabilities to help you understand your business’s liquidity and financial health.
- Track the net cash changes over the reporting period to assess your financial stability and implement effective liquidity management.
You can use the dashboard in Coupler.io. It is also available as a template in Looker Studio and Google Sheets.
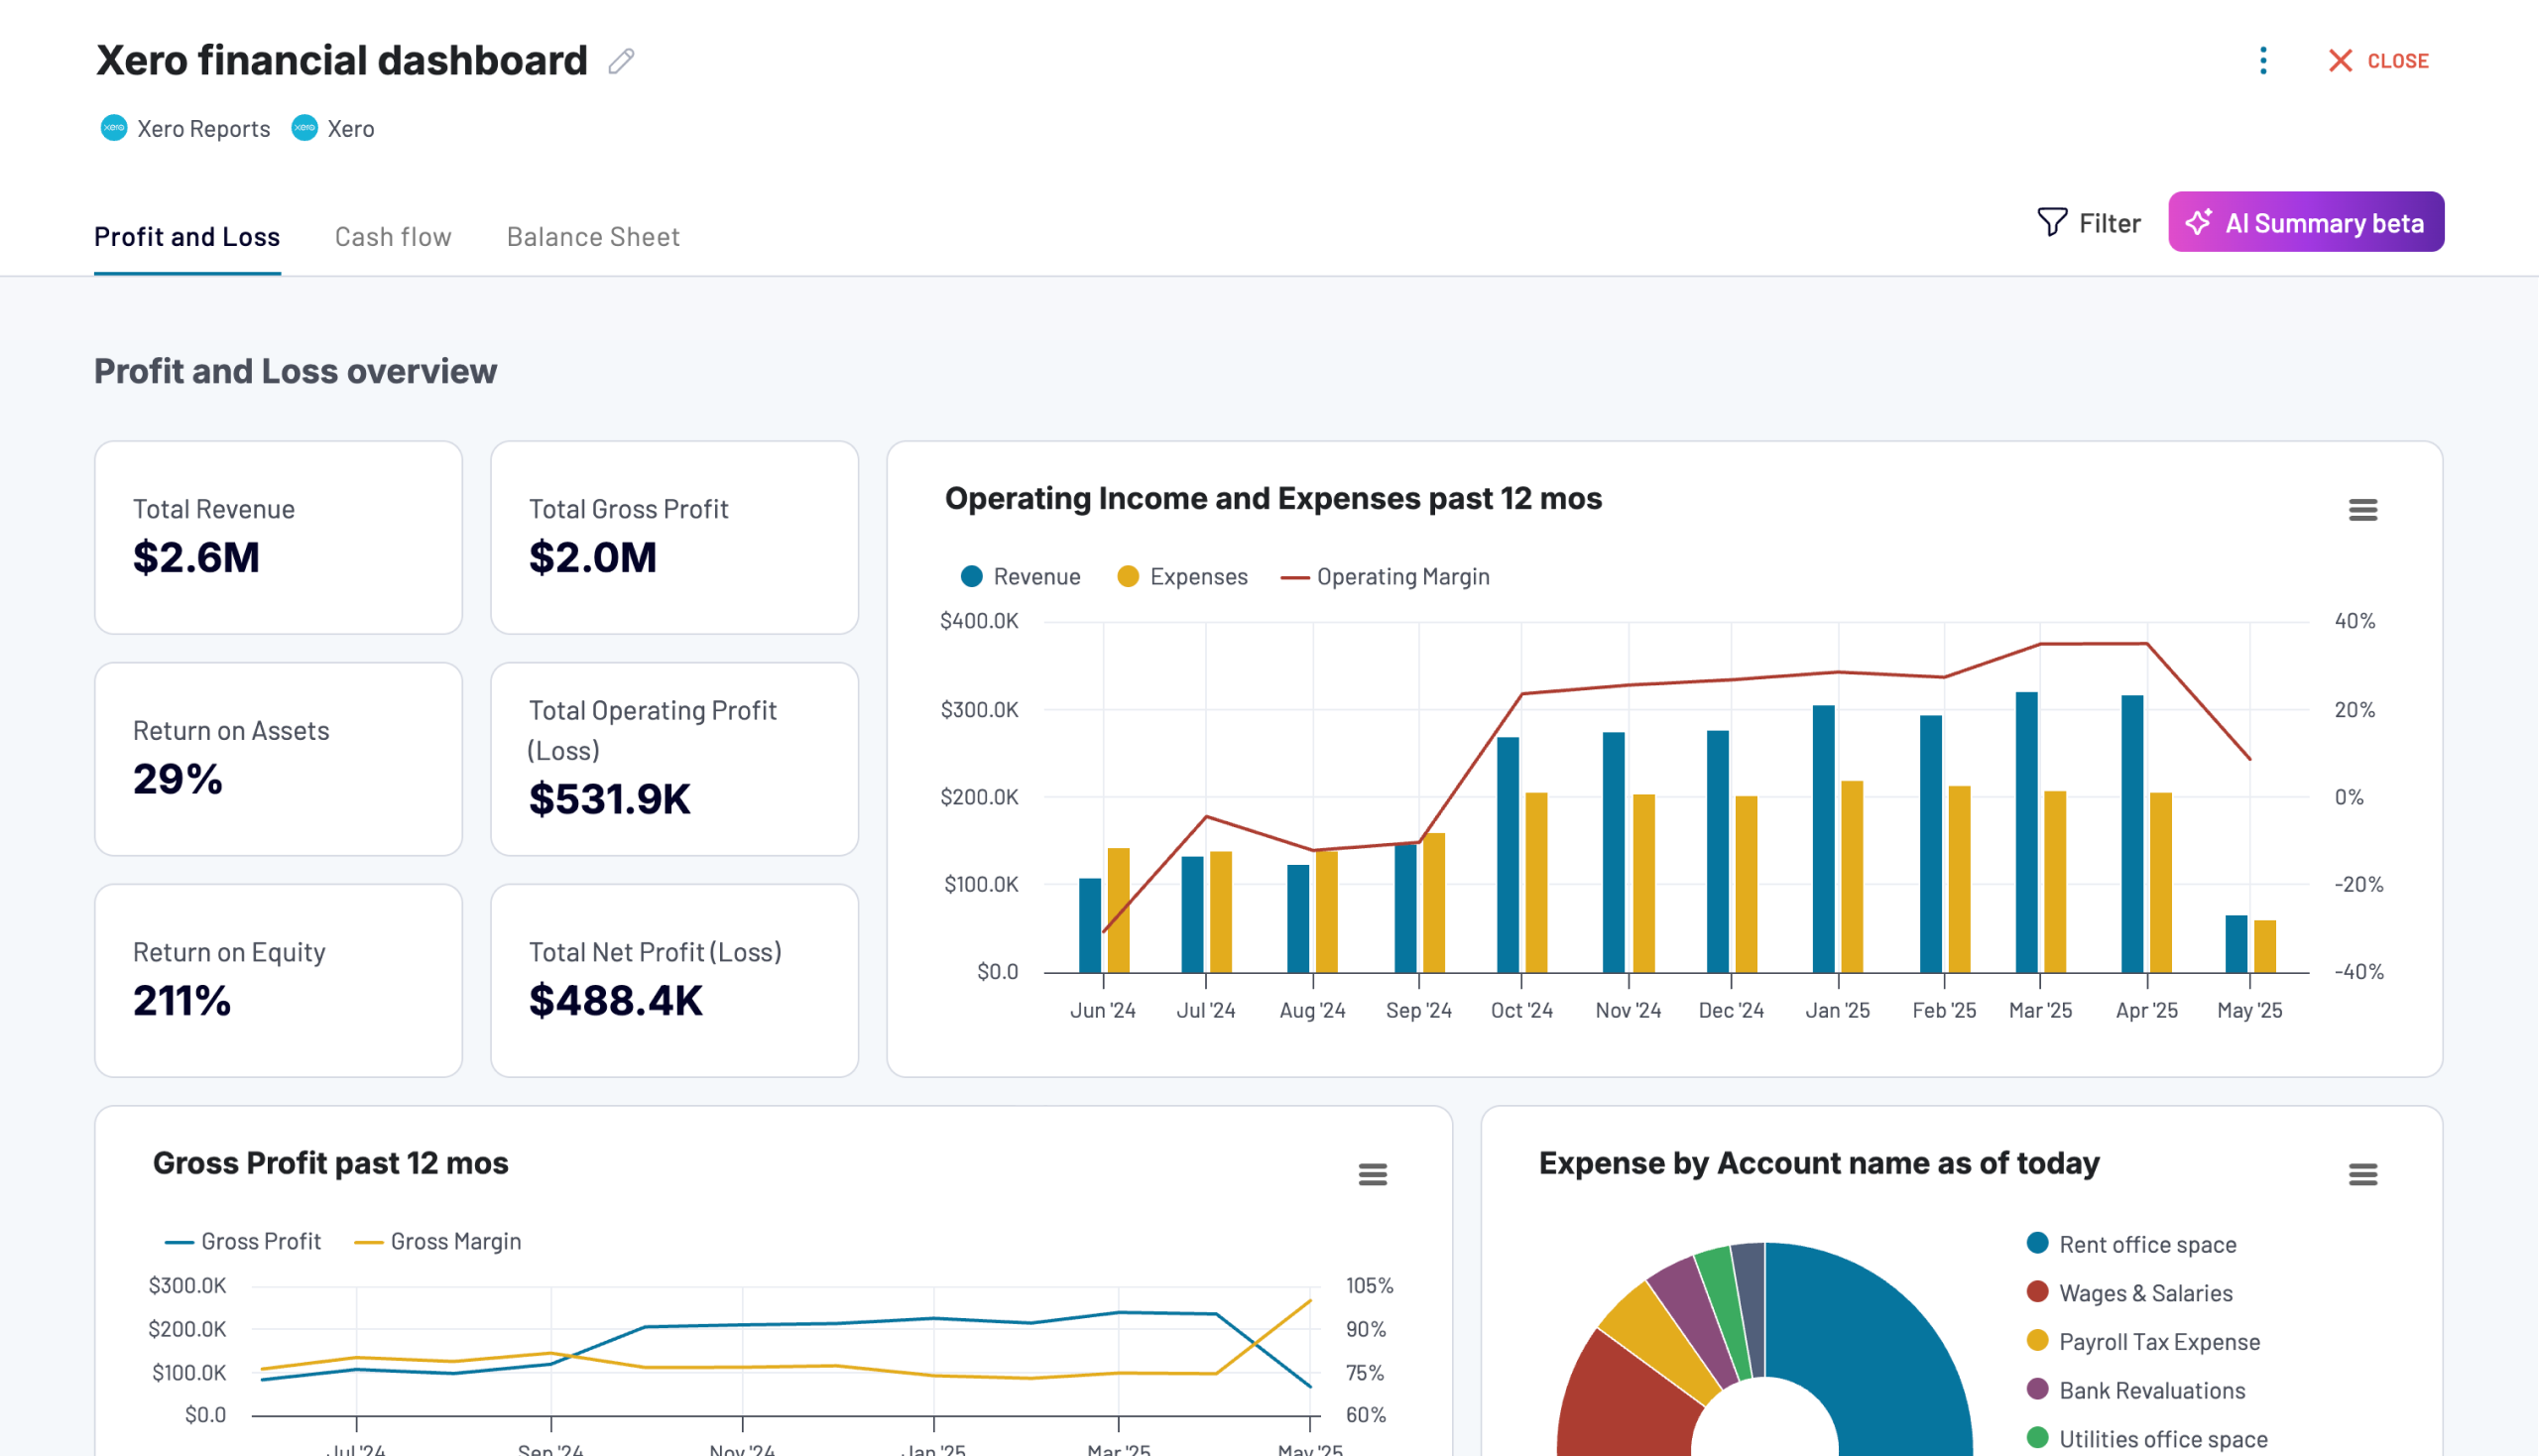
Xero financial dashboard
Get comprehensive financial insights from your Xero account with key performance metrics, balance sheet analysis, and cash flow projections. Quickly assess your business health and make informed financial decisions.
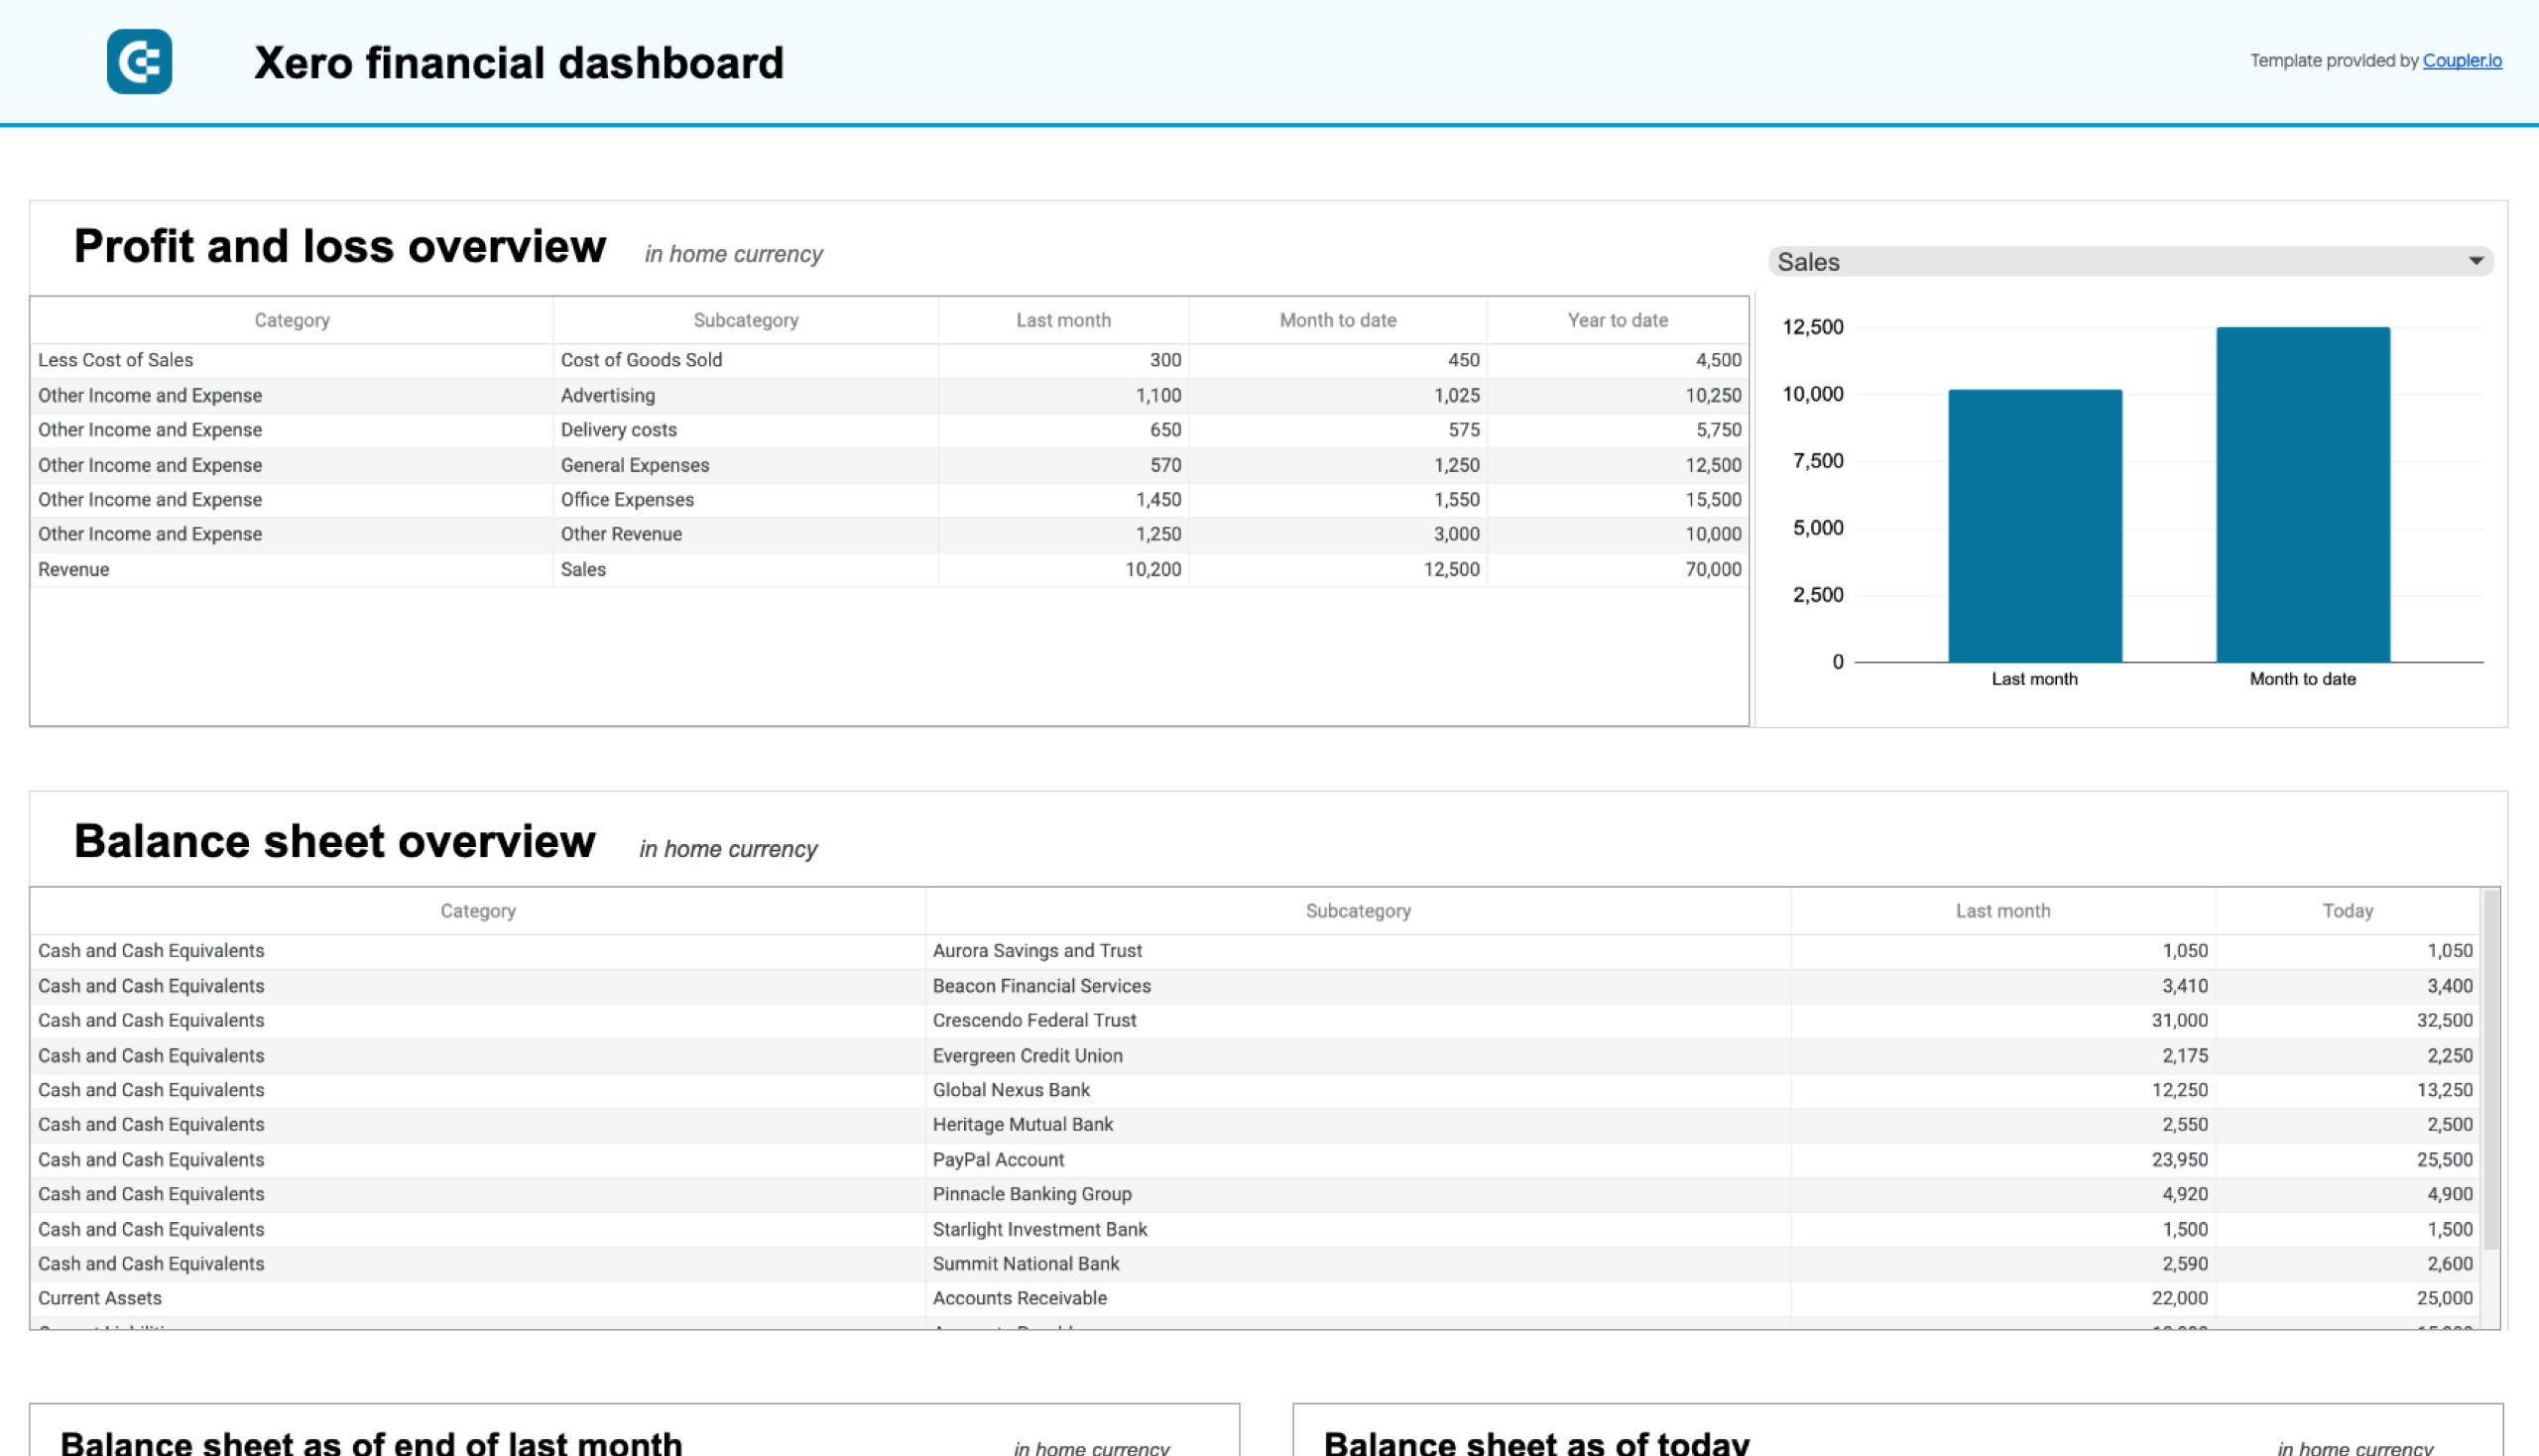
Xero financial dashboard in Looker Studio
Analyze your financial performance with a unified dashboard featuring key reports from Xero like cash flow, profit and loss, balance sheet, and others.
Xero financial dashboard in Google Sheets
Get instant visibility into your company’s financial health through key performance reports from Xero such as cash flow, income statement, and balance sheet.
Tips on how to read a P&L report for actionable insights
To make informed business decisions, it’s not enough to simply prepare a P&L – you also need to read and analyze it properly. Whether you’re a startup or an established company with steady profits, this helps you reveal both growth opportunities and inefficiencies. Here are five tips to unlock actionable insights from your profit and loss report. ?
1. Perform vertical and horizontal analysis
You can read your PnL report using vertical and horizontal analysis methods:
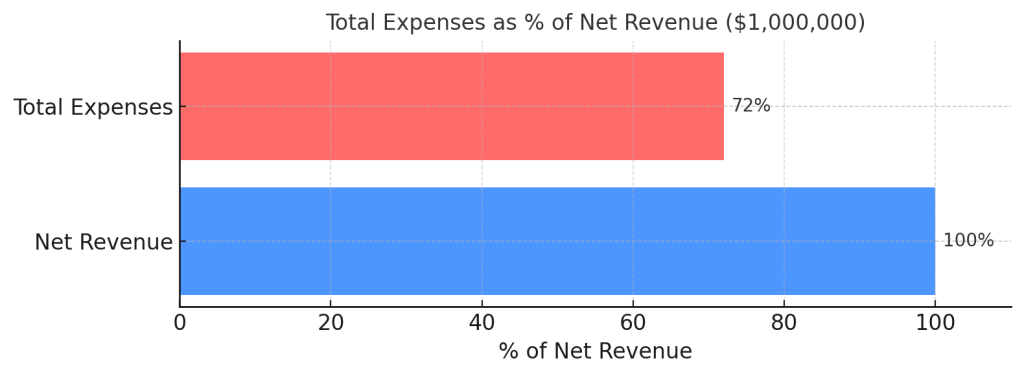
- Vertical analysis – simplifies the comparison of financial metrics and assesses how different items contribute to your bottom line. Here, you explore line items – e.g., total expenses – as a percentage of a base figure, such as net revenue. In our example, this lets you understand how much of your earnings are being used for costs.

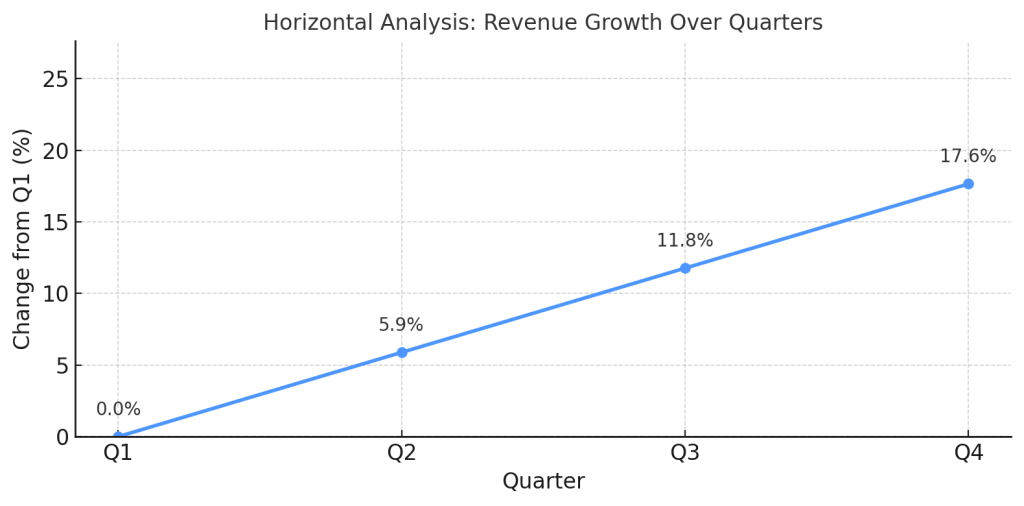
- Horizontal analysis – tracks changes over time, compares financial data across multiple periods, and identifies growth patterns, trends, and anomalies. For instance, you could analyze the revenue increase between quarters and observe consistent growth or seasonal variations.

Combining these two analysis methods allows you to capture the complete picture of your financial health.
2. Focus on revenue vs. net profit
There are two core metrics you should prioritize in your analysis, depending on your business type – either revenue or net profit.
If you’re running a venture-backed company, such as a startup or a high-growth business, your goal is to scale revenue and track the success of product development or customer acquisition. In that case, revenue analysis is crucial.
On the other hand, if you’re operating a profit-generating business, it’s self-explanatory that profitability is more important than revenue growth. In this scenario, you need to monitor that revenue is not being offset by high operating costs, making net profit the center of attention.
In either case, tracking month-over-month (MoM) changes is essential to understand how financial metrics evolve, identify short-term trends, and recognize operational issues. Here’s how it could look:
| Business type | Positive insight | Operational issue detected |
| Venture-backed company | Revenue grew 20.8% MoM (indicating strong customer acquisition). | Still at a net loss of $22,000 (high burn rate). |
| Profit-generating business | Net profit increased by 20.8% MoM (reflecting improved efficiency). | High operating expenses – $73,500 (potential constraint on future growth). |
3. Compare planned and actual performance
To identify where you’ve under- or overperformed relative to your financial goals, compare actual results to your planned or budgeted figures. This comparison reveals important gaps between expectations and reality.
For example, if you budgeted $500,000 in quarterly revenue but only achieved $450,000, this $50,000 shortfall signals a potential need to adjust your sales strategy or marketing efforts. Look deeper to understand which specific departments or initiatives missed their targets and why.
Don’t focus solely on negative deviations; positive ones can also provide valuable insights. Imagine your marketing budget was $50,000, but you only spent $40,000, yet still achieved strong sales growth. This could indicate that your campaign was more efficient than predicted. In such a scenario, your task would be to determine whether additional investments in high-performing areas could yield even better results.
4. Track key financial ratios
A range of financial ratios is necessary for assessing your company’s profitability and sustainability. These include gross profit margin, net profit margin, and earnings per share (EPS). ?
Gross profit margin
To indicate how efficiently your company produces goods or services relative to its sales, calculate your gross profit margin. It is calculated as:
Gross profit margin = (Gross profit ÷ Net revenue) × 100
For example, if you have $431,245 in net revenue and $355,899 in gross profit, the gross profit margin would be:
(355,899 ÷ 431,245) × 100 = 82.5%
This suggests that your company is successfully managing production costs.
Net profit margin
To reflect how much of each dollar of revenue is converted into profit after all expenses, determine your net profit margin. The formula is:
Net profit margin = (Net profit ÷ Net revenue) × 100
Suppose the net profit is $113,101 and the net revenue is $431,245. In this case, the net profit margin would be:
(113,101 ÷ 431,245) × 100 = 26.2%
Then, compare this to industry standards to help assess business efficiency.
Earnings per share
If you’re a public company, you should calculate earnings per share (EPS) to determine the amount of profit allocated to each share of stock. This is a key metric that investors closely track, as it reflects company profitability on a per-share basis.
There are two common types of EPS: basic and diluted.
Basic EPS
This is based on the current number of outstanding shares. You can calculate it using the formula:
EPS = Net profit ÷ Number of outstanding shares
Let’s say your net profit is $113,101, and you have 224,000 shares. The basic EPS would be:
EPS = 113,101 ÷ 224,000 = $0.50
Diluted EPS
Unlike basic earnings per share, this metric accounts for the potential impact of convertible securities, such as stock options or convertible debt. These could increase the total share count and reduce the EPS. The formula is:
Diluted EPS = Net profit ÷ (Outstanding shares + Convertible shares)
Suppose you have 16,000 potentially dilutive shares in addition to the 224,000 outstanding shares. The diluted EPS would be:
Diluted EPS = 113,101 ÷ (224,000 + 16,000) = 113,101 ÷ 240,000 = $0.47
5. Plan for the next period and adjust your strategy
Now that you understand your past performance, use the insights from your P&L analysis report to guide future planning, forecast financials, and adjust budgeting. Here’s what to do:
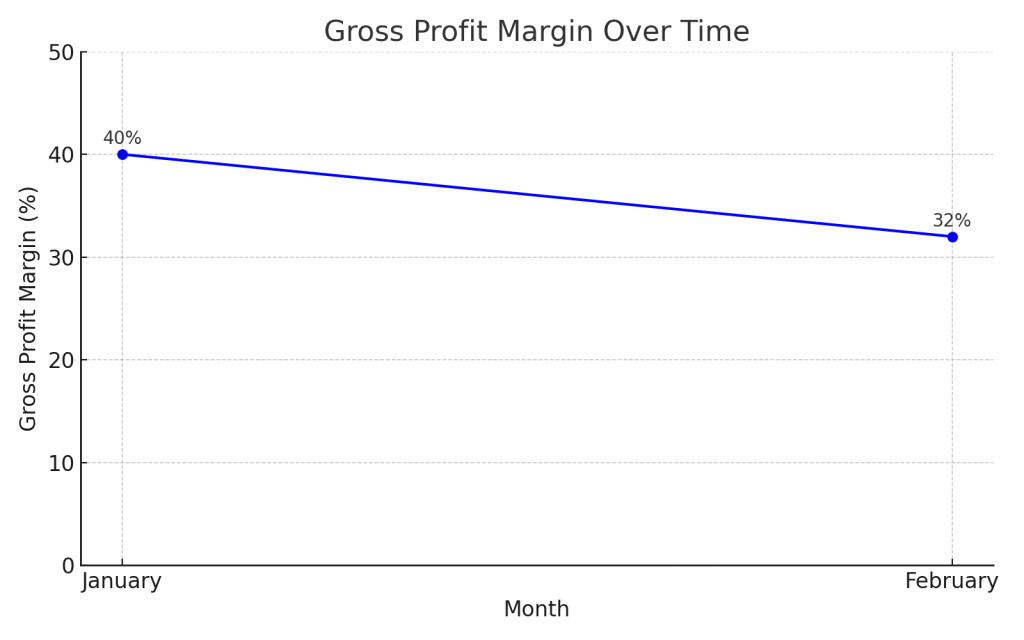
Monitor KPIs monthly
For example, let’s consider gross profit margin. Imagine it is 40% in January and drops to 32% in February. If so, investigate the reasons, such as increased cost of goods sold, and take corrective actions.

Adjust the budget based on your data, market shifts, and goals
Suppose you allocated $10,000 for digital marketing in Q1, expecting a $50,000 revenue increase. However, after two months, revenue only rose by $20,000. In this case, you might reduce your marketing budget and reallocate funds to a more profitable channel like direct sales.
To help predict your expenses, use report templates such as the advertising budget forecast dashboard by Coupler.io. It allows you to project chosen metrics, such as amount spent, impressions, or clicks, for a specific period based on historical data.
Advertising budget forecast dashboard in Google Sheets

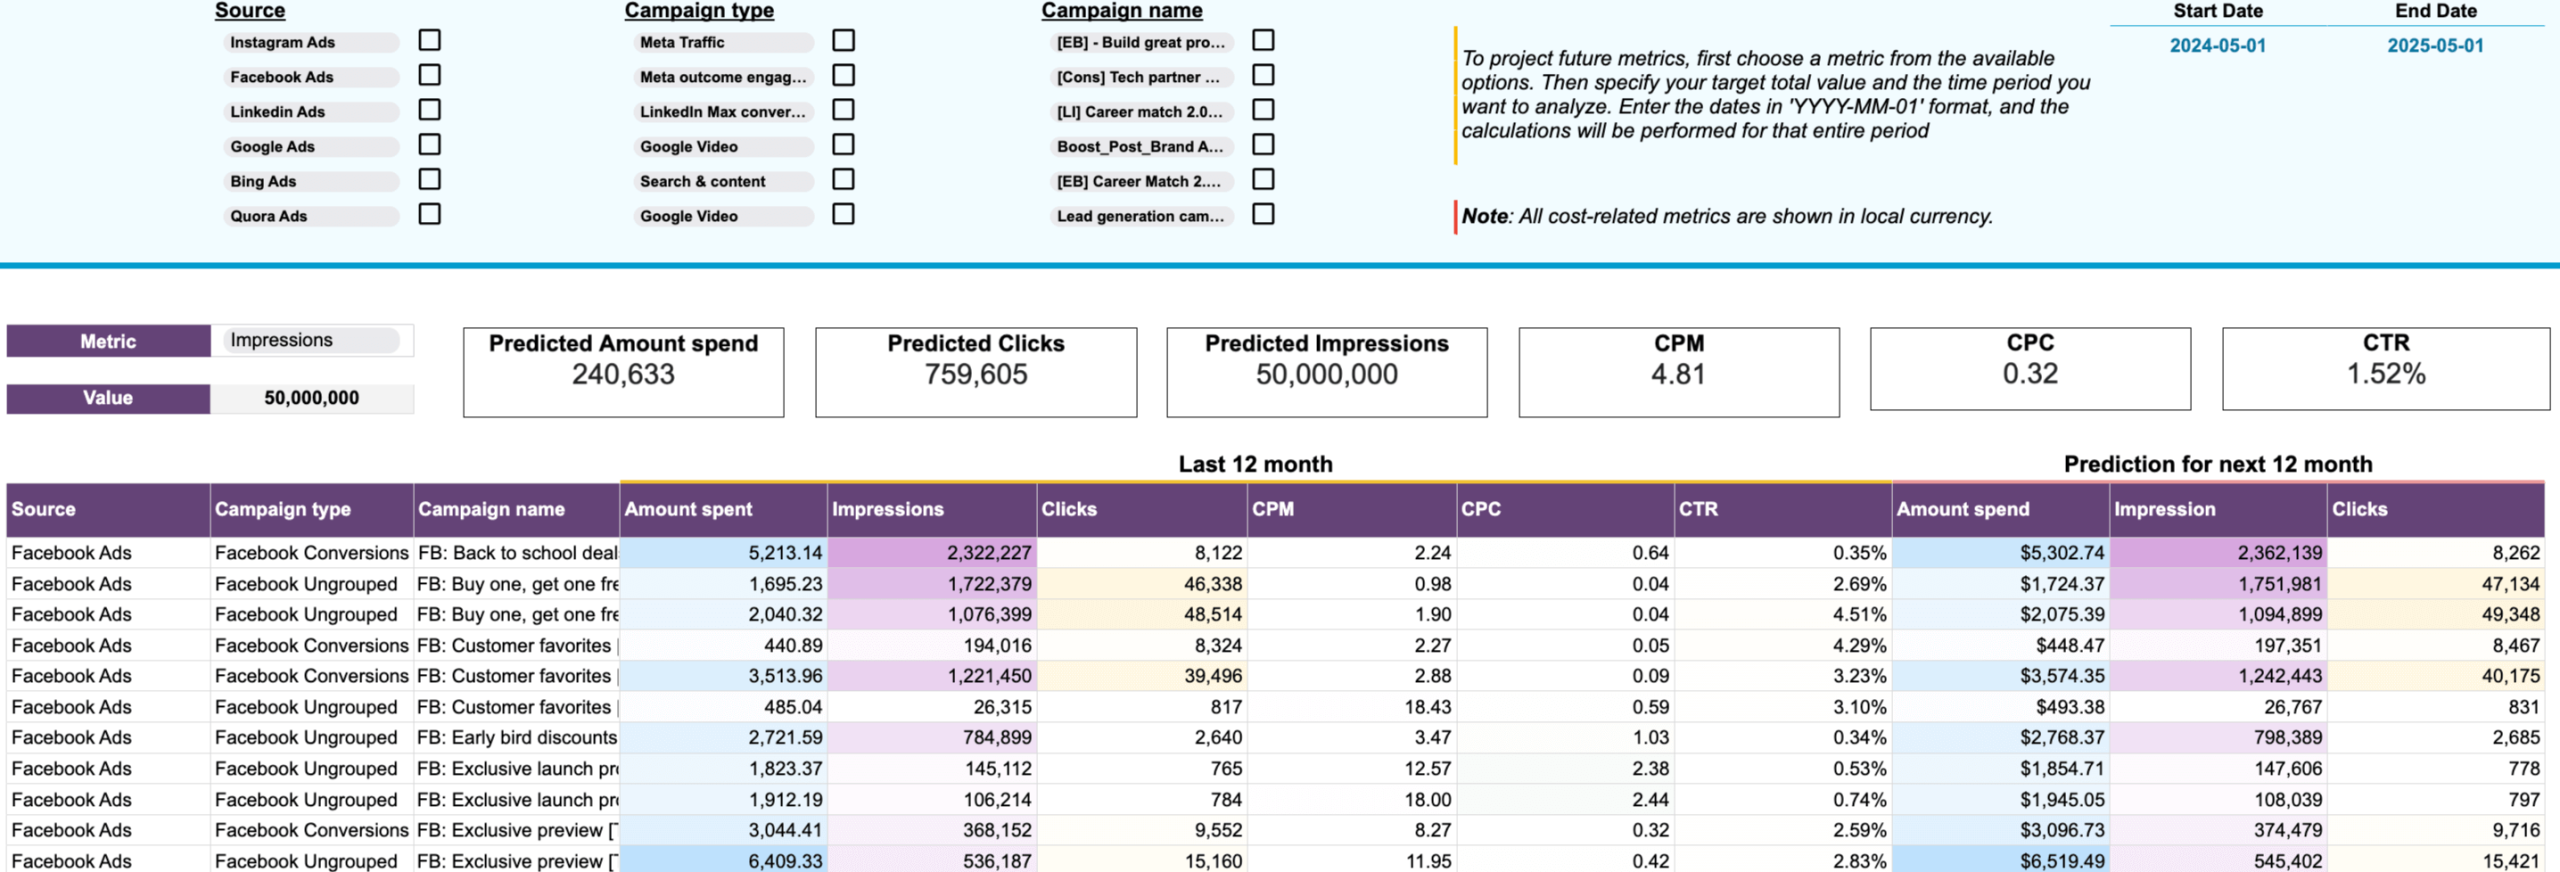
Advertising budget forecast dashboard in Google Sheets
Preview dashboardThe dashboard aggregates data from Facebook, Instagram, LinkedIn, Google, Microsoft, TikTok, X, and Quora Ads. To set it up in Google Sheets, refer to the Readme instructions provided in the template.
Ensure targets align with operational capabilities and market conditions
Let’s say market demand supports selling up to 500 units per month, and your business can only produce that amount. If so, a sales goal of 1,000 units without expanding production capacity or verifying additional demand would be unrealistic. Instead, set a target of 450 units with a stretch goal of 500, based on current production limits and what the market can actually absorb.
After financial planning,?? the next step is again analyzing actual performance through a PnL report. To prepare it quickly and easily, use Coupler.io, which allows you to automatically pull data from accounting and billing systems, perform all calculations in one place, and load the report into spreadsheets or BI tools on schedule.
Try Coupler.io for free and save hours on profit and loss reporting!
Automate reporting with Coupler.io
Get started for free