Accountants use professional jargon and complex terms in their day-to-day work. However, they need to present their financial analysis results to executives in a clear and understandable manner.
Reports in QuickBooks can be a good option for this, but they don’t provide a thorough enough overview of financial performance. Instead, it’s better to use easy-to-configure and auto-updated QuickBooks report templates that provide transparent insights to your stakeholders.
Top 5 Intuit QuickBooks report templates
We’ve collected the best 5 report templates that will let you convert raw financial data from QuickBooks Online into clear and easily displayable findings.
Revenue dashboard for QuickBooks
This revenue dashboard template helps you monitor your income and expenses and also shows the revenue distribution by customers and products. It is beneficial for financial departments and executives as it depicts key revenue metrics, lists top customers, and displays best-selling products.
QuickBooks revenue dashboard + AI insights

QuickBooks revenue dashboard + AI insights
Preview dashboardWhat insights does the dashboard provide?
This dashboard template consists of several different reports, each of which provides valuable insights:
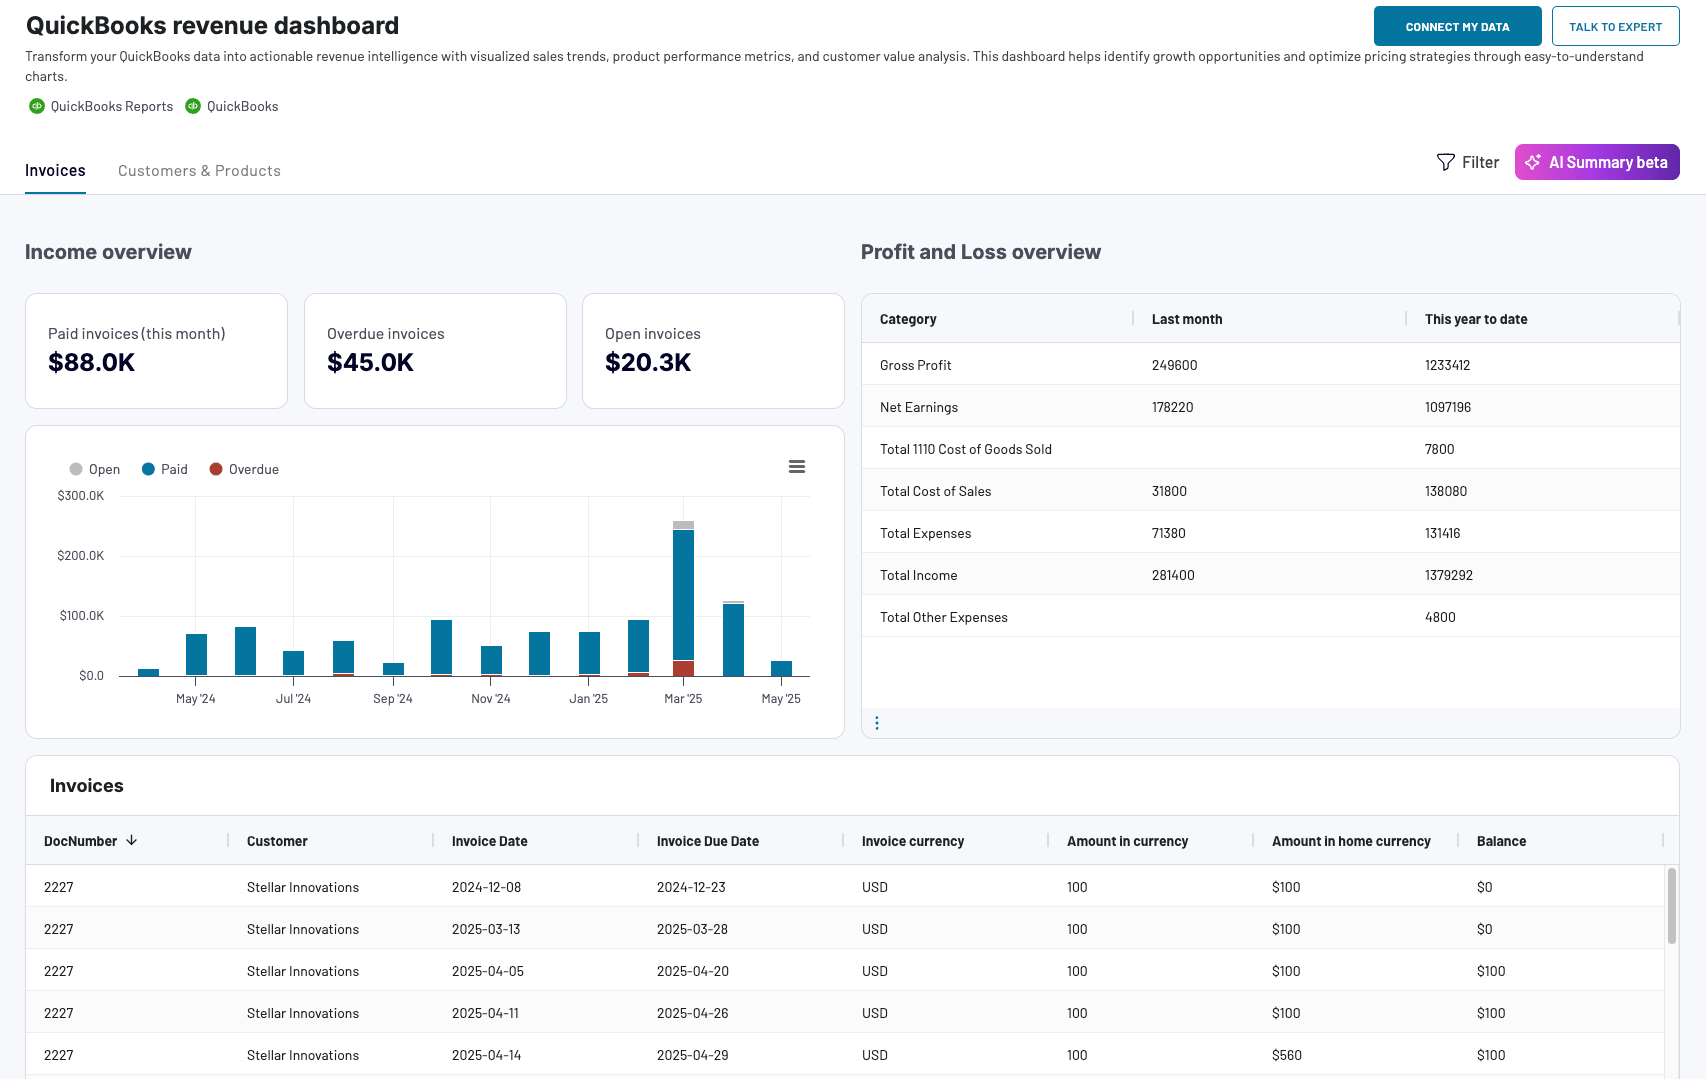
- Income Overview. The visual summary of paid and unpaid invoices helps you understand the amount received from customers, the amount they still owe, and currently open invoices. You can see how these numbers correlate and explore the general invoice coverage trends.
- Profit and Loss Overview. The net profit for the previous month and for the current year depicts whether your business is profitable or not. With this P&L dashboard, you can also observe total expenses for the same periods and see how they correlate with net income, gross profit, and total income.
- Customer Overview. This report displays the total revenue generated for the current year and provides a detailed breakdown of revenue for each customer. You can evaluate our customers and build more effective collaboration strategies.
- Product Overview. This shows the products along with their associated revenue, the number of items sold, and pricing for each. It helps you identify which items generate the most income and which are the best-selling products. So, you can understand your customers’ purchasing habits, refine your marketing campaigns, and adjust product development cycles.
- Invoices. Explore all the invoices along with their associated details (number, customer, amount, date, due date, last updated date, payment status).
How to use the report template
You can use the dashboard in Coupler.io and benefit from faster performance and a built-in AI insights feature. It’s also designed as a template for external tools, such as Looker Studio, Google Sheets, and Power BI. Each includes step-by-step instructions for setup. It only takes a couple of minutes to configure the QuickBooks Online connector and load data in the auto-refreshing dashboard of the preferred BI app.
QuickBooks revenue dashboard
Transform your QuickBooks data into actionable revenue intelligence with visualized sales trends, product performance metrics, and customer value analysis. This dashboard helps identify growth opportunities and optimize pricing strategies through easy-to-understand charts.


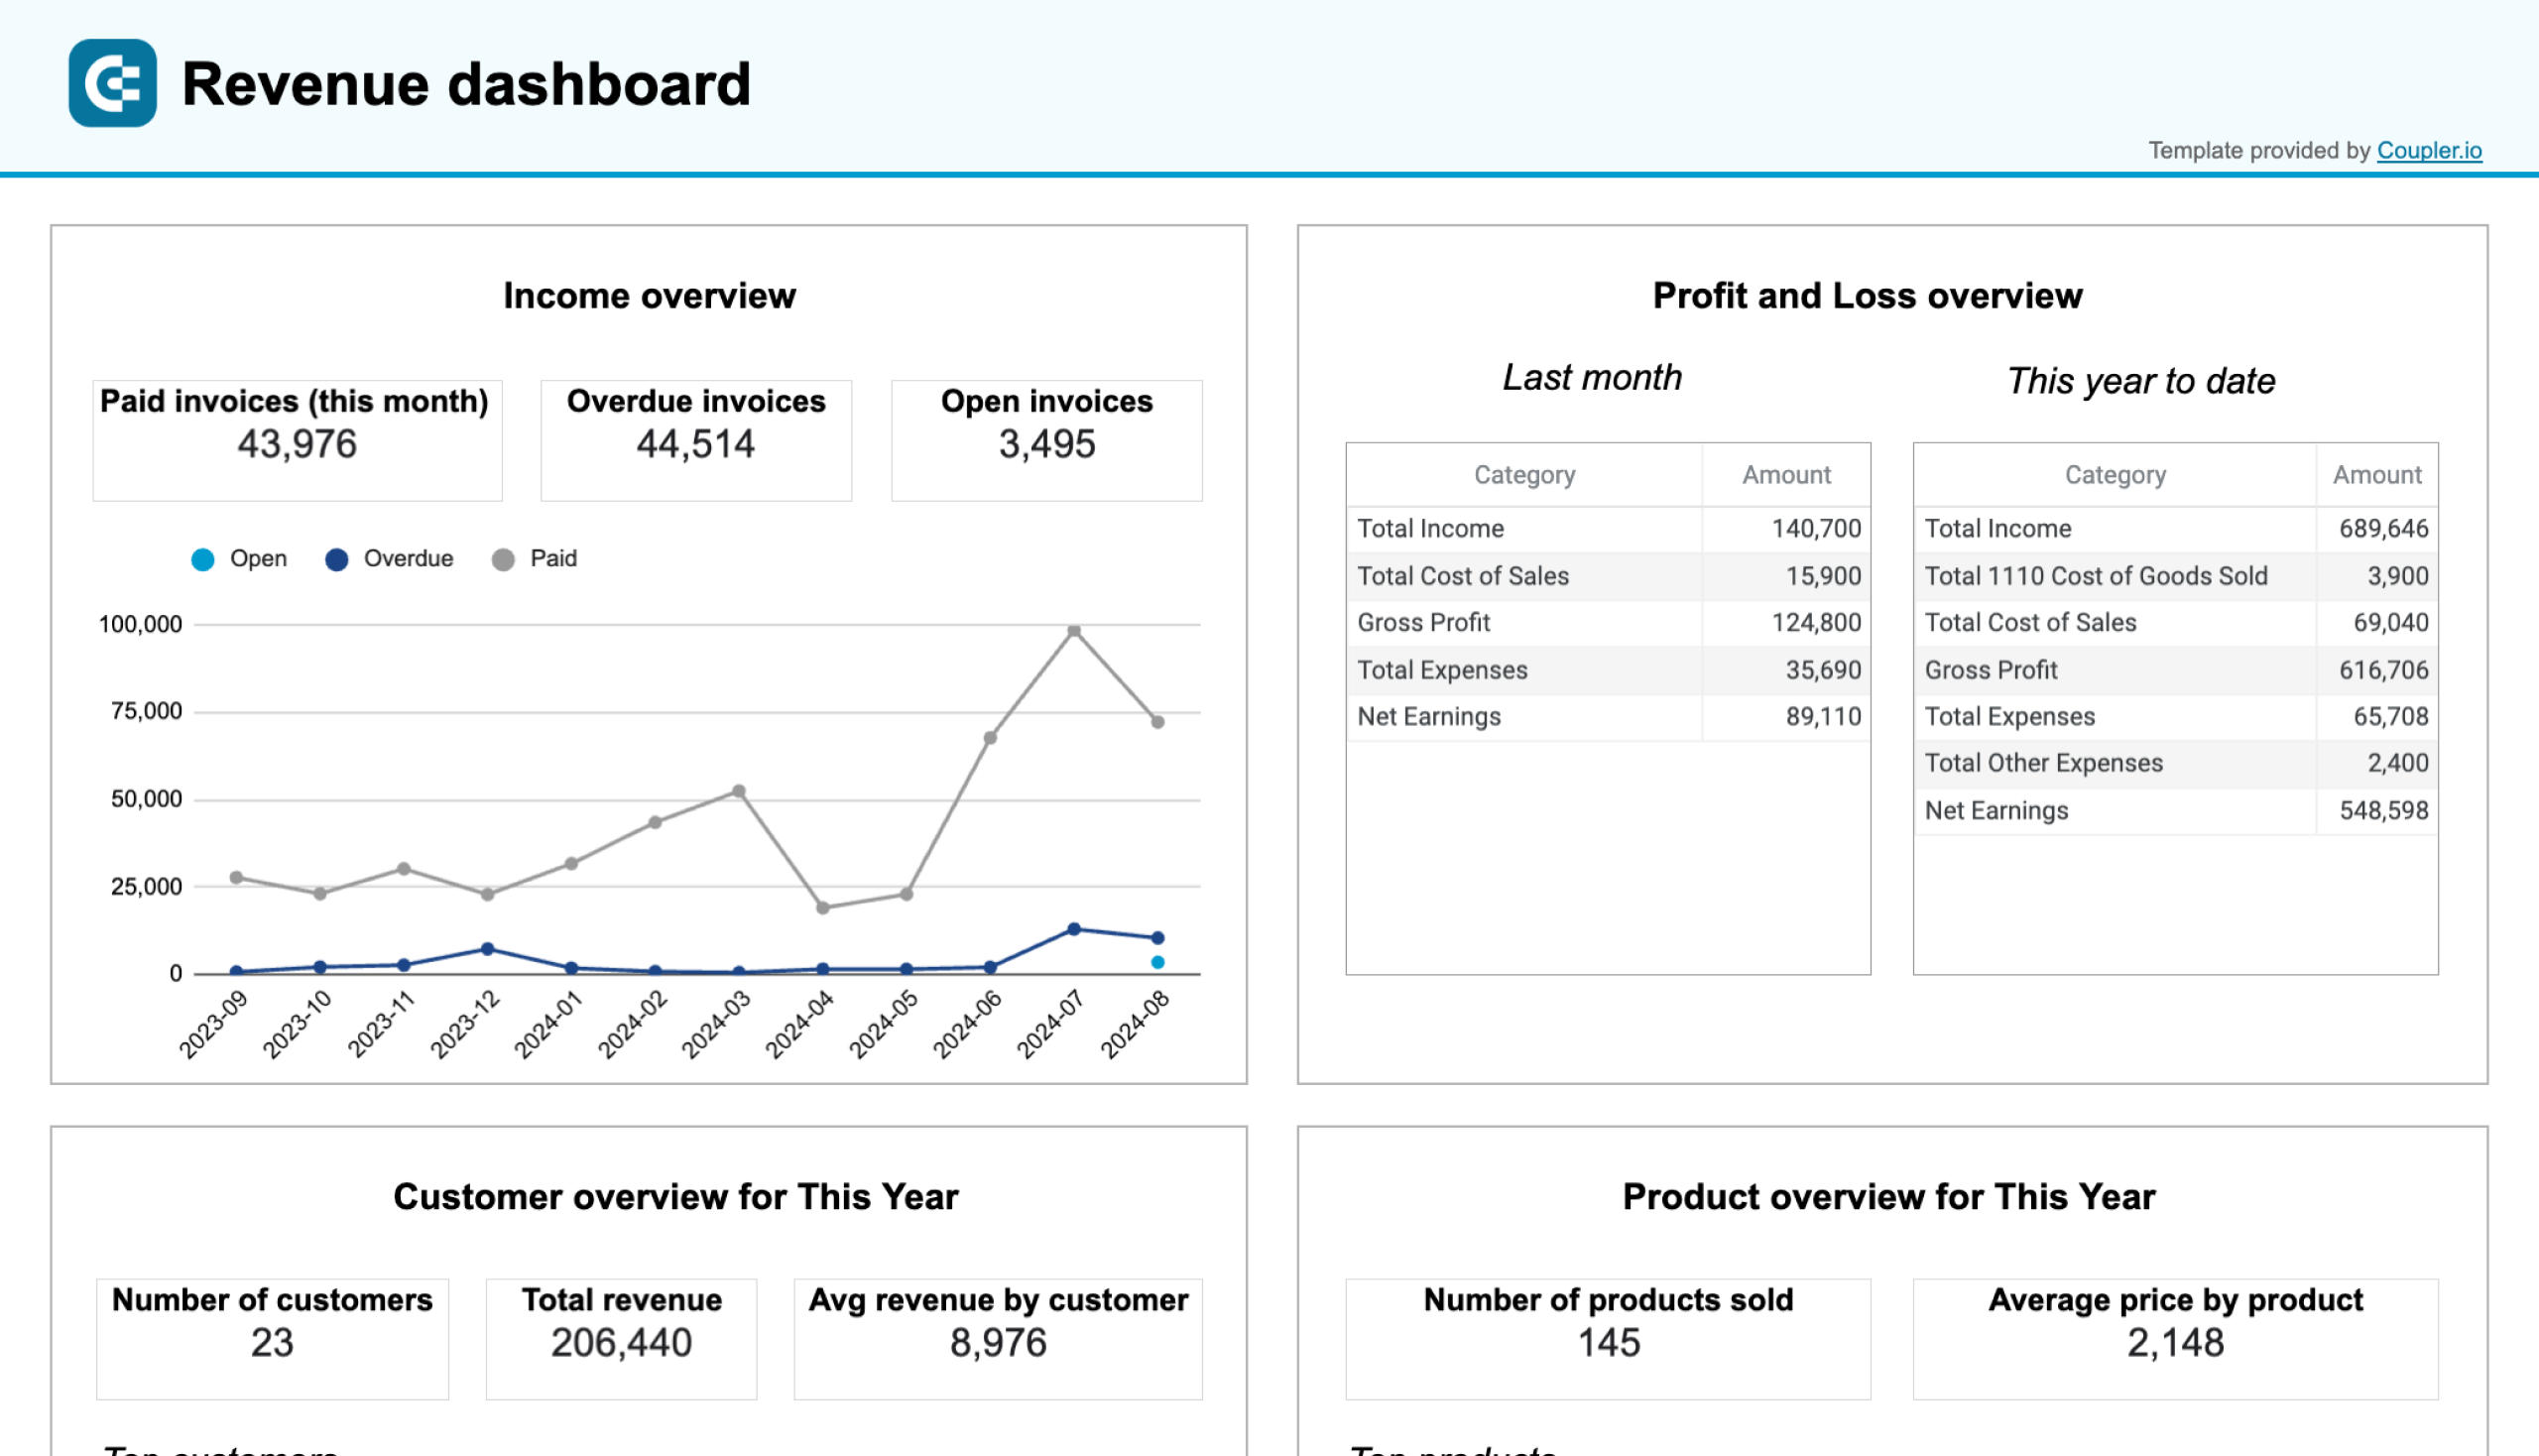
QuickBooks revenue dashboard in Google Sheets
Analyze your revenue through a set of reports collected from QuickBooks Online on a single dashboard.

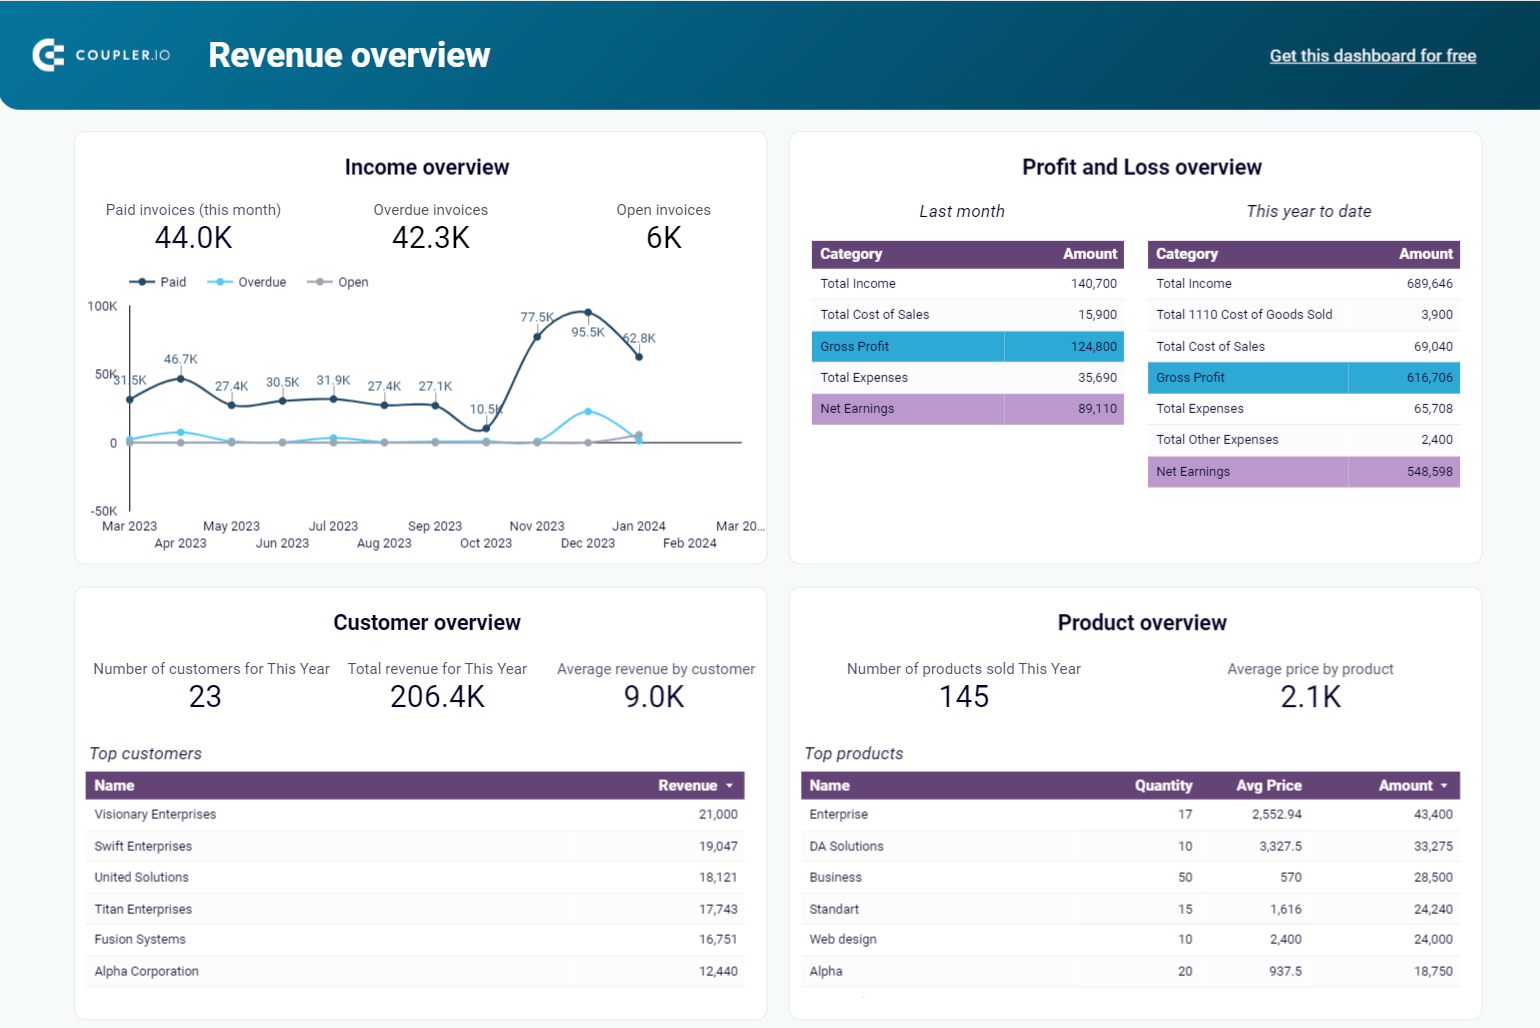
QuickBooks revenue dashboard in Looker Studio
Get an overview of your revenue based on the data from QuickBooks and unlock in-depth insights to drive informed business decisions.

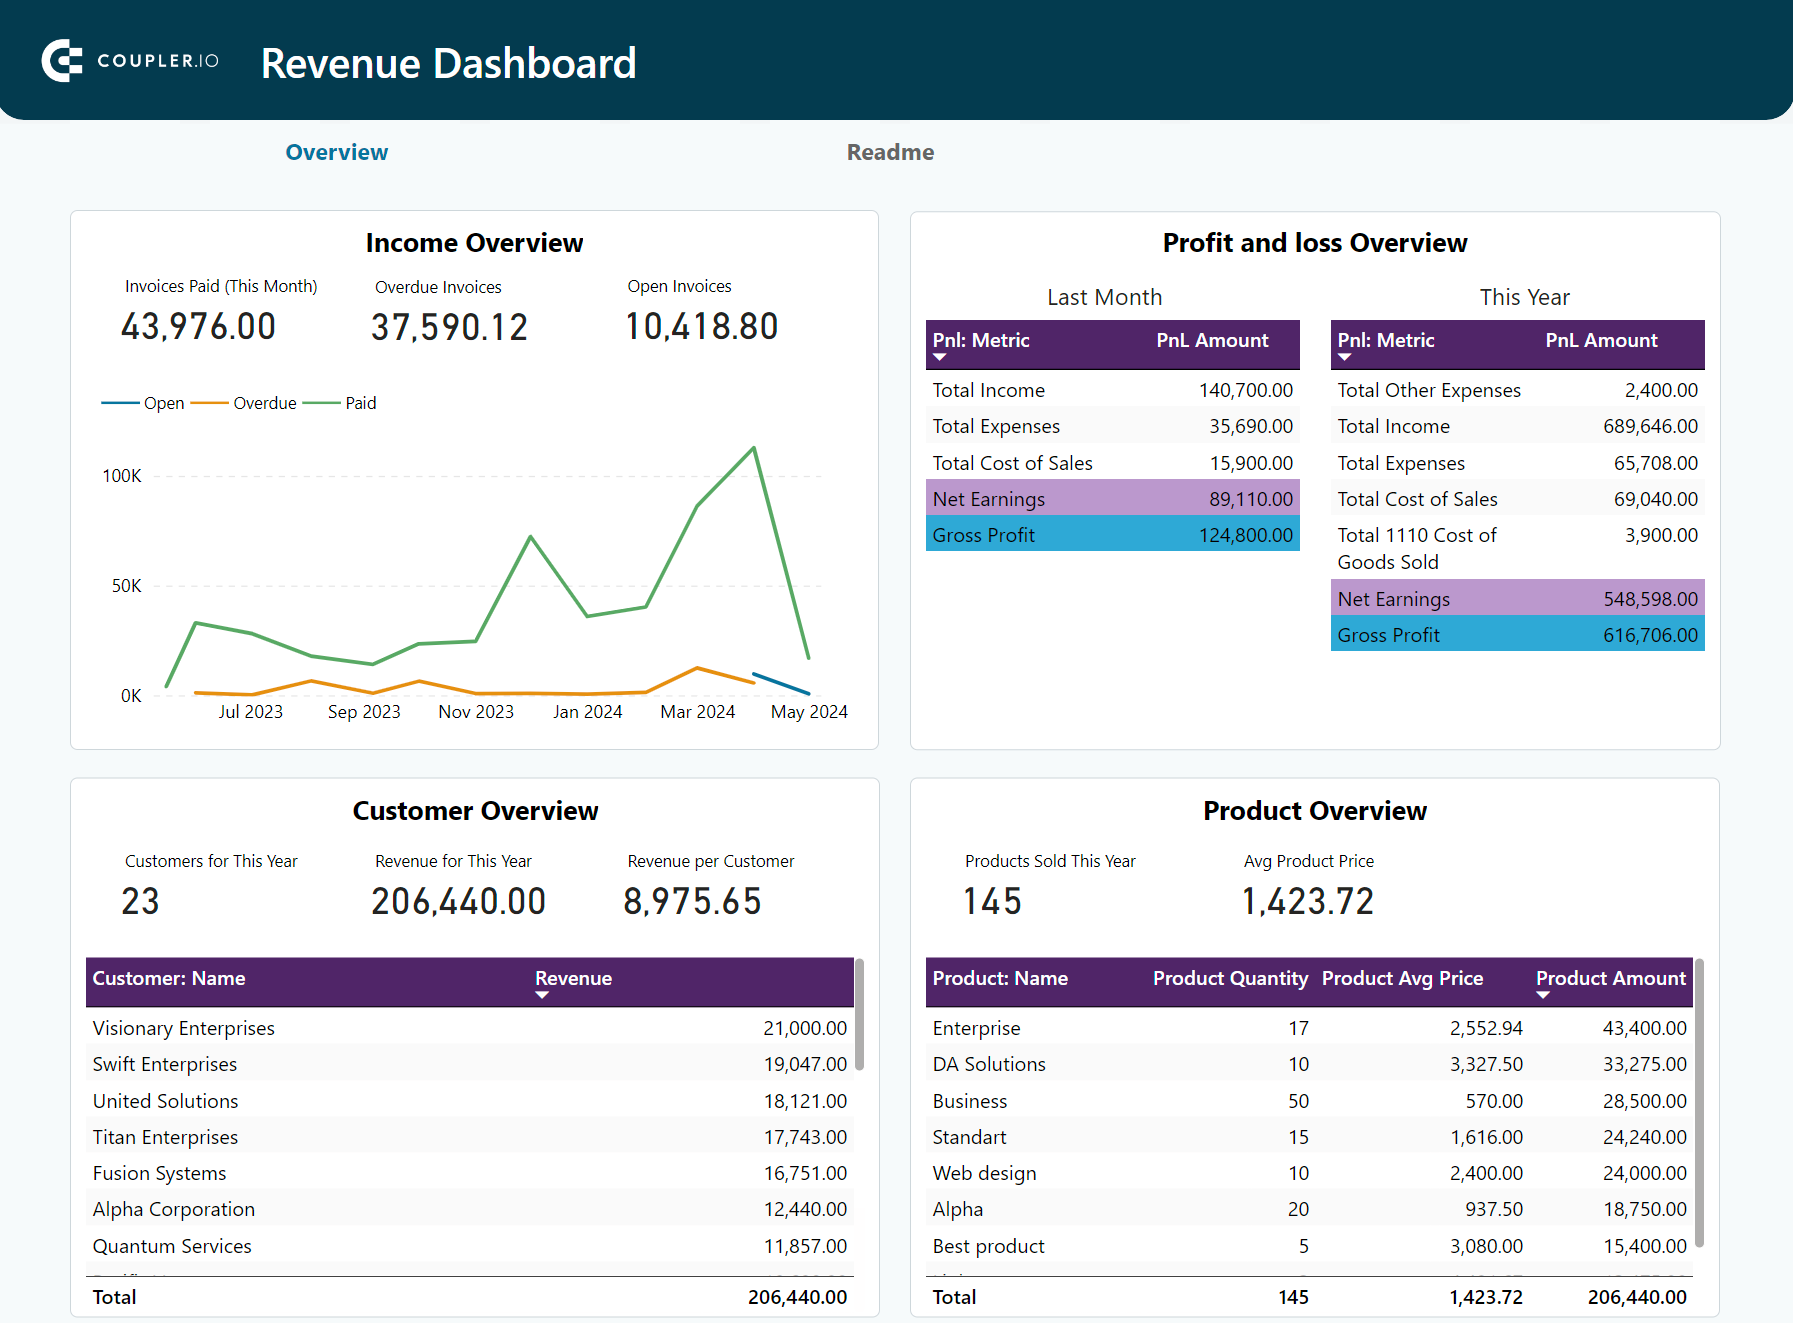
QuickBooks revenue dashboard in Power BI
Monitor your income and expenses on an all-in-one revenue dashboard connected to your QuickBooks Online account.
Accounts receivable QuickBooks report template
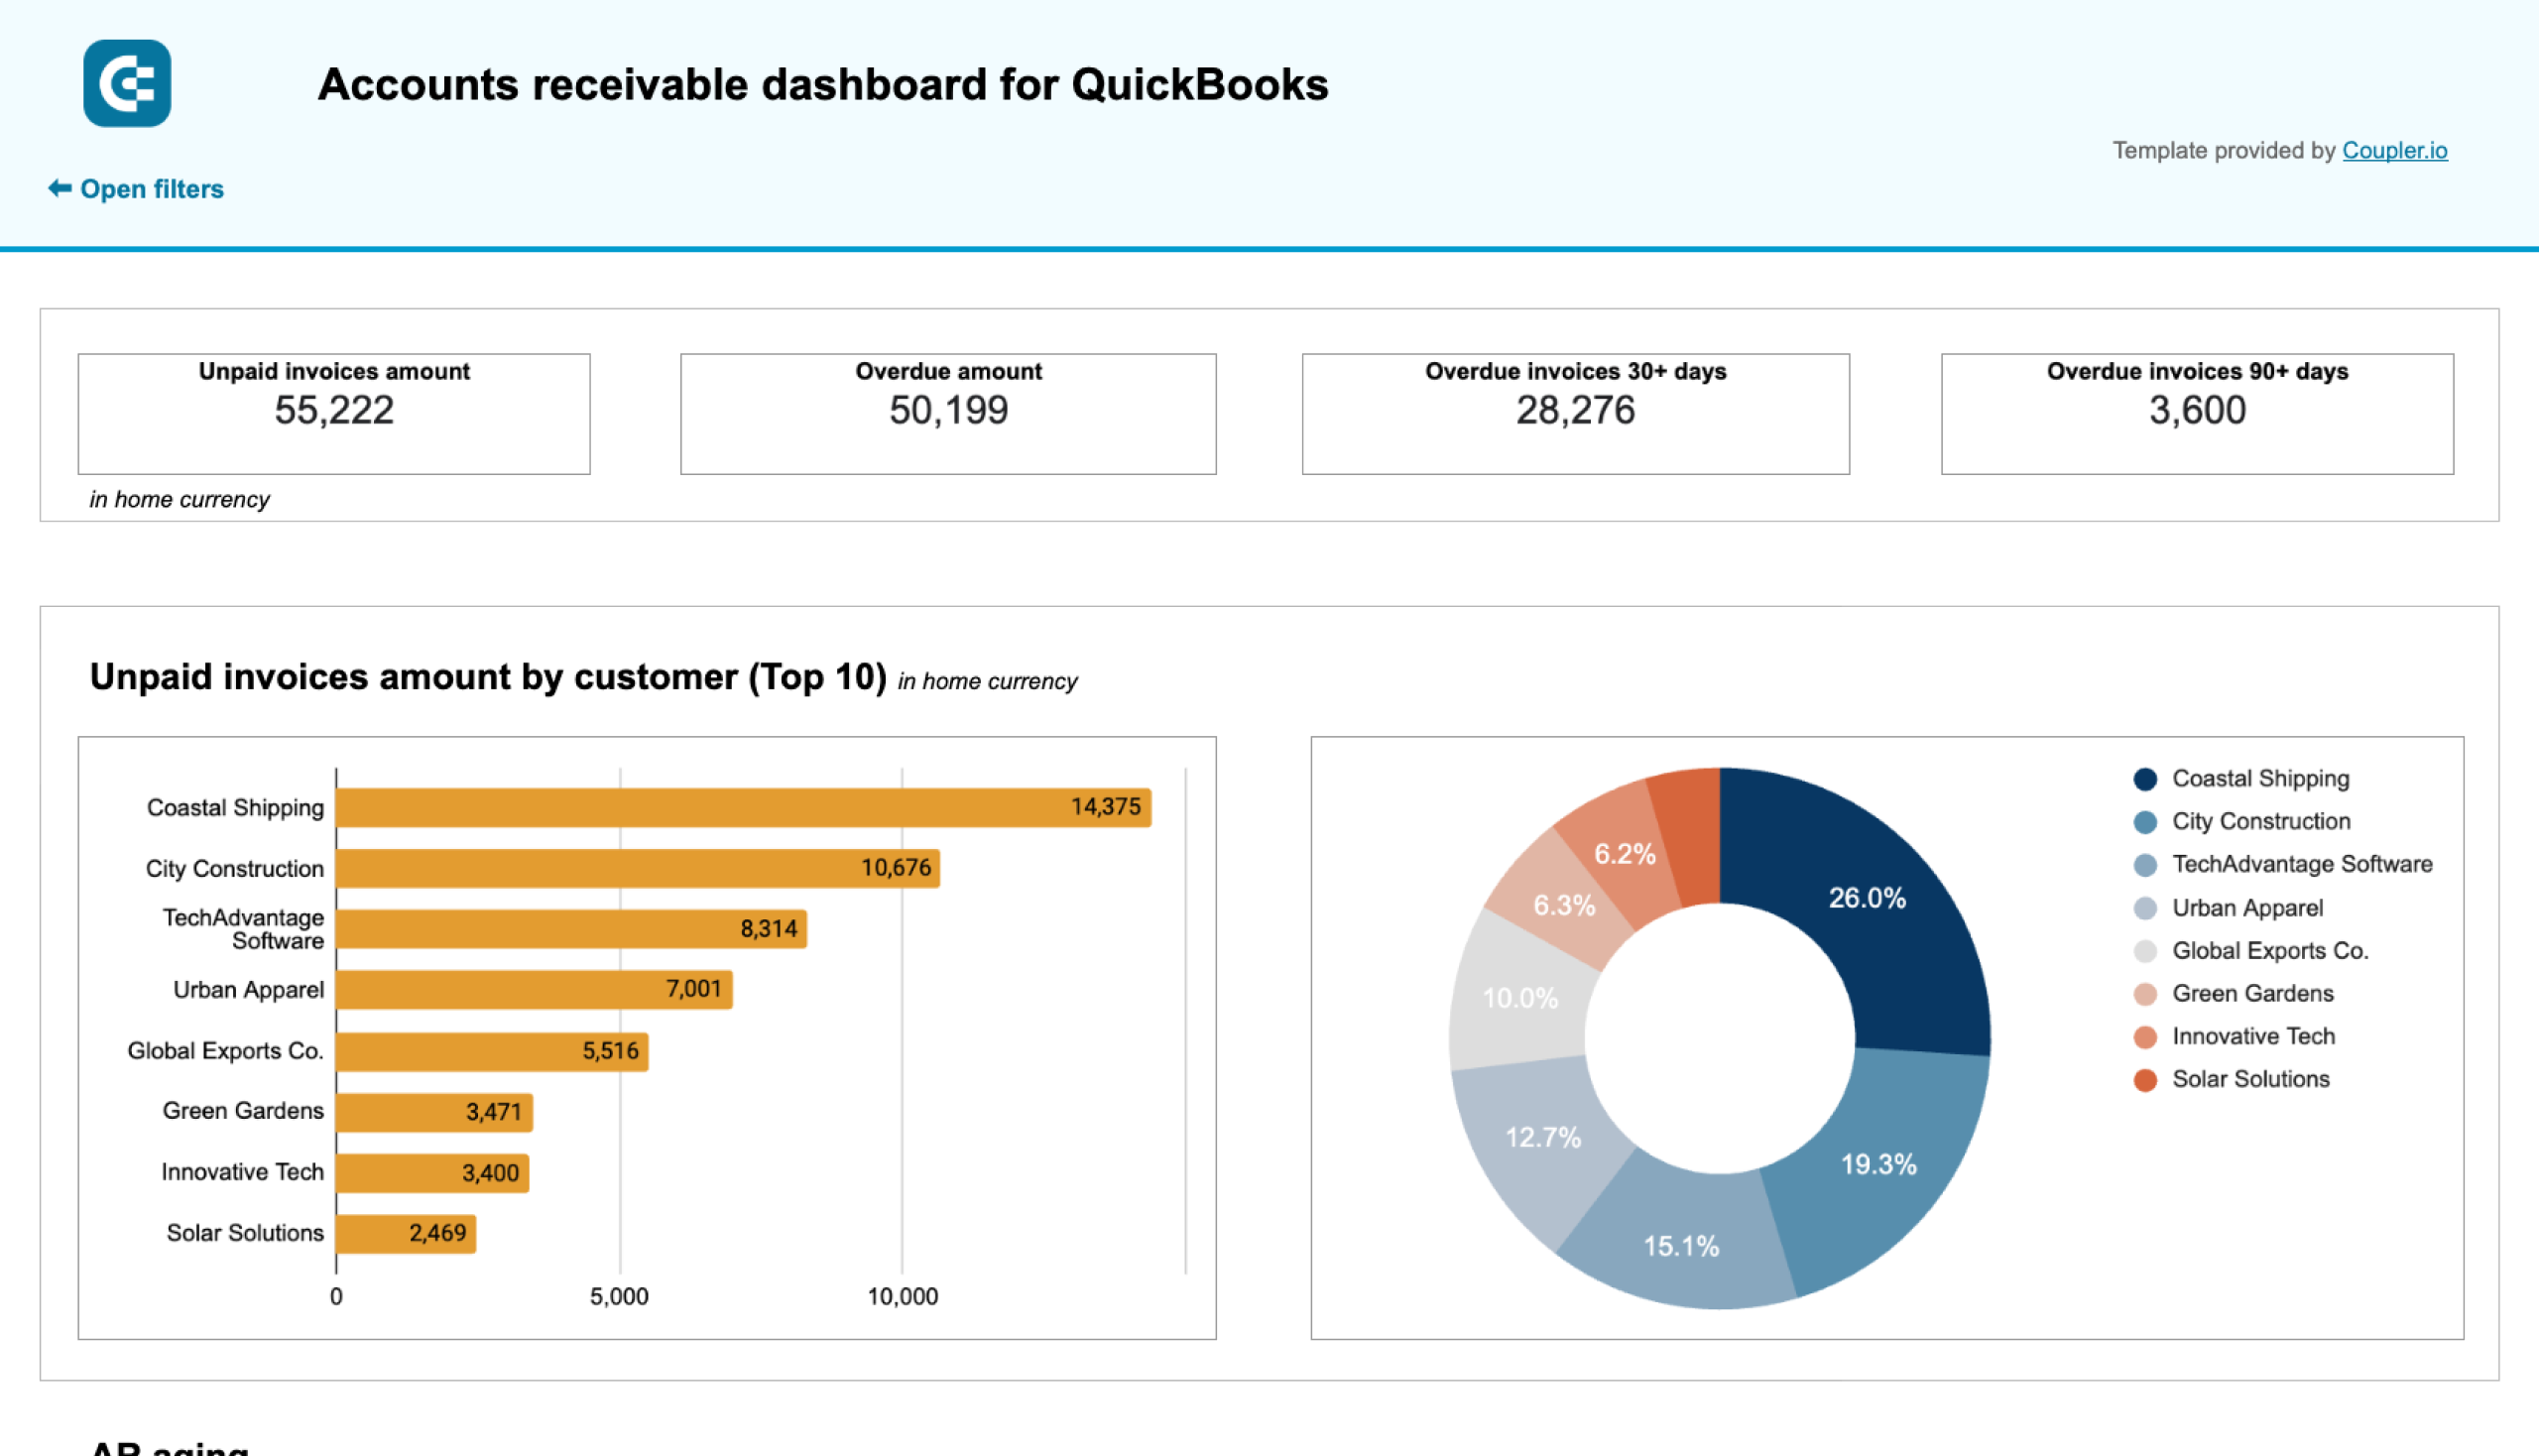
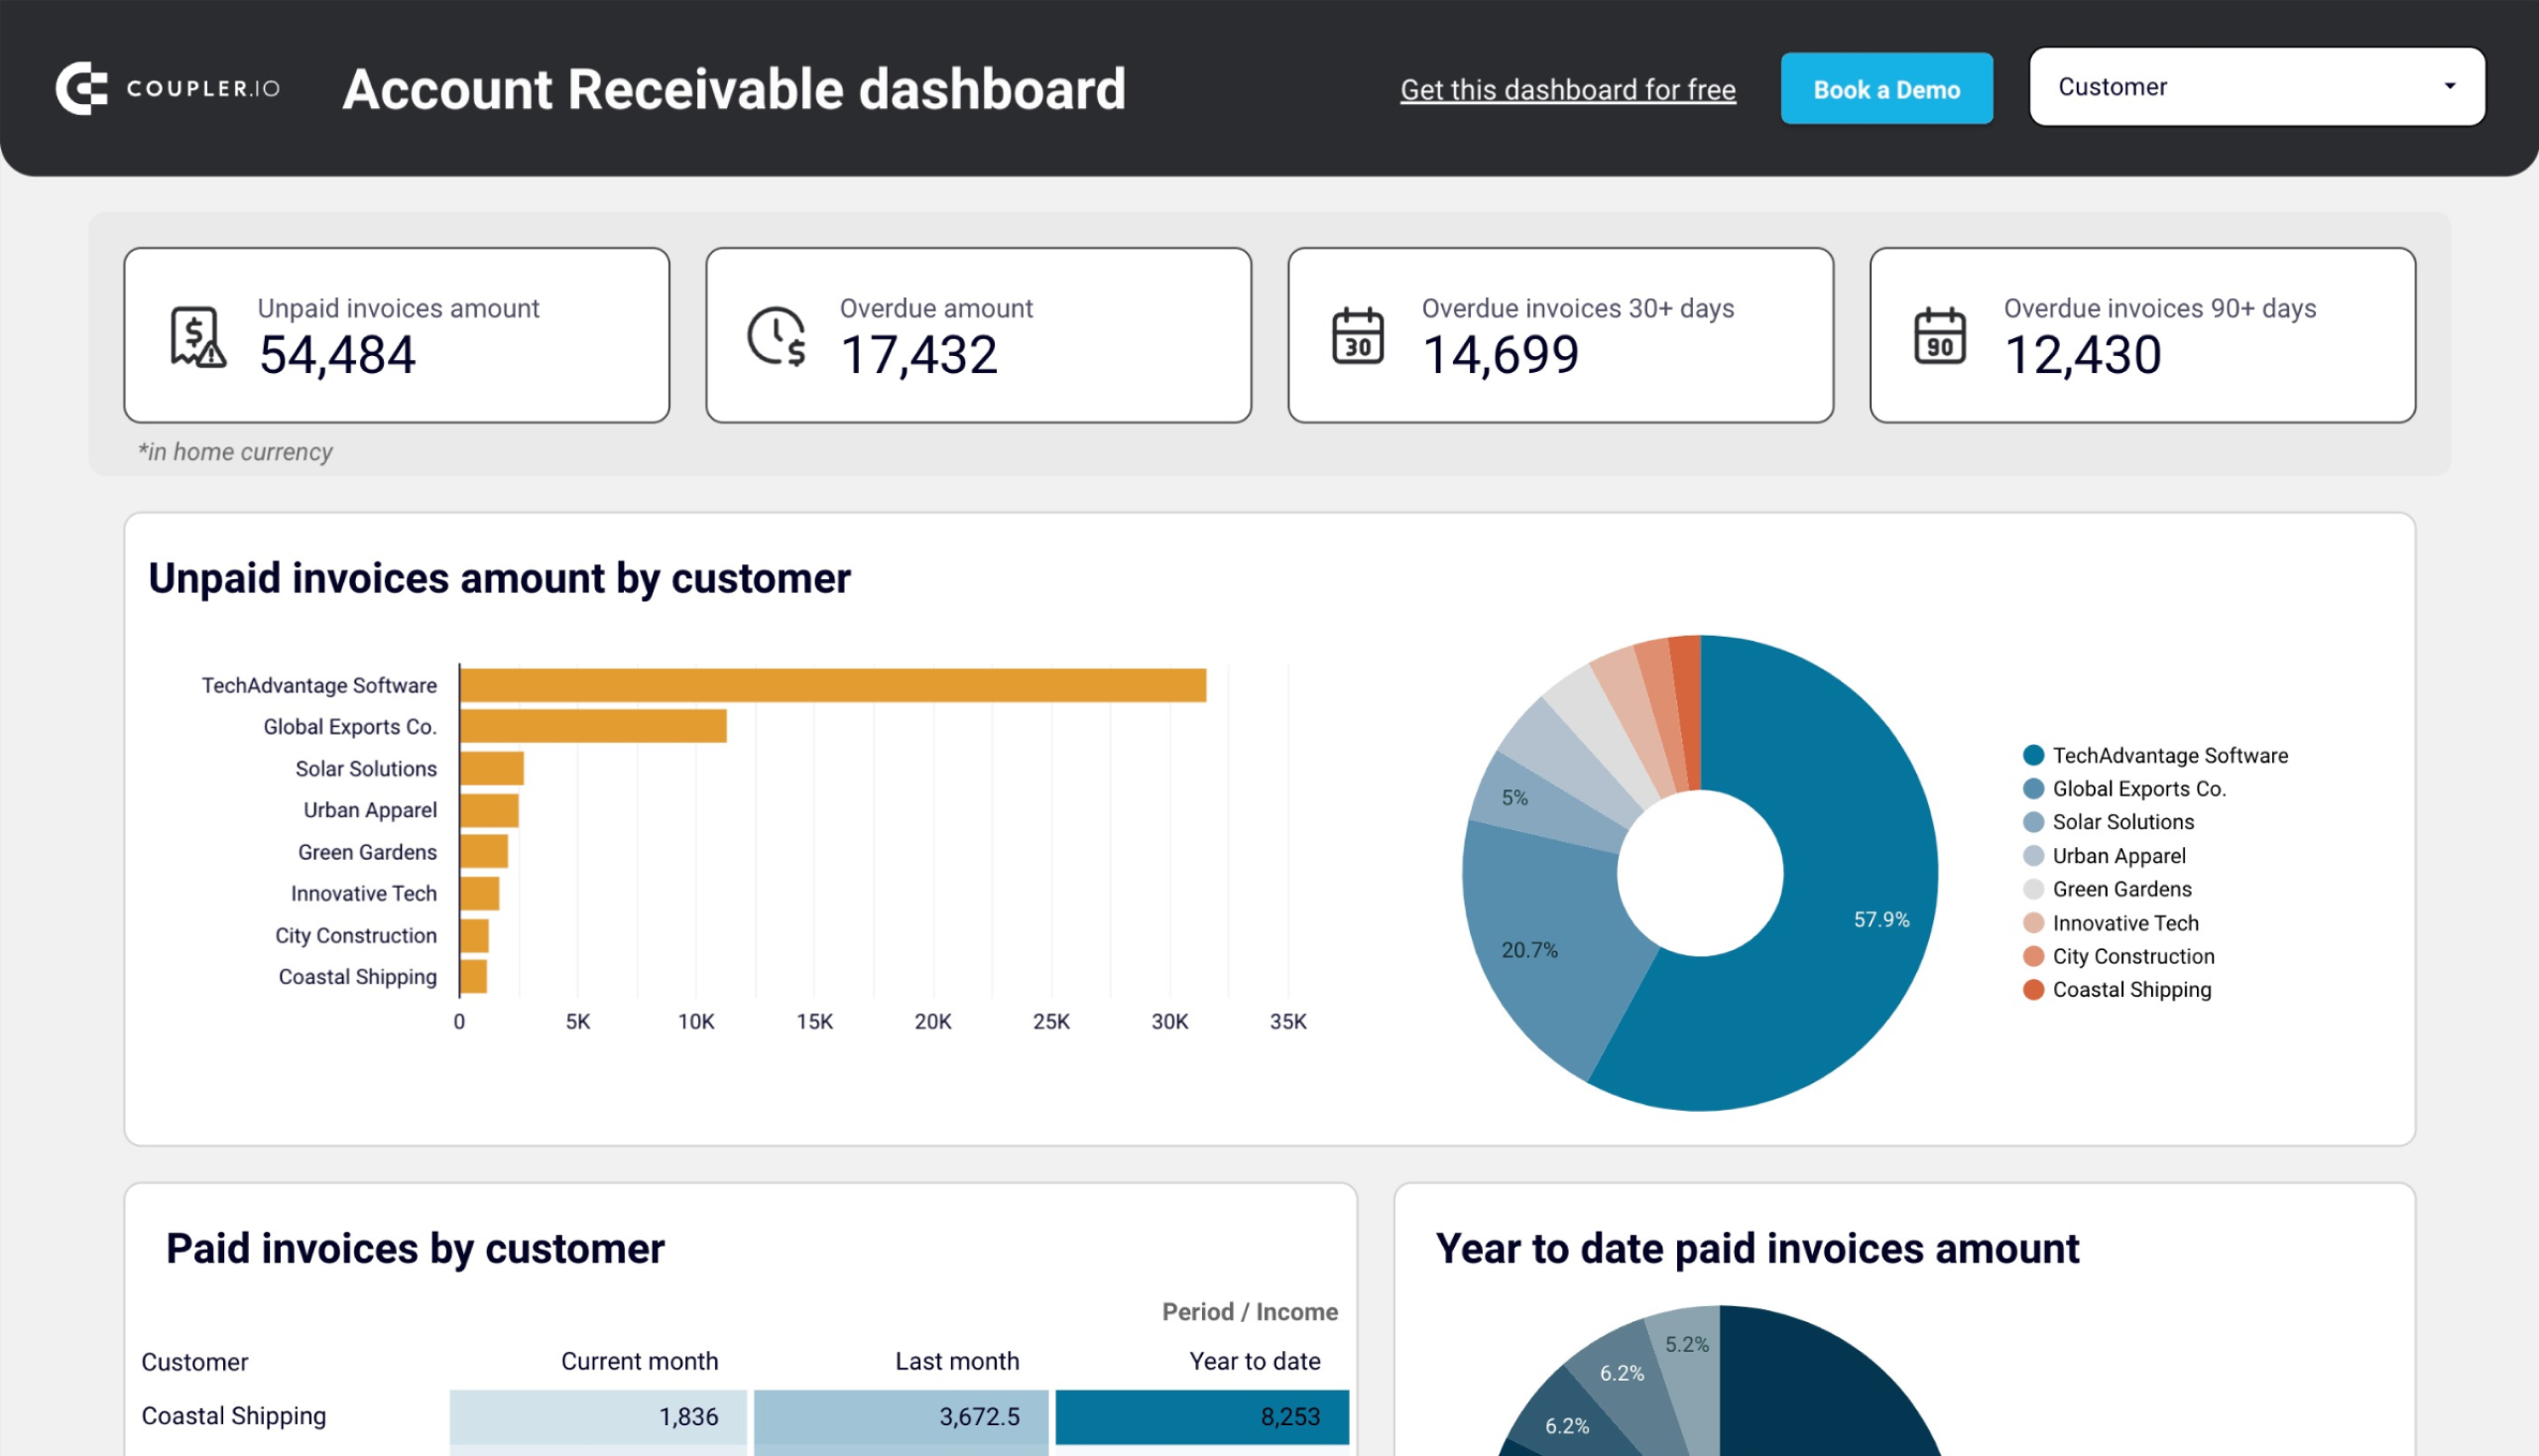
This accounts receivable dashboard contains detailed information about the accounts receivable turnover. It provides a visual summary of invoices from your QuickBooks account. This template illustrates paid and unpaid invoices, including overdue ones, to reveal customers’ debts.

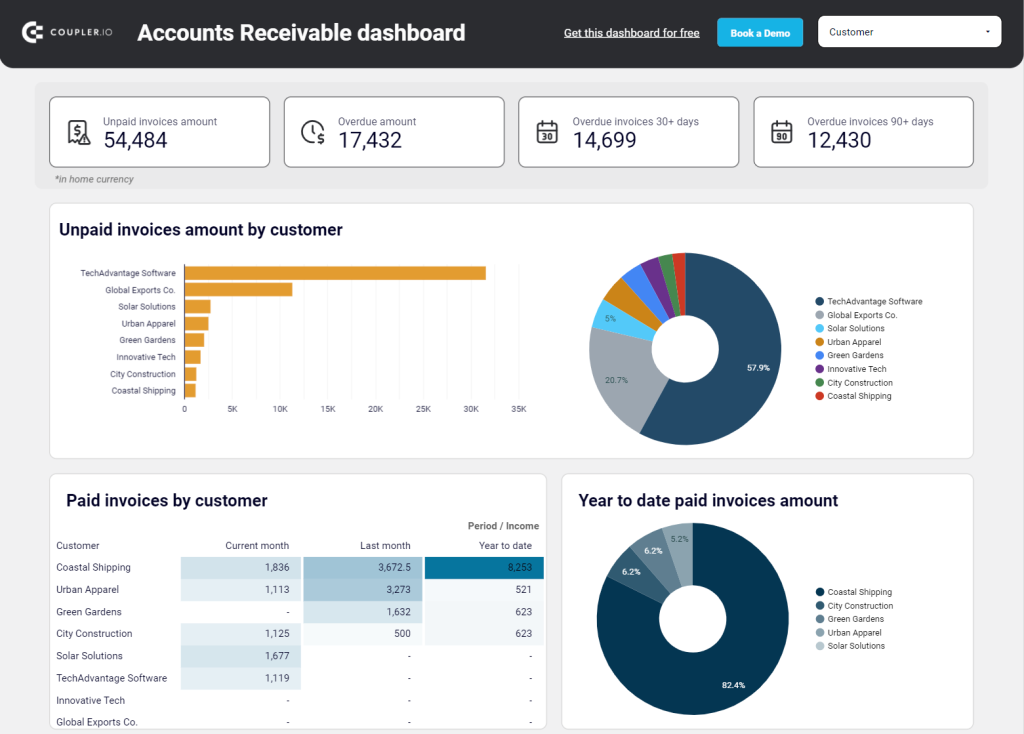
What insights does the dashboard provide?
- This template displays unpaid invoices sorted by date and customer. So, you can identify your major debtors and prioritize indebtedness activities.
- It gives you a complete overview of paid invoices for each customer and lets you see what share of your accounts receivable they represent. This information, together with the details on the unpaid invoices data, helps you evaluate your customers and decide on activities to pay off debts.
- Explore the distribution of overdue amounts for each customer over different time periods (30 days, 30-60 days, 60-90 days, 90+ days).
- Check all customer invoices, both paid and unpaid, with their corresponding details for the last 12 months. You can sort them by creation date, due date, currency, amount, and other criteria. Track the monthly dynamics of paid and unpaid invoices.
How to use the report template
Once you open this QuickBooks report template, follow the instructions stored in the Readme tab. It only takes a few minutes to set up a free Coupler.io account, configure the built-in QuickBooks connector, and load data to this auto-updating report in either Google Sheets or Looker Studio.
Accounts receivable dashboard for QuickBooks in Google Sheets
Monitor customer payment statuses, overdue invoices, and collection trends with this dashboard connected to QuickBooks. Get clear visibility into your cash flow cycle with aging analysis and customer payment patterns to improve financial forecasting.
Accounts receivable dashboard for QuickBooks in Looker Studio
See which customers accumulate unpaid and overdue invoices, analyze AR aging, and track changes over time. Get useful insights for maintaining financial health.
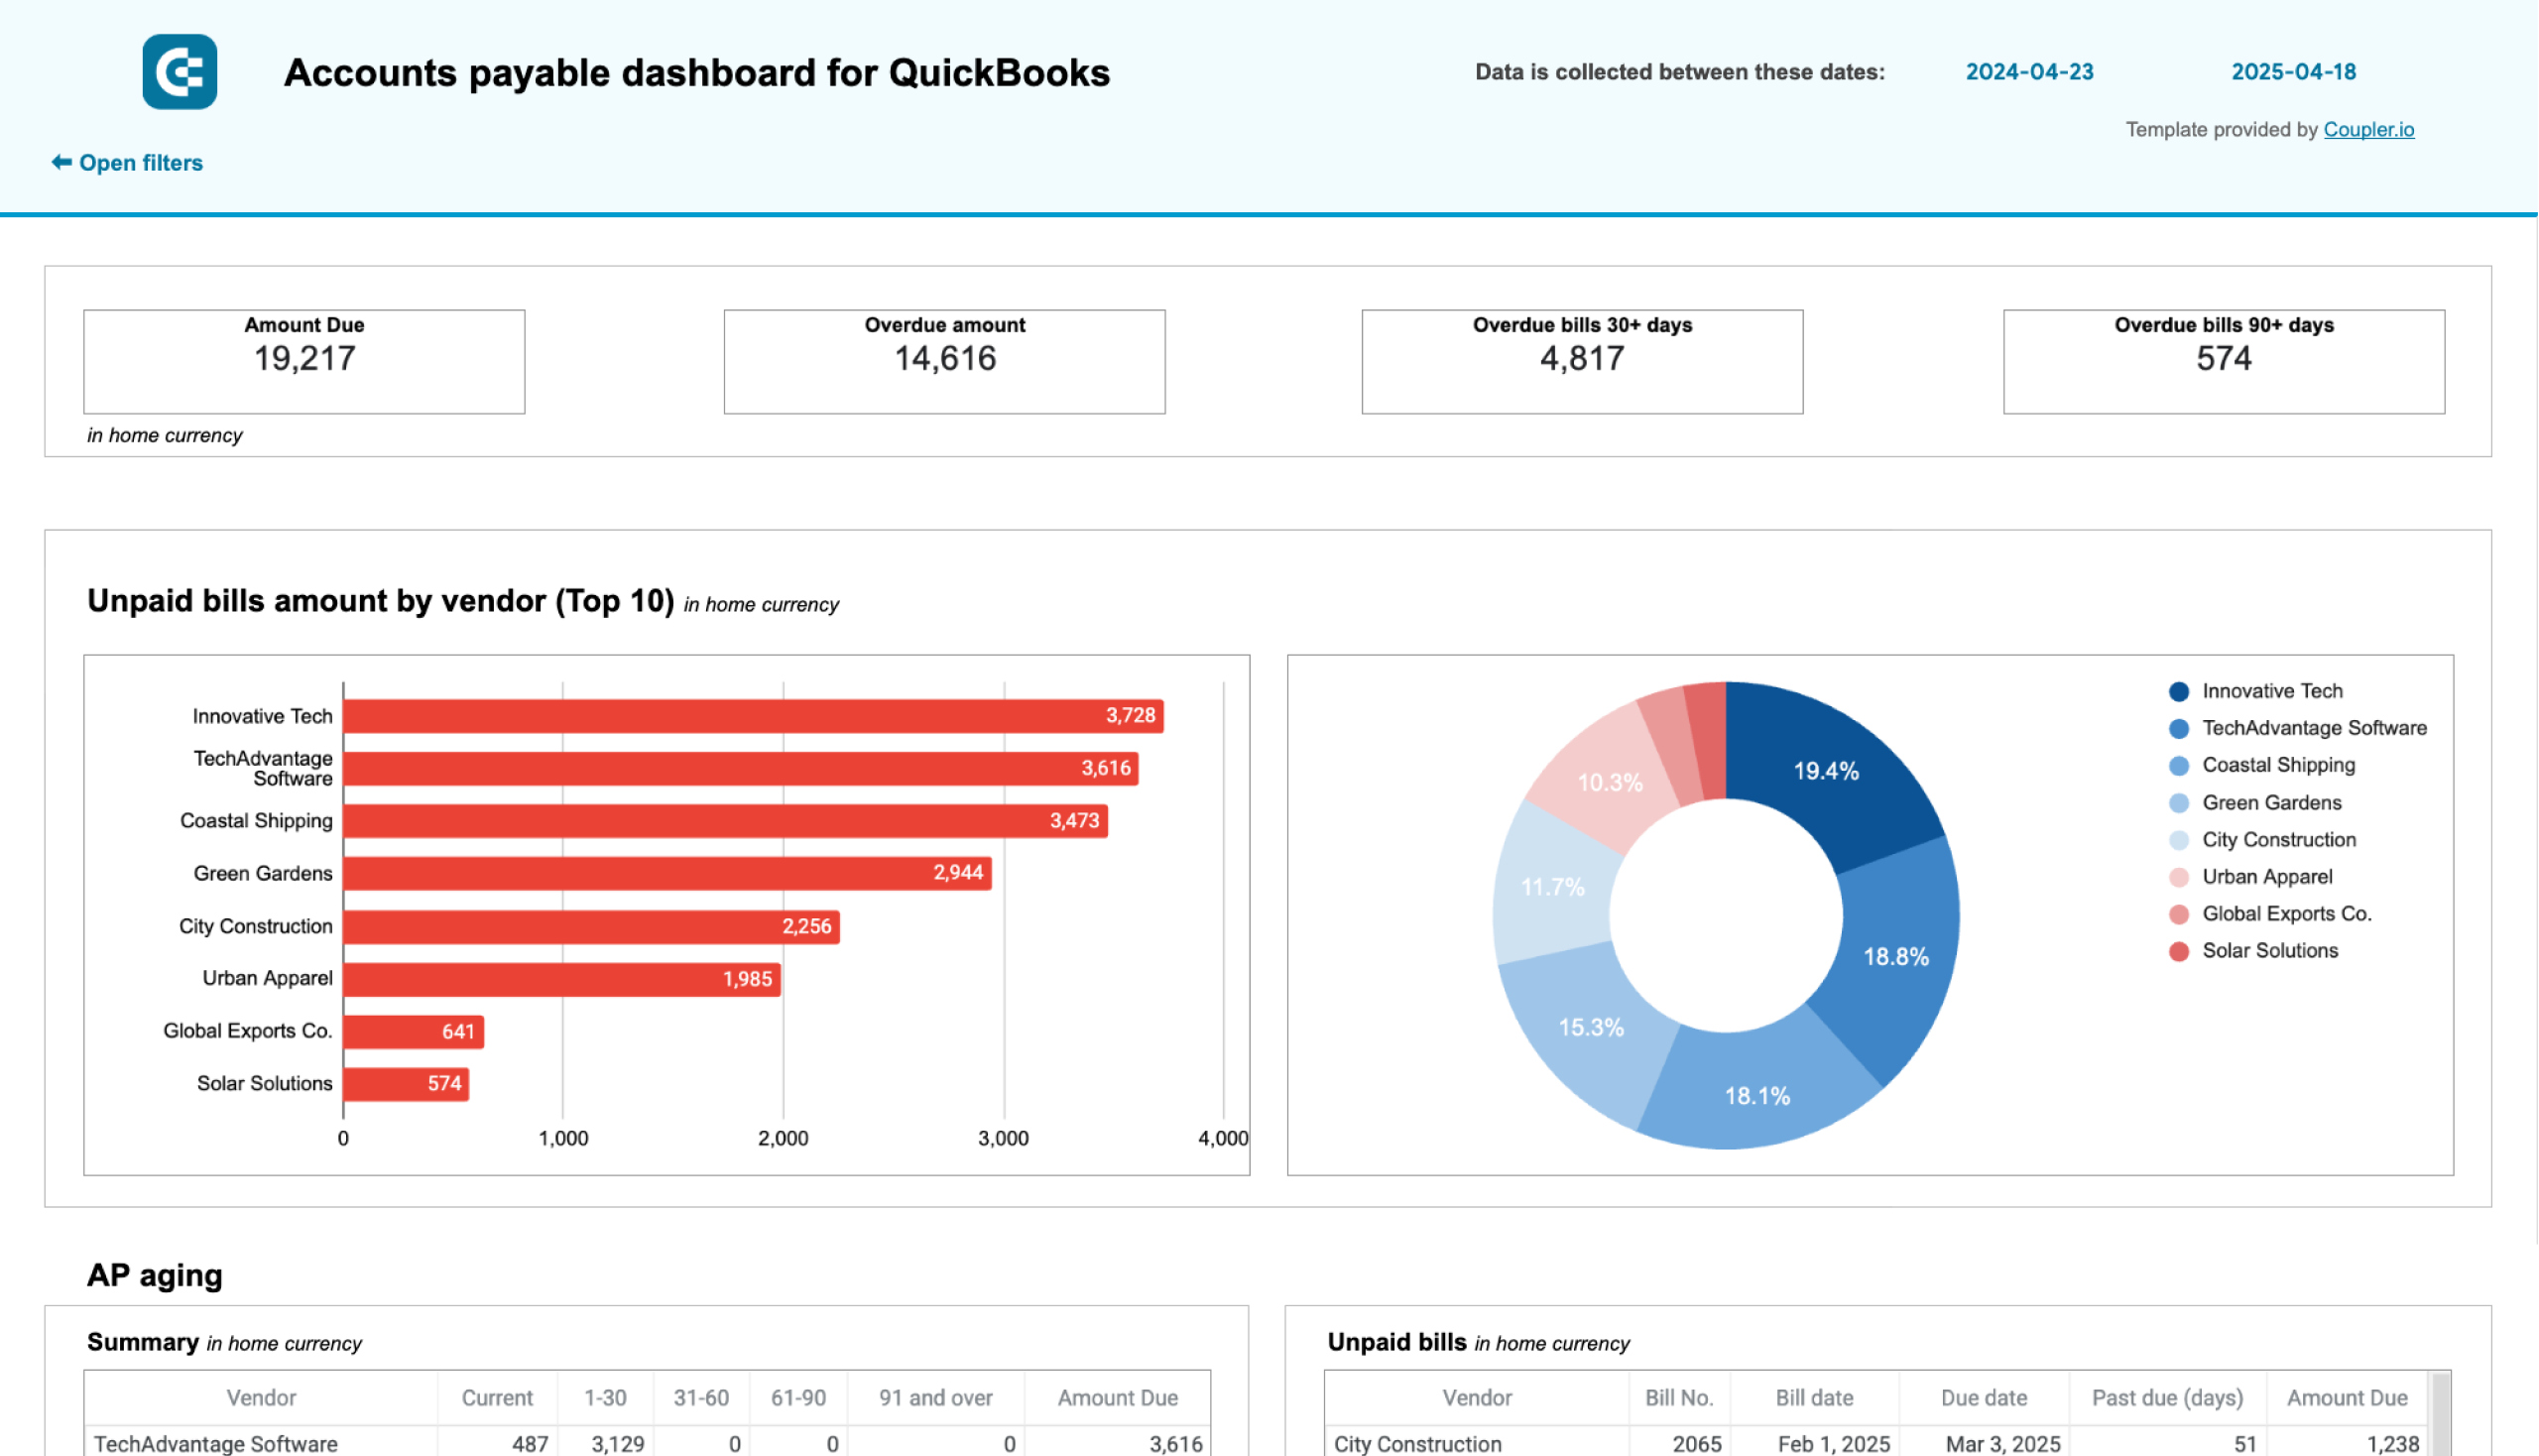
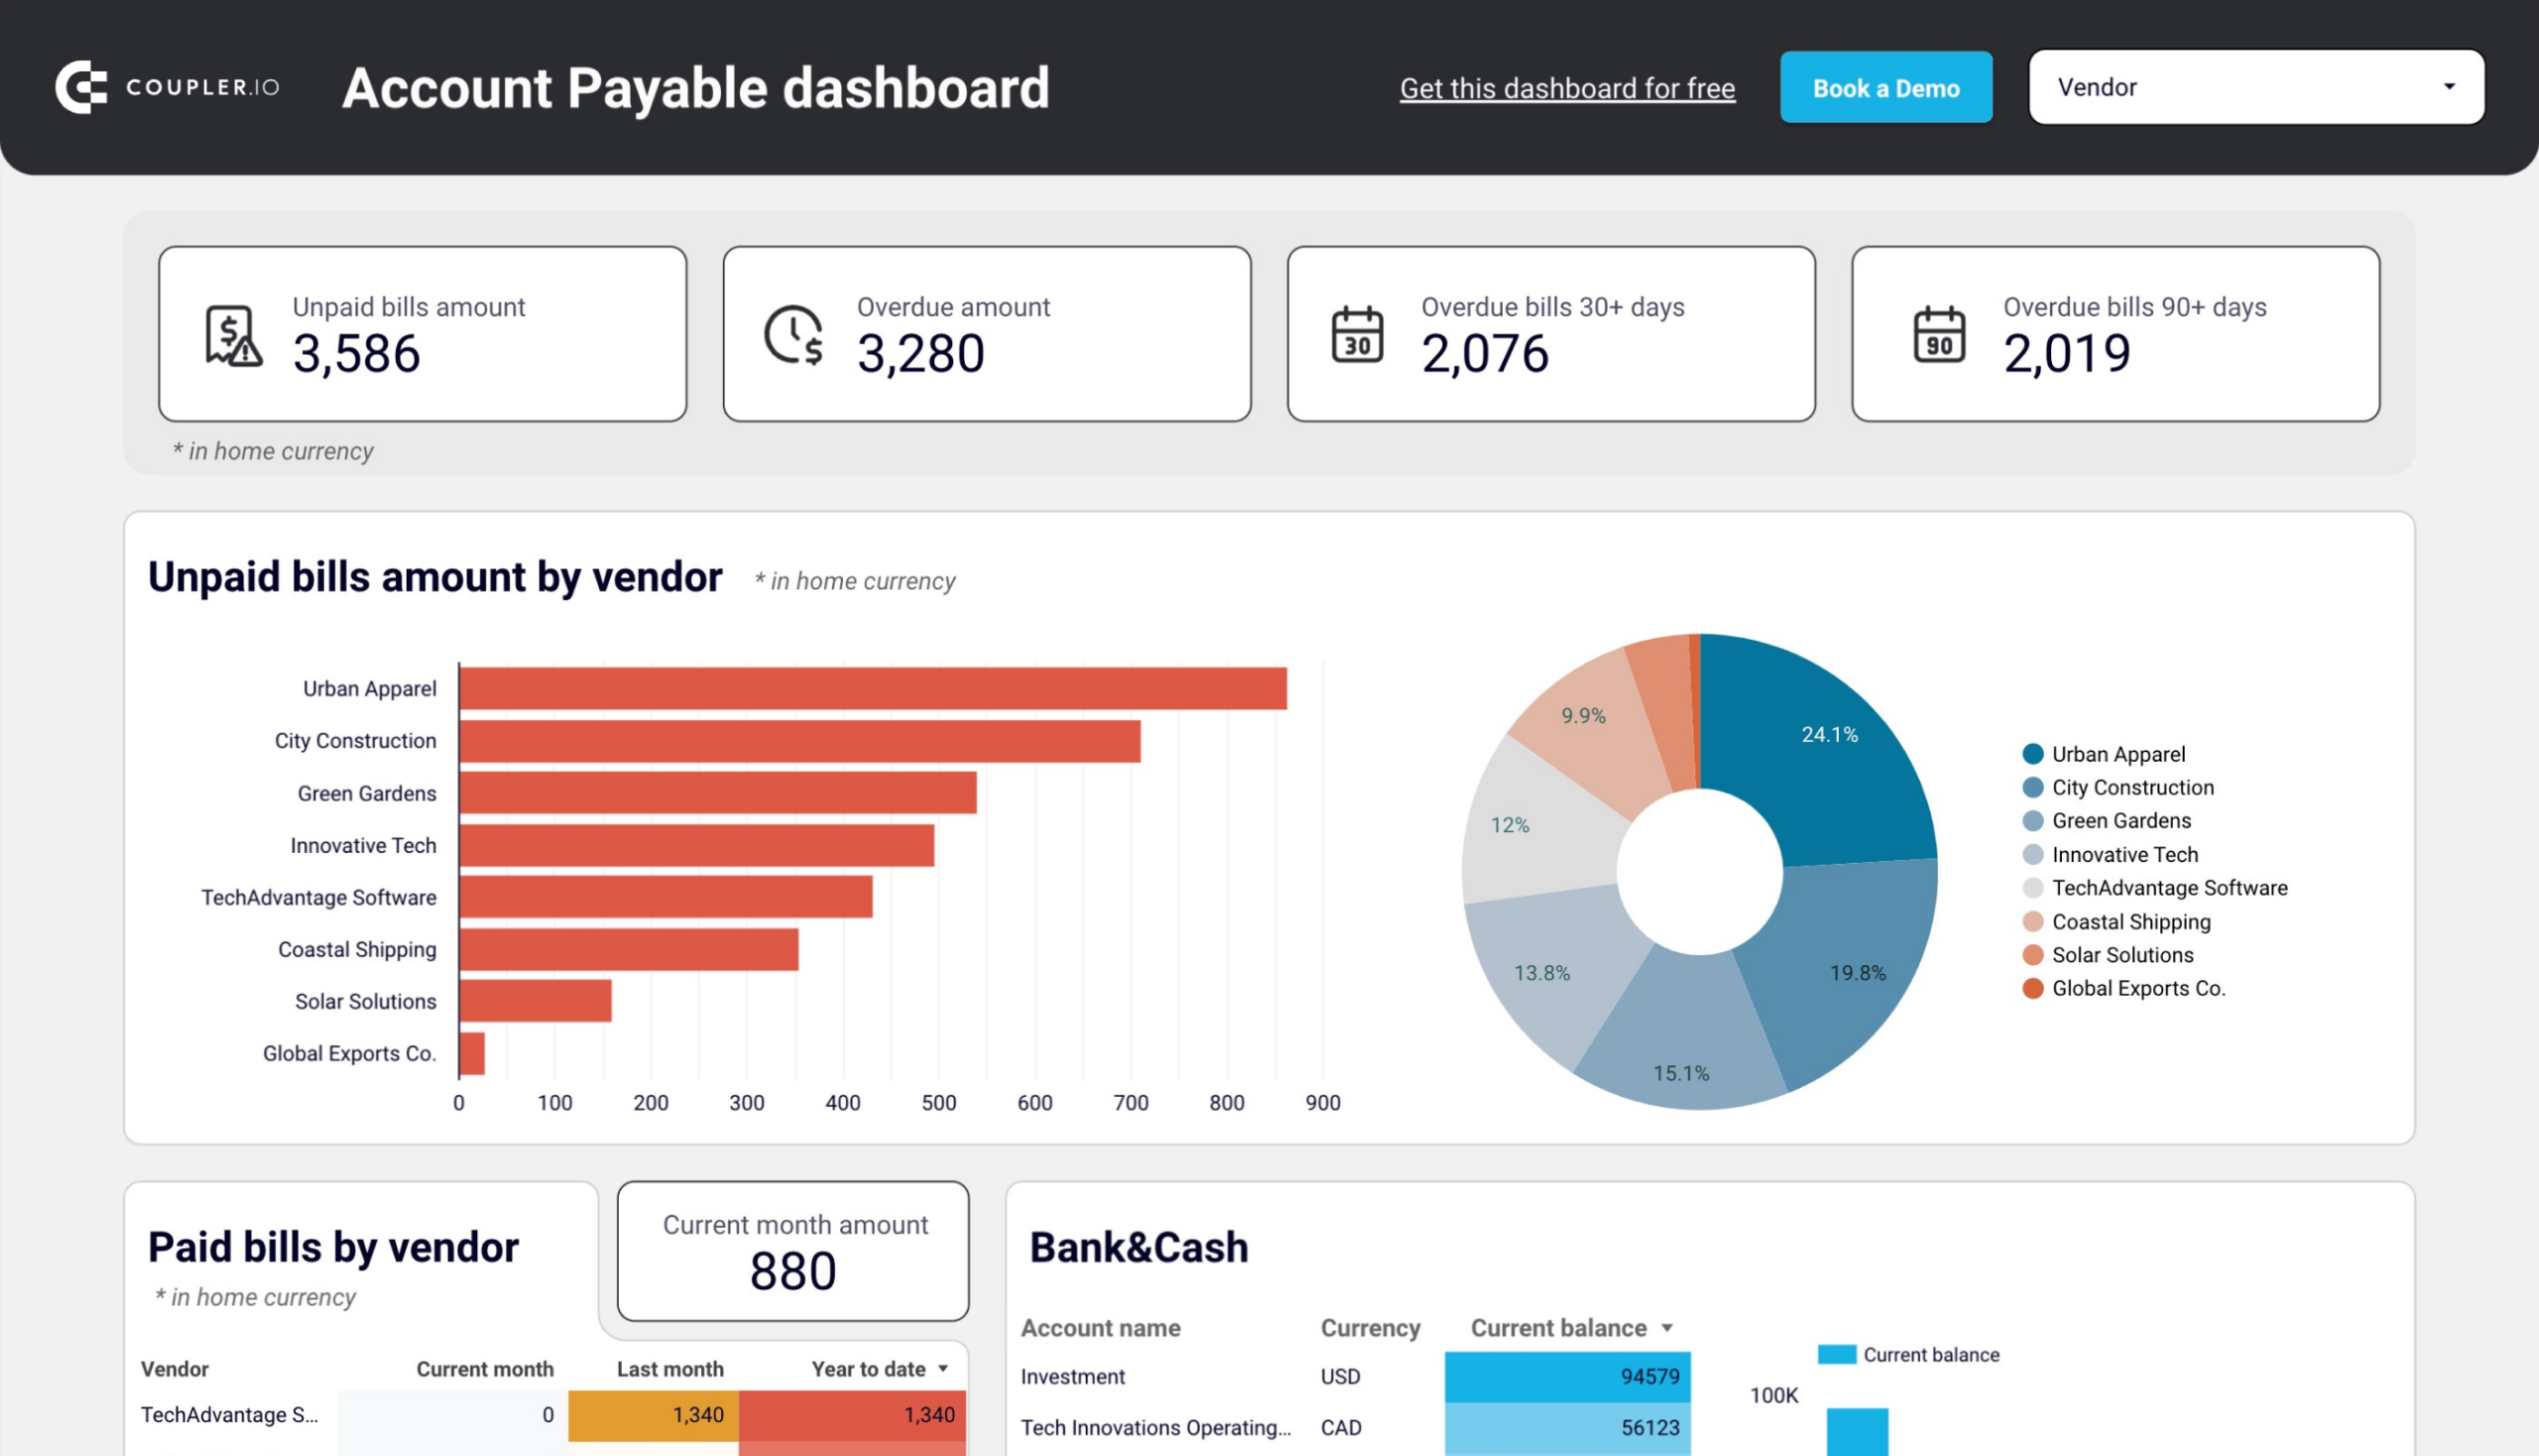
Accounts payable QuickBooks reporting template
With this accounts payable dashboard template, you can track how much money your business owes to its vendors or suppliers. The report displays a detailed breakdown of the bills you have to pay each vendor or supplier.

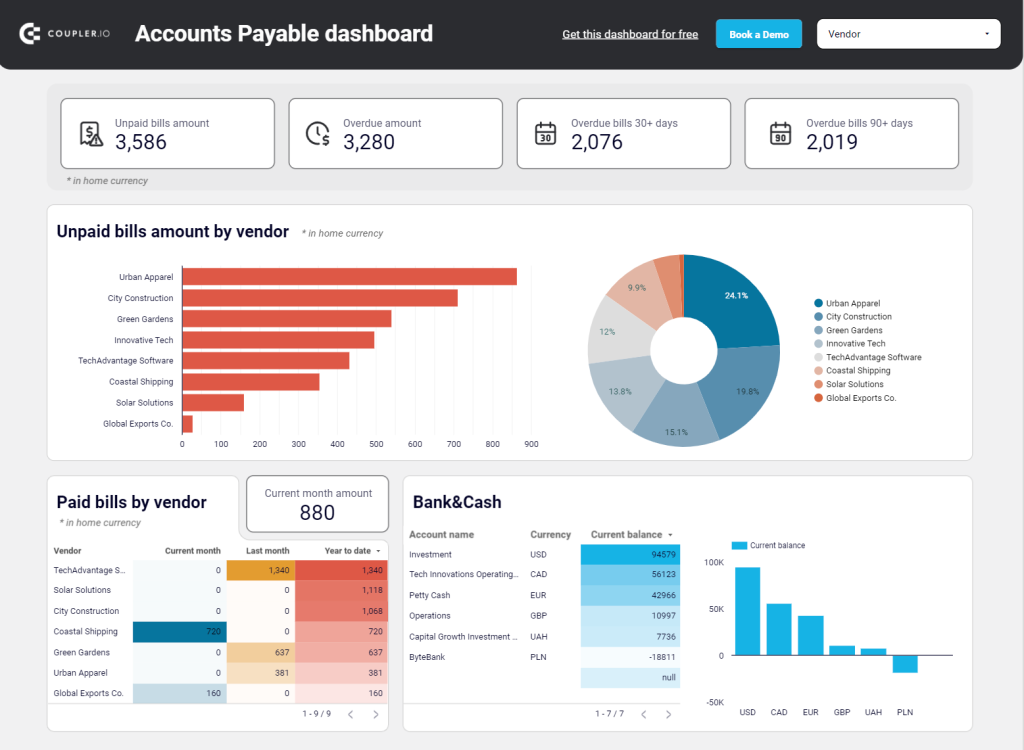
What insights does the dashboard provide?
- Discover how much you pay to each vendor. See which bills are closest to the due date. This information can help you organize billing cycles effectively.
- Get your current balance in bank accounts and in cash. This information helps you distribute your resources properly and prioritize payment schedules.
- Get an overview of the overdue amounts for each vendor over different periods (30 days, 30-60 days, 60-90 days, 90+ days).
- Check all the vendor bills, both paid and unpaid, with all the associated details for the last 12 months. You can sort them by creation date, due date, currency, amount, etc.
How to use the report template
The report is available for Google Sheets and Looker Studio. Once you land on the QuickBooks report template page, see the instructions for its configuration in the Readme tab. Simply use the built-in Coupler.io connector to connect to your online QuickBooks account and import data into the report. It will update automatically according to the selected schedule.
Accounts payable dashboard for QuickBooks in Google Sheets
Track outstanding vendor obligations, payment schedules, and expense patterns with data from QuickBooks. This dashboard helps you manage cash flow, identify payment priorities, and maintain healthy supplier relationships through visualized aging reports.
Accounts payable dashboard for QuickBooks in Looker Studio
Get an overview of unpaid, overdue, and paid bills grouped by vendor. The dashboard helps you prioritize payments and improve cash flow management.
Cash flow QuickBooks report template
Tracking the inflow and outflow of cash is essential for businesses of all sizes. Consider using the cash flow QuickBooks report template for Tableau for this. It is one of the most popular and important accountant reports, showing the quarterly analysis of income statements and expenses, the total amount, and a breakdown into subcategories. This report helps executives obtain a clear picture of where the money comes from and how it’s being spent.

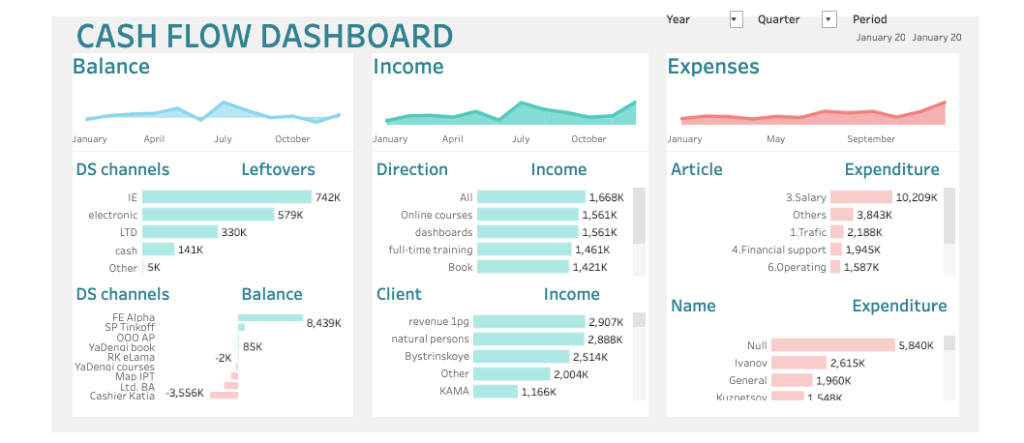
What insights does the dashboard provide?
- Discover which activities generate cash for your company by exploring the income section. This information is helpful for focusing your efforts on productive actions.
- The balance sheet on this dashboard gives you an idea of how cash and resources are distributed across different channels. If there is a negative balance on one of them, investigate and resolve the issue. Check out all balance sheet dashboard examples by Coupler.io.
- The cash flow dashboard also depicts where your money flows under the expenses section. Outgoing spending is categorized by group of expenditures and by concrete instances, including particular people and organizations.
How to use the report template
Make a copy of this cash flow dashboard template and provide your Salesforce credentials to download it. Open Tableau, connect to your QuickBooks Online right from Tableau, and start ingesting data for this report.
QuickBooks expense report template for Google Sheets
This report is great for those who need to categorize their expenses. It contains a tab for each month and a general tab for total expenses. You can use it to create monthly, quarterly, or yearly summaries of expenses.

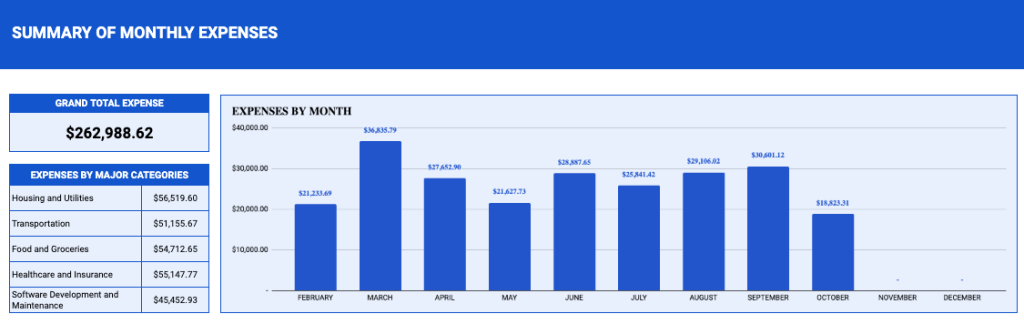
What insights does the dashboard provide?
This QuickBooks reporting template contains five major expense categories: housing, transportation, food, healthcare, and software development. Each category includes specific subcategories that enable detailed spending analysis.
The expense summary report shows you where you spend money. The report can also be used to juxtapose the allocated budget, so you will know if you are staying within your budget or not. Based on the insights obtained from the report, you can adjust your budget for the next quarter or year.
How to use the report template
Open this template, select either its Microsoft Excel or Google Sheets version, and save its copy on your computer or Google Account. Note that you will have to input the information manually into this report. Alternatively, you can always use the QuickBooks connector by Coupler.io to automate the data-loading process to spreadsheets.
What are the key metrics to track in QuickBooks reporting templates?
Assessing the financial performance of a business without key metrics is like steering a ship without a compass. There are numerous key performance indicators (KPIs) for measuring how far or close you are to the financial goal. All of them are certainly important, but let’s focus on the top 10 KPIs that will help assess your business’s financial health.
1. Net profit
| Formula | Net profit = total revenue – total expenses |
| Description | This indicator shows the actual amount of money you have earned within a specific date range. It’s easy to calculate – just subtract all the expenses from the gross profit, and you will get the net income. Net profit is common on revenue and cash flow dashboards. However, feel free to include it on any custom QuickBooks report. |
2. Account receivable turnover ratio
| Formula | Account receivable turnover = net credit sales \ average accounts receivable |
| Description | To evaluate how effectively your company collects debts and cash from credit sales, calculate the account receivable turnover ratio. A high value indicates an effective collection process. It also means that customers are paying rather fast. |
3. Operating cash flow
| Formula | Operating cash flow = total cash – cash paid for operational expenses |
| Description | This metric is crucial for your business because it indicates whether a company is generating sufficient cash for maintaining and scaling its operations. If the operating cash is positive and sufficient, there is nothing to worry about. In the opposite case, consider involving external investments to cover expenses. The operating cash flow metric is included in almost every financial report. Consider including it on your custom QuickBooks report template as well. |
4. Gross profit margin
| Formula | Gross profit margin = ((revenue – cost of goods sold)/revenue)*100% |
| Description | This KPI represents the percentage of revenue remaining after deducting the cost of goods sold. Obviously, the higher the gross profit margin, the more profitable your business is. Analyzing this metric will provide you with a better understanding of your company’s profitability. |
5. Return on assets (ROA)
| Formula | ROA = net income \ total assets |
| Description | The higher the ROA, the better your company generates profit from the available assets. ROA helps you identify which areas of your business perform well and which ones need improvement. ROA is also of particular value to investors and executives as they can understand how efficiently a company uses its resources for profit generation. |
6. Return on investment (ROI)
| Formula | ROI = (net profit \ initial investment)*100% |
| Description | ROI is probably the most popular metric that is also used outside of financial settings. It shows how helpful the investment was for the business operations. Ideally, this metric should exceed 100% to ensure that the cost of the initial investment was compensated and extra profit was generated out of it. This metric helps investors decide how fast and how much profit they will gain from their investments. |
7. Gross revenue
| Formula | Gross revenue = number of goods sold * price of goods sold |
| Description | This is a fundamental metric for any business, so consider including it in any financial report. Gross revenue shows the total amount of money generated before deducting any kind of expenses. |
8. Operating expense ratio
| Formula | Operating expense ratio =(all operating expenses – deprecation) \ operating income |
| Description | This metric shows how your operational expenses correlate with your operational income. The lower the ratio is, the higher the profit you receive. Since this KPI requires an exact amount of all operational expenses, consider using the QuickBooks report template for Google Sheets as a base for your custom report. |
9. Cost of goods sold (COGS)
| Formula | Cost of goods sold = starting inventory – ending inventory + purchases |
| Description | Starting inventory is the total monetary value of product items in stock at the beginning of the reporting period. The ending inventory is the total value of goods at the end of the reporting period. COGS reveals direct costs of producing goods, including materials and labor. It also helps to determine whether your business is making any profit. This KPI is more useful for businesses that deal with products rather than services. |
10. Revenue growth rate (RGR)
| Formula | RGR = (current period revenue – prior period revenue) / prior period revenue |
| Description | Together with gross revenue and net income, RGR is among the fundamental financial performance metrics. It depicts whether your revenue has increased or decreased compared to the previous periods. Note that this metric doesn’t signify an increase in profitability. |
How to create a custom QuickBooks report template
If you need a specific report for financial data analytics that combines all key financial performance metrics, create it from scratch.
With Coupler.io, automate financial reporting from QuickBooks accounting software to popular BI tools like Tableau, Looker Studio, and Power BI, as well as spreadsheets like Excel or Google Sheets. The entire setup process only takes a few minutes and the three simple steps outlined below.
Step 1. Collect QuickBooks data
Select the destination app for your report in the form below and click Proceed.

You’ll be offered to create a Coupler.io account for free which requires no no credit details.
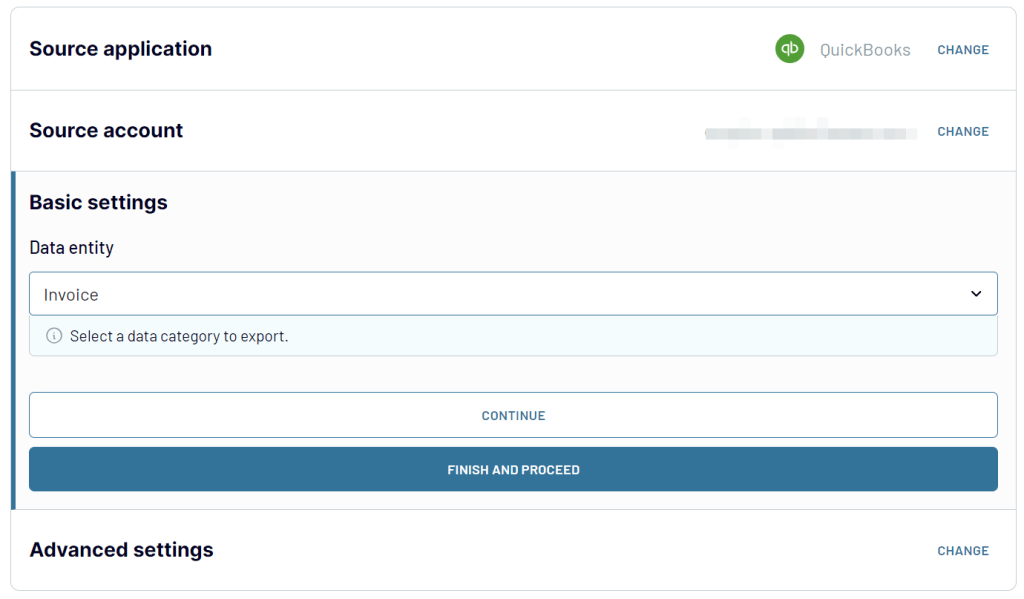
Alternatively, you can switch the source app from QuickBooks to QuickBooks Reports to extract the preset reports from QBO.
Under the source settings, connect to your QuickBooks account and select the data entity for export. Configure advanced settings if necessary.

Step 2. Transform and organize data
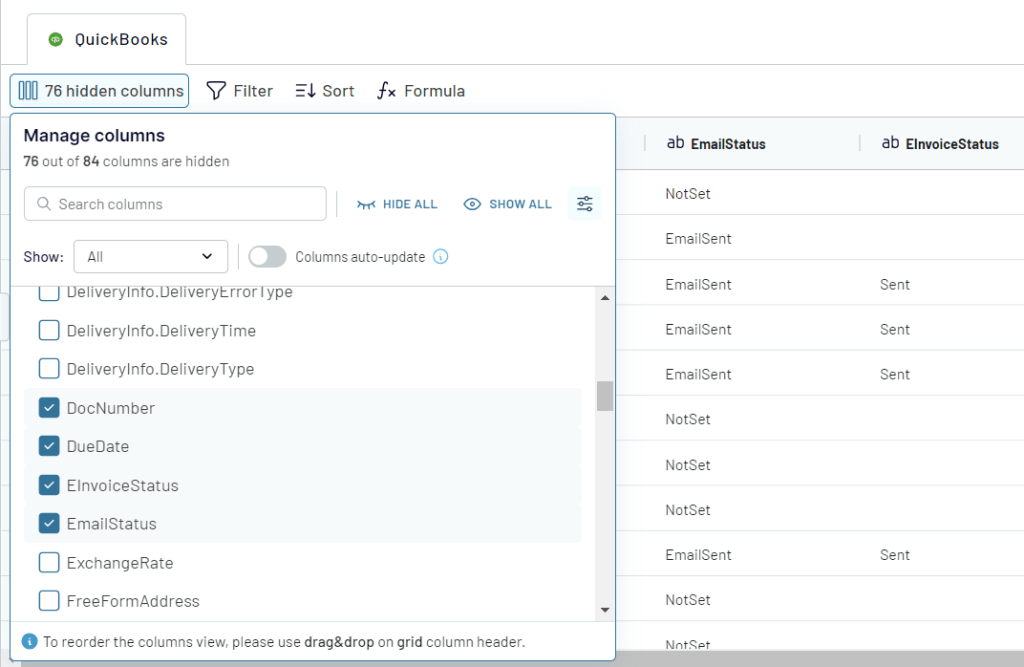
To ensure accurate calculations of KPIs, it is essential to have well-structured and organized data. Coupler.io’s built-in module enables you to perform numerous operations that help to prepare your financial data for analysis:
- Manage columns by renaming or rearranging them.
- Hide columns that make no sense for further analysis.
- Add new columns to the dataset and create new metrics based on the mathematical calculations.
- Sort and filter data.
- Blend QuickBooks data with information from other financial data sources.

Step 3. Load data and schedule its recurring updates
Once you are satisfied with how the data looks, proceed to the destination settings. All the instructions to connect the selected app and set it up will be provided on-screen in the importer.
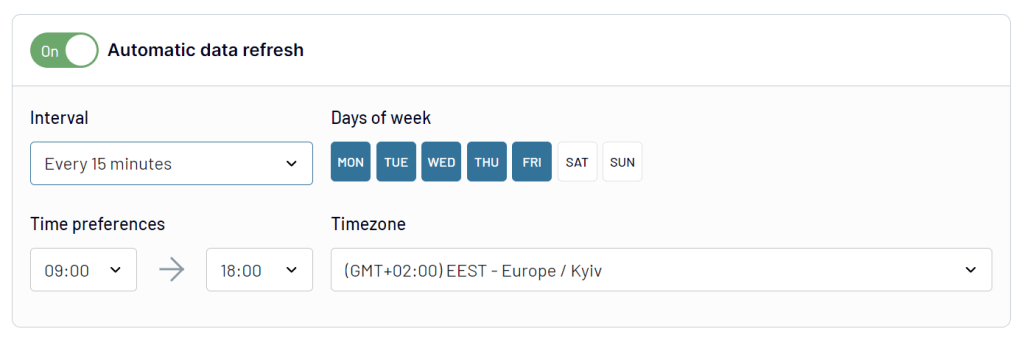
Finally, Coupler.io enables you to implement regular data transfer between QuickBooks and the selected destination app. To do this, activate the Automatic data refresh option and set the data refresh interval from the drop-down list of options. Additionally, specify the days of the week and exact times for data transfers.

Templates vs. custom-made dashboards for Intuit QuickBooks Online reporting
Which QuickBooks report template is more applicable to your business?
Making the right choice is not that difficult – just consider these factors on the checklist.
? Frequent reporting
? Sharing and collaboration of reports
? The need to include standard financial KPIs
? Lack of time on dashboard creation and configuration
? Real-time updates of data on reports
If the answer is ‘yes’ to all items on the list, then automated pre-configured QuickBooks reporting templates would work fine for you.
Otherwise, creating reports from scratch is the way to go. In a new report, include customer fields and KPIs that correlate with your business needs. Self-made reports are also ideal for combining QuickBooks data with financial data from other sources. Coupler.io can help you collect all the needed data, organize it, and supply your reports with fresh data almost at a real-time pace.
Automate QuickBooks reporting with Coupler.io
Get started for free