QuickBooks provides detailed reports that can be very useful to financial professionals. However, these reports can sometimes be overwhelming for stakeholders with different backgrounds – executives, marketers, and sales teams. By creating custom dashboards in Power BI, you can present QuickBooks data in easy-to-understand visuals. This helps you to better share financial insights, present results to stakeholders, collaborate across teams, and analyze data to make informed decisions.
In this article, we show you several ways to connect QuickBooks to Microsoft Power BI.
Methods to connect QuickBooks to Power BI: What can you choose from?
Here’s a preview of the different methods we are going to discuss:
- Automated connection with Coupler.io. Coupler.io is a reporting automation platform that allows you to easily export QuickBooks data to Power BI. Setting it up takes just a few minutes, and you can transform your data before loading it to Power BI. It will also auto-refresh your dashboard based on the schedule you choose. You don’t need any tech knowledge to set up a finance automation, as it’s a no-code solution that’s easy to set up and use. Additionally, Coupler.io provides pre-built templates that allow you to quickly create professional dashboards and reports using QuickBooks data.
- Power BI’s QuickBooks Online connector. Power BI offers a native connector that uses the QuickBooks ODBC Driver to import data directly from QuickBooks Online. Setting up this connector is simple, but you need to meet a few requirements before you can use it. One of the requirements is having your company listed on the QuickBooks Company page. Also, this doesn’t work with the QuickBooks desktop version, so it’s only suitable for the online version.
- Manual data export. With this method, you’ll need to first download your financial data as an Excel (.XLSX) file, then upload it to Power BI. While this approach is simple, you’ll need to repeat the process each time you want your report to show the latest numbers, which can be time-consuming.
- Custom API integration. For a more tailored approach, you can connect QuickBooks to Power BI using the QuickBooks API. First, you need to obtain an access token from the Intuit Developer Portal. Next, write a script to pull data from the QuickBooks API and load it into a database like BigQuery or PostgreSQL. From there, you can use Power BI’s “Get Data” function to bring in the data and begin analysis. This method is more complex and requires technical expertise and experience in writing code, so we won’t dive into this option in detail here.
Moving on, let’s explore the other methods, starting with the most convenient one, Coupler.io.
How to set up a QuickBooks to Power BI integration for automated data exports with Coupler.io
Using this platform, you can easily export your financial data from QuickBooks to Power BI to create live reports and dashboards. The process is simple and consists of just three steps, which typically only take a few minutes to complete.
Step 1: Retrieve your QuickBooks data
To start, click Proceed in the pre-configured form below. If you want to export a preset report such as Balance Flow, Cash Flow, Vendor Balance, and so on, select QuickBooks Reports as the source.
If you’re new to Coupler.io, you’ll need to create an account to use the platform (this is free and no credit card is required).
After logging in, connect your QuickBooks account by granting Coupler.io the necessary permissions to access your data.
Next, choose the data entity you want to export, such as Invoice, Customer, Payment, Vendor, Sales, etc.
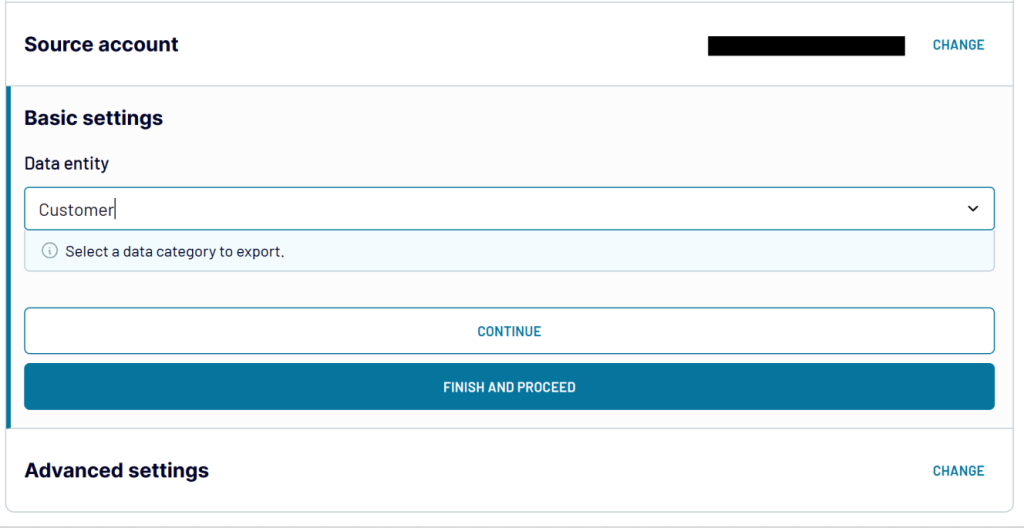
Click Finish and Proceed to move on.
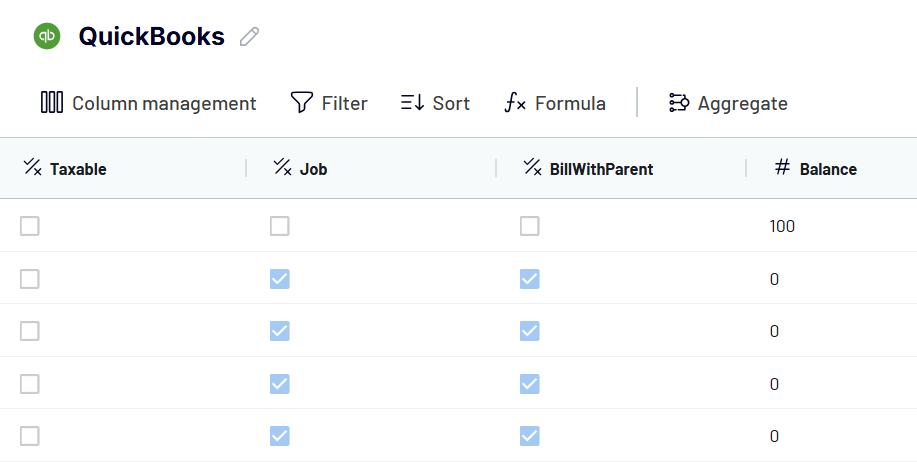
Step 2: Organize and transform data
In this step, you can review and transform your QuickBooks data to ensure it’s ready for analysis:
- Column Management – Hide irrelevant columns and rename those that require better descriptions.
- Filtering – Apply filters to only show specific data, such as invoices over a certain value.
- Sorting – Organize the data by key metrics, such as customer name or invoice amount.
- Formulas – Create custom columns by applying formulas to calculate additional metrics.
- Aggregate Data – Use operations like SUM, COUNT, AVERAGE, MIN, or MAX to calculate metrics and add results as new columns.
- Merging Data – Blend data from different QuickBooks accounts or combine it with related data from other accounting software (Xero) and other data sources.
Once you’re satisfied with the preview and transformations, click Proceed to continue.
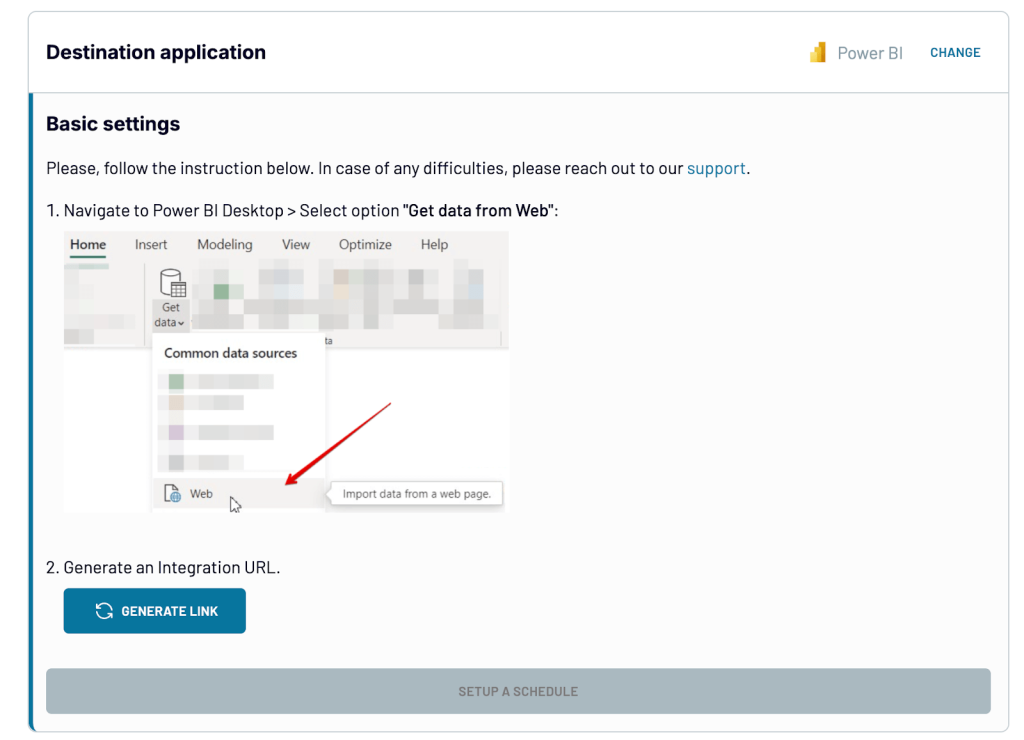
Step 3: Load data and schedule updates
Now it’s time to load your data into Power BI. Click the Generate Link button to create an integration URL and copy the link provided.
Then, enable Automatic Data Refresh and set your preferred schedule. You can choose the update frequency, specific days of the week for the refresh, and your time zone to ensure your reports are always updated as needed.
Once done, click Save and Run to send your QuickBooks data to Power BI.
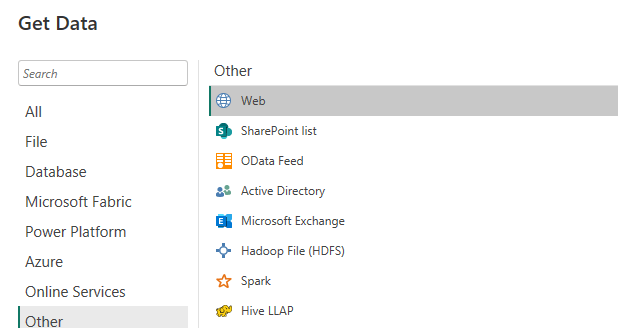
Paste the integration link that you copied earlier. In the Power Query Editor, you’ll see a preview of the data where you can make additional transformations if needed.
Once you’re done, load the data to Power BI to create visualizations and build custom reports. Power BI will then open the report canvas, where you can view QuickBooks data in pre-formatted charts and tables.
Coupler.io handles automatic syncing, keeping your data refreshed in near real-time for precise data analysis.
You might also find it useful to explore Coupler.io’s ready-made report template for QuickBooks.
Bonus: Free QuickBooks revenue dashboard template by Coupler.io
This pre-built revenue dashboard makes it easy to quickly turn your QuickBooks data into a live, interactive report in Power BI in just a few minutes. It’s perfect for business owners and accounting professionals who need a clear and simple way to stay on top of their finances.
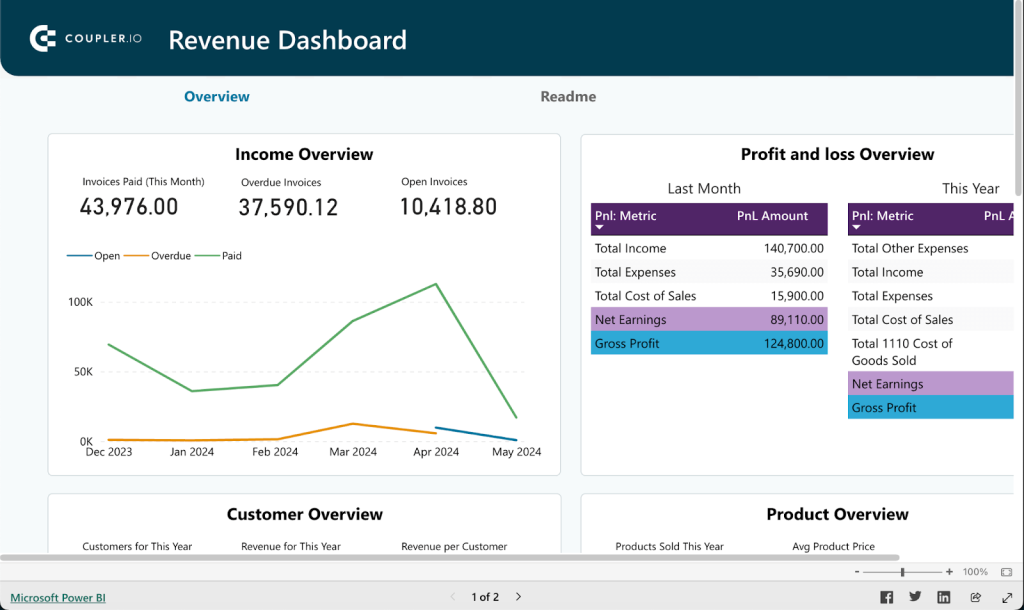
The Income Overview provides a year-long view of your revenue trends, making it easy to identify seasonal variations, peak income periods, or unexpected downturns. It also includes an Invoice Table that can be filtered by date, customer, or payment status.
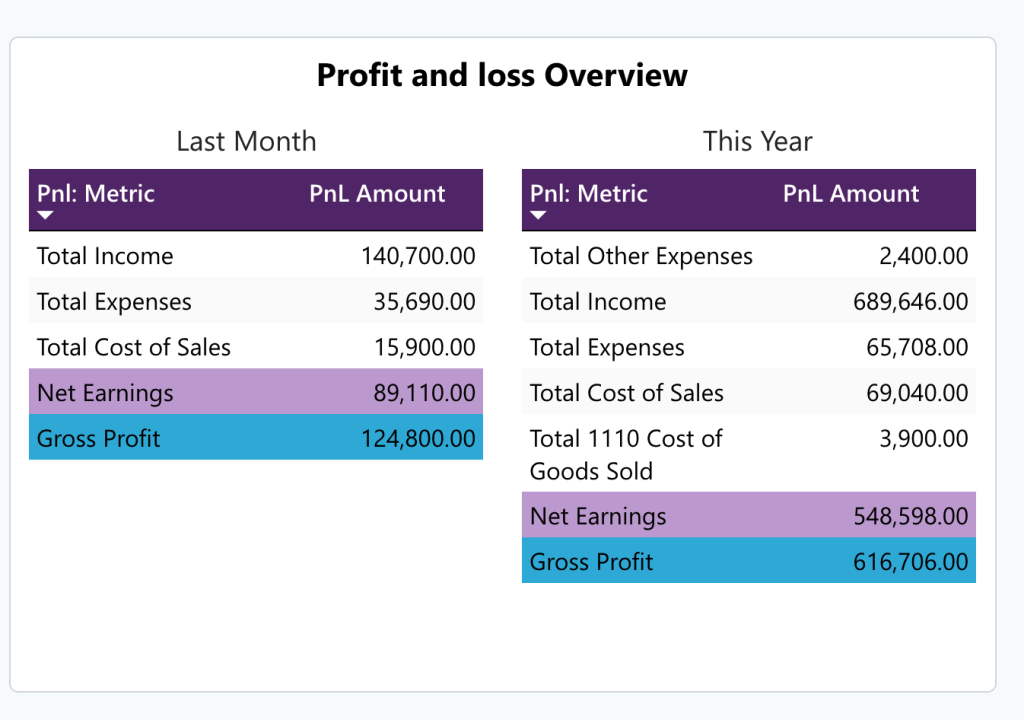
The Profit and Loss Overview complements this by comparing your income to your expenses, giving you the insights you need to ensure your budget stays balanced and your financial planning is on point.
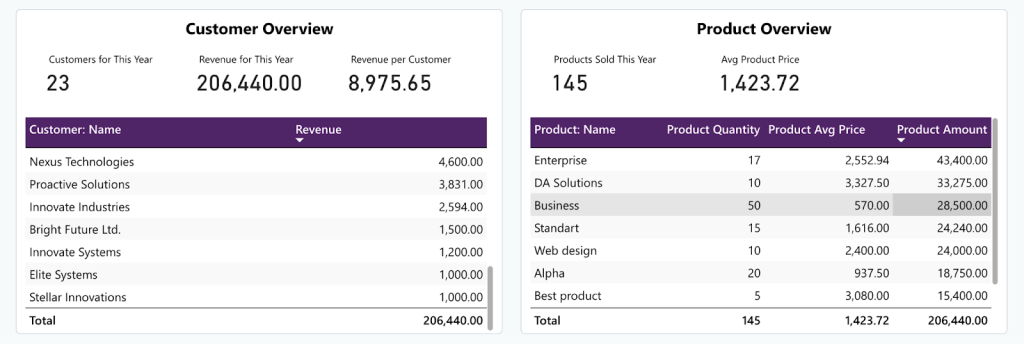
In the Customer Overview, the QuickBooks dashboard shows your most valuable clients, making it easy to decide where to direct targeted marketing campaigns or loyalty programs. Additionally, the Product Overview provides a snapshot of your best-selling products, helping you analyze your inventory and make data-driven decisions to boost sales performance.
To start using the template, open it and follow the steps described on the Readme tab. You will only need to connect your QuickBooks account. Coupler.io will then handle the rest, making sure your reports are always refreshed automatically, with no extra effort on your part.
Additionally, Coupler.io offers other free templates for Quickbooks reports for Looker Studio and Google Sheets.
Use the native Power BI connector to import QuickBooks
To use the native QuickBooks Online connector in Power BI, you need to meet the following prerequisites:
- Have an active QuickBooks Online account.
- Ensure your company is listed on the QuickBooks Company page.
- Go to Account and Settings via the Gear icon.
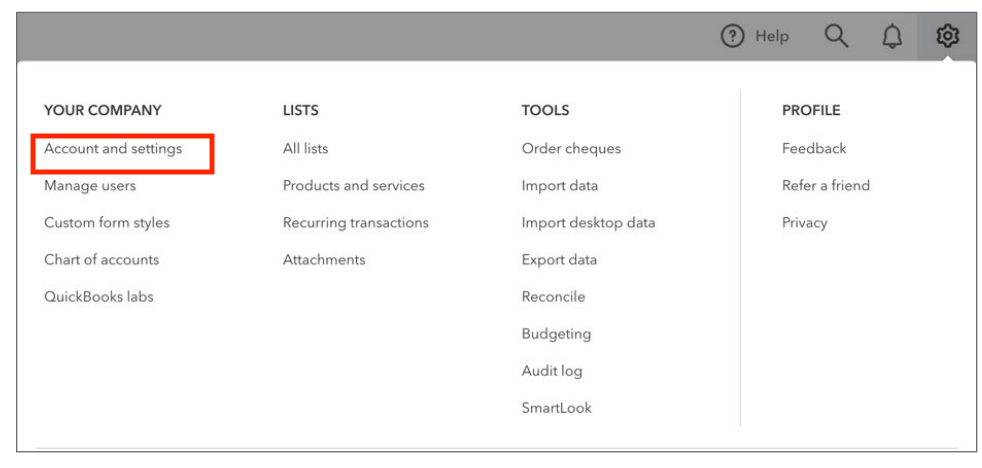
- Then, Complete the company information under the Company tab.
- Make sure your account has the Import capability enabled.
Once these requirements are met, you can set up a connection between QuickBooks Online data and Power BI by following these steps:
- Open the Get Data dialog box in Power BI, search for QuickBooks, and select QuickBooks Online (Beta) from the list.
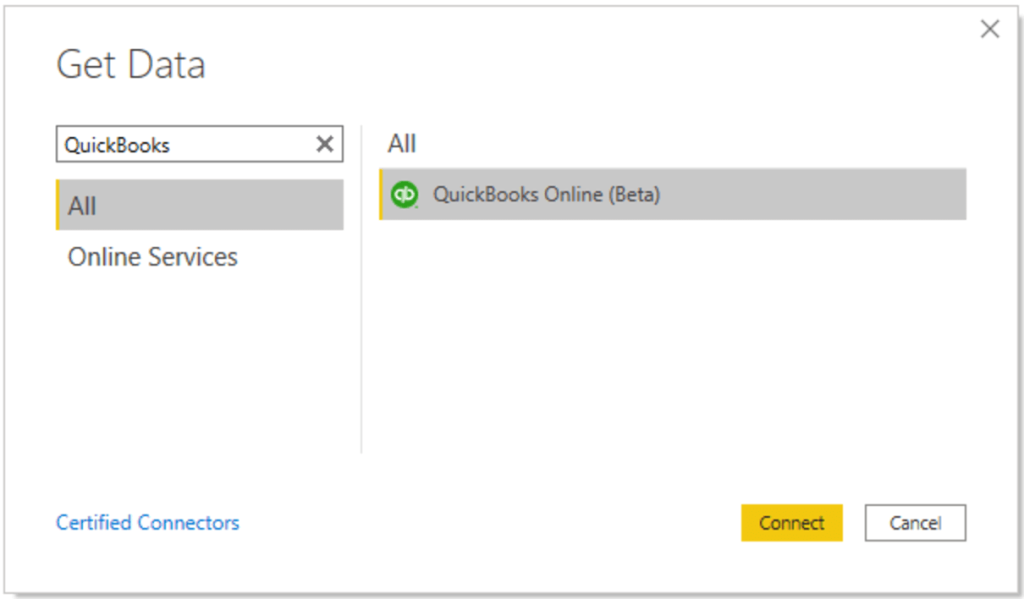
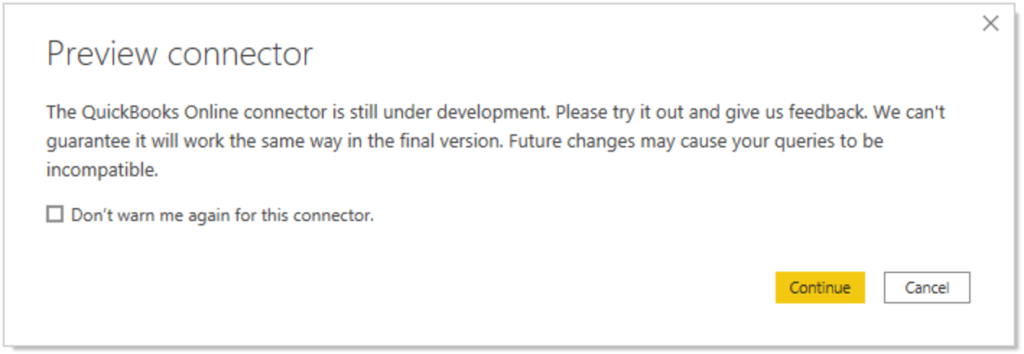
- Click Connect, then Continue in the preview connector prompt.
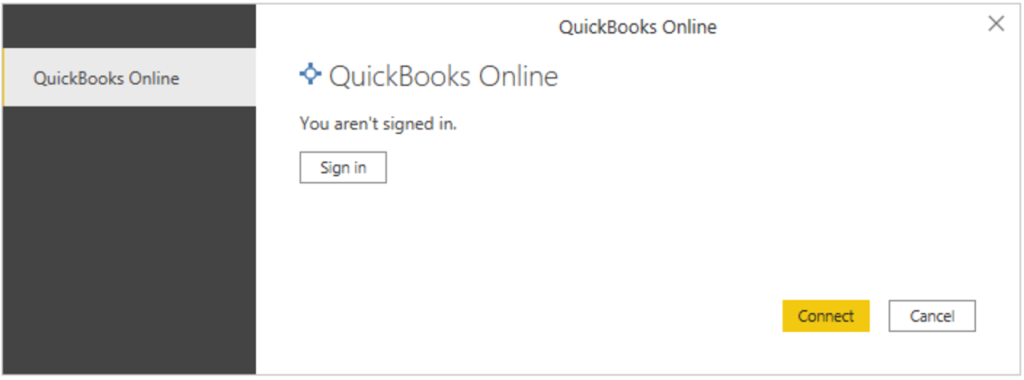
- Sign in to your QuickBooks Online account using your credentials. If prompted, complete the 2-Factor Authentication (2FA) to proceed.
- Select your company and click Next to proceed.
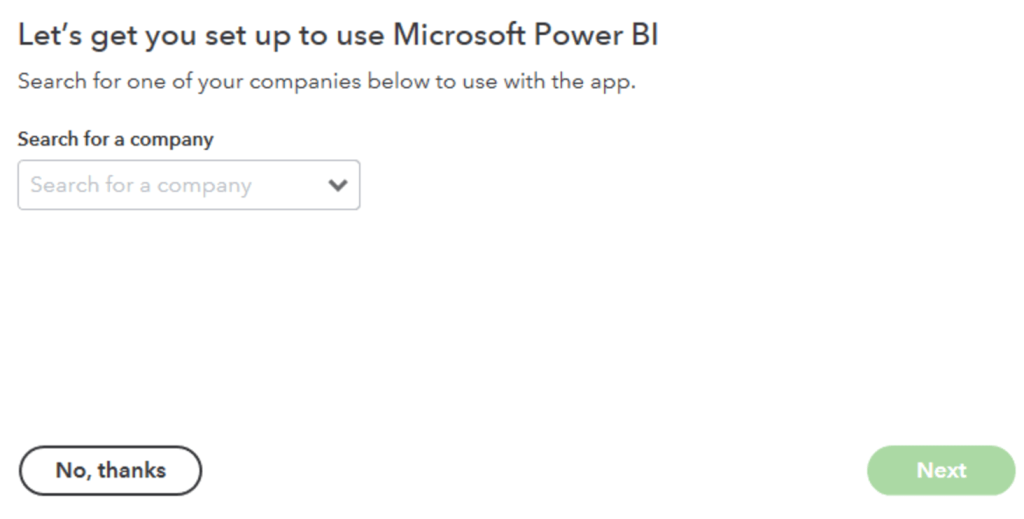
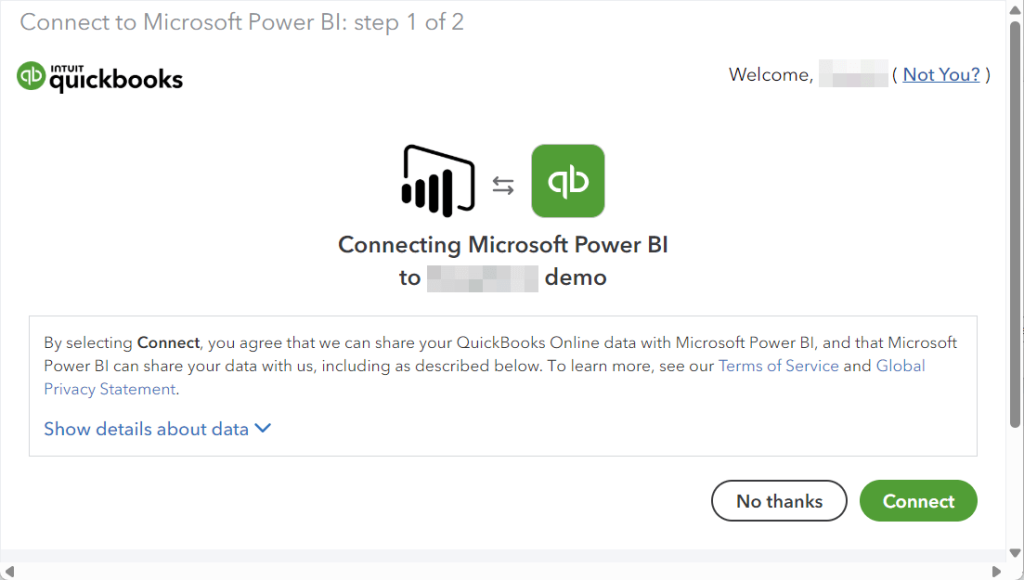
- After selecting your company, click Connect to link your QuickBooks account with Power BI.
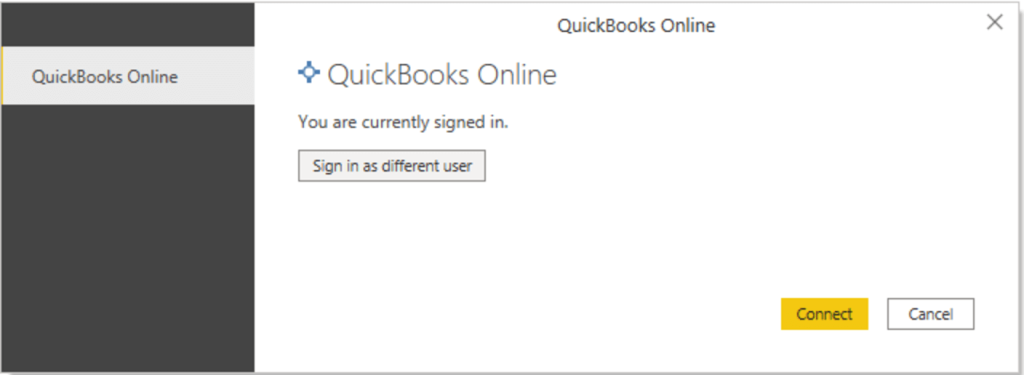
Then, you’ll need to confirm the connection in a modal window like this:
Once connected, the Navigator dialog box will appear, allowing you to select which QuickBooks tables you’d like to import.
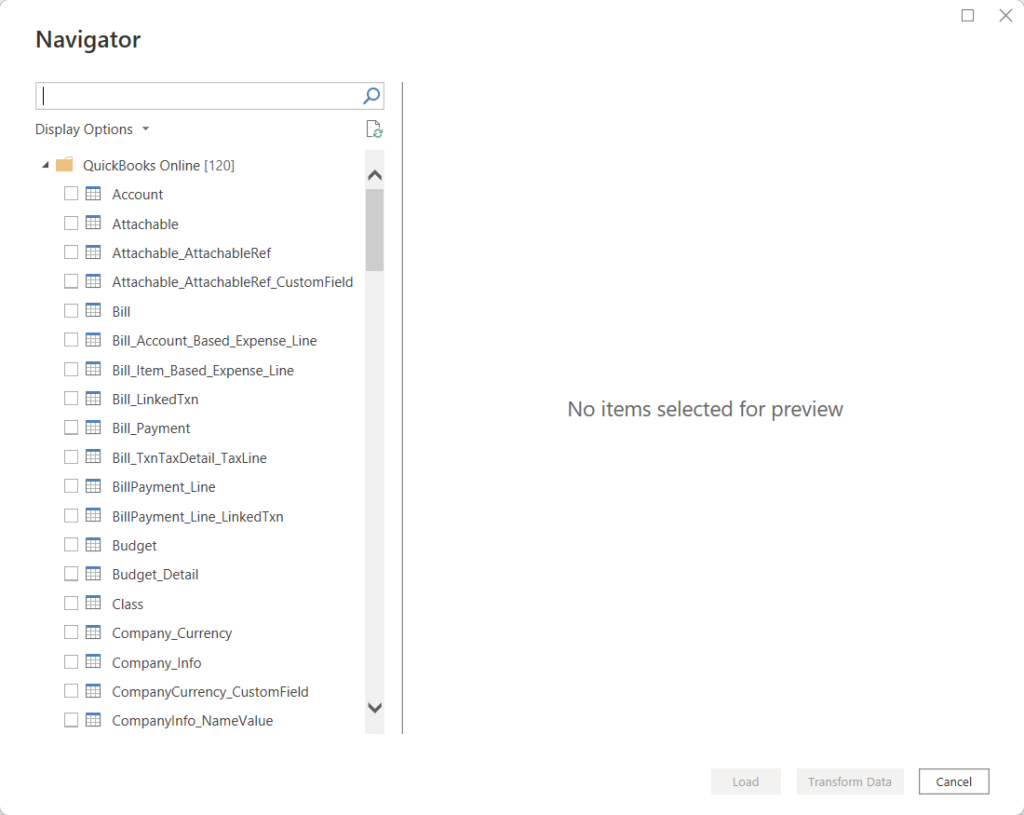
Before importing, you can make any necessary adjustments to ensure the data is ready for analysis. Click Transform Data for this.
Once you’re satisfied with the data, simply click Load to bring it directly into Power BI for financial data visualization.
With the native connector, working with large datasets may result in slow loading times and occasional connection timeouts. Tokens can expire frequently, requiring repeated reauthentication, which can disrupt workflows. Additionally, data does not always refresh automatically, meaning manual updates may be necessary. Some custom QuickBooks fields are not available on the connector, which can lead to missing transaction details. The preset data models are also inflexible, offering limited ability to modify relationships between tables. These limitations make the native connector less versatile for teams that require advanced, highly customized reporting.
Manually import your QuickBooks data as a .XLSX to Power BI
If you prefer a straightforward method without any connectors or automation tools, you can manually import your QuickBooks data from either QuickBooks Online or Desktop as an Excel file and upload it to Power BI. Here’s how:
Step1: Download Quickbooks data
From QuickBooks Online:
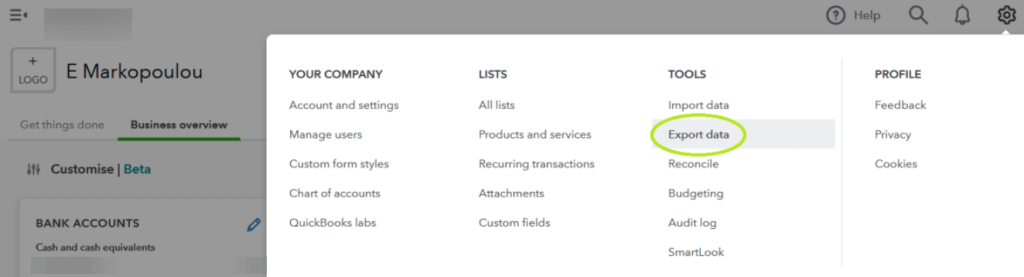
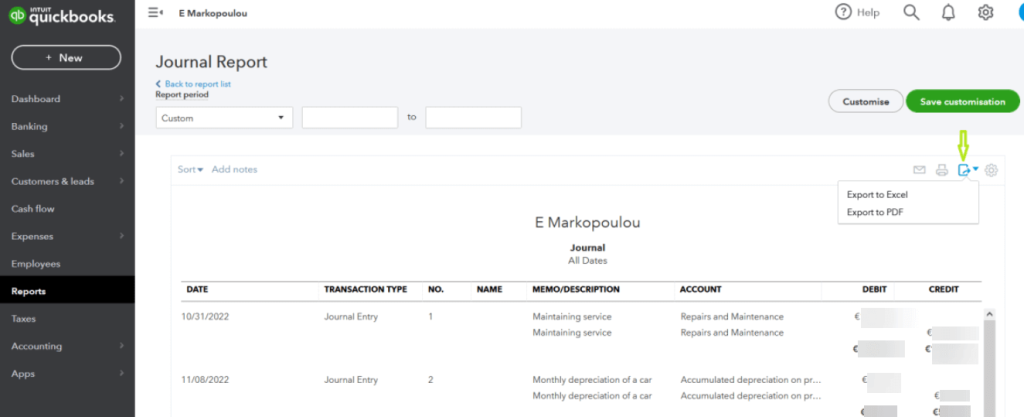
- Login into QuickBooks Online and locate the Gear icon in the top right corner of the screen.
- Select Export Data, the reason for exporting, and click Continue.
- Go to the Reports tab to choose the date range that fits your needs. You can also customize the data by toggling items in the Reports and Lists tabs.
- Finally, click Export to Excel to download the Excel file to your computer.
From QuickBooks Desktop:
- Open QuickBooks Desktop and navigate to the report you want to export.
- Click the Excel button at the top of the report and choose either Create New Worksheet or Update Existing Worksheet.
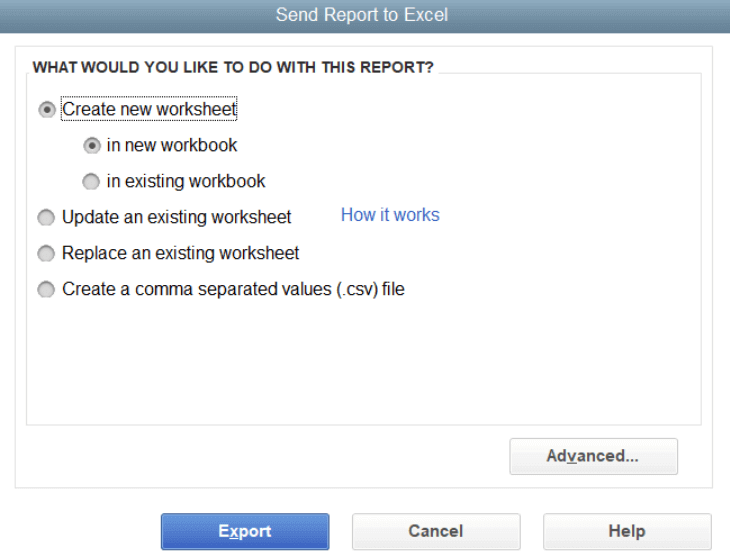
- Select your preferred format, either .xls or .xlsx, and click Export. Then, choose where you want to save the file on your computer.
Once you’ve exported your data from QuickBooks, you can proceed to upload it to Power BI.
Step 2: Import downloaded data to Power BI
- Open Power BI and click Get Data > Excel.
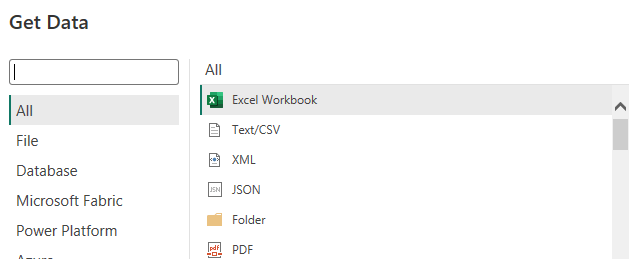
- Select the .XLSX file that you exported from QuickBooks and click Connect. A preview of the data model will be displayed in the Power Query Editor.
- Click Close & Apply to load your dataset into Power BI. Once the data is loaded, you can start building your report using Power BI’s visualization tools.
This manual method is simple and works well for occasional updates or smaller datasets. However, keep in mind that each time you need updated numbers, you’ll need to repeat this process, which becomes time-consuming for frequent financial reporting needs.
What’s the best method to visualize your financial data in Power BI: Recap
We’ve examined several methods for creating QuickBooks Power BI reports. Manual exports work for one-off reports but are not a feasible solution for regular reporting.
The native QuickBooks – Power BI connector is a straightforward option for exporting data. However, when working with large datasets, you may experience slow loading times, delays, and occasional connection timeouts. Also, some QuickBooks fields are not supported, which may result in incomplete data sync and missing transaction details.
If you’re comfortable with coding or have IT support, you can create custom integrations using the API, but this requires ongoing maintenance, which may not be feasible for all teams.
Another option is to use Coupler.io. This is a very reliable platform that offers a simple, user-friendly experience for data integration. It also includes ready-made templates to simplify creating reports.
Furthermore, Coupler.io supports importing data from multiple sources, allowing you to load data from several QuickBooks accounts or even combine data from different sources for your reports.
For more on this topic, see other articles on our blog:
-
- How to export data from QuickBooks
-
- Building a QuickBooks dashboard