Understanding what type of traffic your website receives is very important as it helps direct resources to the sources that lead to more engagement and conversions, which is important for your digital marketing strategy.
Referral traffic is one of those sources of website traffic yet it’s often not given as much importance as other sources like Google Organic, Paid Search, Paid Social, and Email.
What is referral traffic?
Referral traffic refers to visitors who arrive at your website from other websites, generally excluding direct visits and search engines.
For instance, when a visitor clicks a link from another website—such as a blog post, forum, or review site—to your website, that traffic is classified as referral traffic. It is important as it helps you understand brand exposure, measure the impact of SEO efforts, identify conversion opportunities, and gain insights into partnership performance.
What is the value of referral traffic?
Here are some of the benefits of having high referral traffic:
- It shows that your brand is well-known as it’s mentioned on many different websites. If these are reputable sites, it helps build trust in your brand.
- If the referral traffic is from niche websites, then it signals that visitors are interested in what you’re offering.
- Getting backlinks or mentions on reputable websites is also good for your SEO as it signals to search engines that your site is trustworthy and provides value.
- Visitors from niche referral sites often have high intent, i.e. they are more likely to convert, which can boost your conversion rate.
- It doesn’t cost as much as spending on different marketing campaigns and has a long-term effect on bringing traffic to your site.
- It can open doors to form meaningful partnerships with referral traffic sources that link to your site quite often as they have already shown their trust in your website.
Right, but who are the major referrers? Let’s look into that, next.
Major sources of referral traffic
To provide more context, let’s look at some numbers. A study of around 170 sites revealed that around 63.5% of referral traffic in the US comes from Google.com, making it the single largest referrer.
Other major players include: Microsoft/Bing (7.21%), YouTube (3.57%), Facebook (3.54%), Reddit (2.95%), and Twitter (2.35%).
Yahoo and DuckDuckGo contribute 1.90% and 1.86%, respectively, but what’s particularly interesting is that sites like Amazon, Wikipedia, Instagram, and LinkedIn each contribute less than 1%.
Now, Google is at the top because of the popularity of its domains, such as Gmail, Google Docs, Google Meet, etc.
So, the remaining 150-plus websites combined only contributed slightly over 10%. Interesting stuff isn’t it? Just shows you the scale of top referrers.
However, this doesn’t mean that you’ll be getting referrals from these sites, or if you don’t see them in your referral list, then there’s something wrong.
Your site’s referral traffic will depend on the type of business/industry you operate in and the marketing efforts you put in place.
Therefore, you should have your own customized reports to look at the referral traffic along with relevant metrics to measure the performance of your referrers.
If you’re interested in learning more, the next section will be very useful.
Templates to analyze referral traffic
We’re going to look at some templates created by the Coupler team that can make your life easier when it comes to analyzing referral traffic. Let’s begin.
1. Referral traffic in Google Sheets
The first one is in Google Sheets, so if you’re keen on using spreadsheets this one is for you. It’s a simple one-page dashboard that helps you understand where your visitors are coming from and how they are interacting with your site. It pulls data from Google Analytics 4.

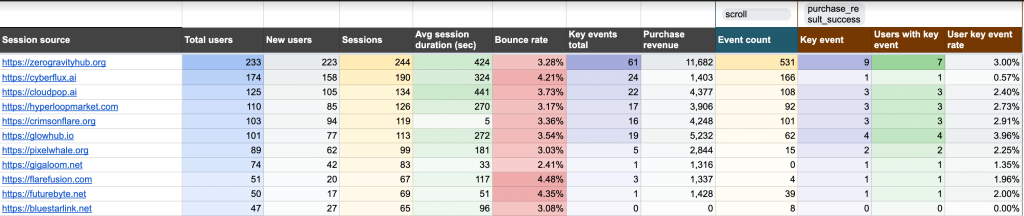
What metrics does this dashboard track?
In total, it shows data for the following eight metrics:
- Total & New Users – How many people are coming from referral sources?
- Sessions & Session Duration – How often do they visit and how long do they stay?
- Bounce Rate – Are they sticking around or leaving quickly?
- Key Events & Conversions – Are they signing up, purchasing, or engaging with your site? The template allows you to choose relevant events, e.g. Add to Cart and Purchase for e-commerce, or Signup and Form Submission for SaaS businesses. Obviously, you can use any other events that you are tracking thanks to the event picker in the top right corner.
- Revenue – Which referral sources bring in the most revenue?
How does this dashboard help you win with referral traffic?
Here’s how you can win with referral traffic using this dashboard:
- Identify your top referral sources – Find out which websites send the most engaged visitors and double down on what works.
- Improve engagement – Compare bounce rates and session times to fine-tune your content and keep visitors engaged.
- Spot top converters – Knowing which referrals drive more conversions can help you invest more in top-performing ones.
- Track actions that matter – You can zoom into the actions or key events that matter to you as the template allows you to choose one event and one key event.
Don’t forget to check out the ‘Readme’ tab to get yourself started quickly!
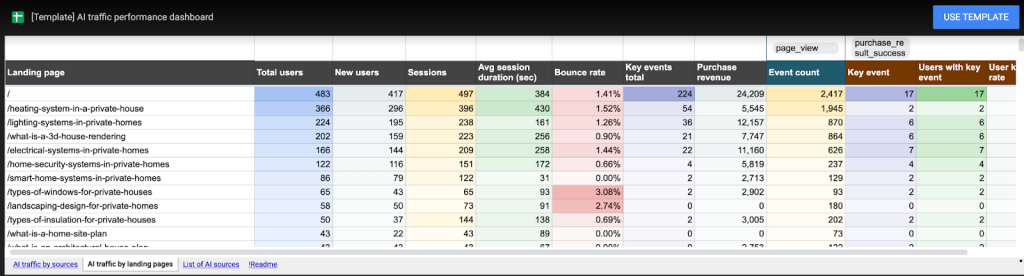
2. AI referrals in Google Sheets
This dashboard is quite similar to the one discussed above and also pulls data from Google Analytics 4. The major difference, as you might have guessed, is that it only looks at the AI referrals.

What metrics does this dashboard track?
This template also measures the same metrics as the one above, but this time you’re looking at how different AI sites/tools compare against each other when analyzing these metrics.
How does this dashboard help you win with referral traffic?
To be specific, let’s look at how this dashboard can help you win with AI referral traffic:
- Compare the performance of AI tools – You can look at how each tool contributes to driving more traffic (users and sessions) and engagement.
- Impact of AI tools on conversions – It can be helpful to find out if AI tools are driving conversions or just traffic so you can adjust your strategy accordingly.
- Understand where visitors are landing – Using this dashboard, you can find out what landing pages are popular, i.e. the homepage or some other deeper pages being used by AI tools to reference your site. If so, you can expand on that type of content.

- Which AI sources bring engaged visitors – This can help you get an idea about engagement by looking at things like session duration, bounce rate, and any other engagement events you’re tracking, e.g. cta clicks.
- Revenue generation – Find out if you’re generating any revenue due to these tools. If so, you can look into how to maximize this.
The ‘List of AI Sources’ tab helps you look at the sources this dashboard tracks.
The next template is for people who get a lot of traffic from YouTube.
3. Referral traffic from YouTube
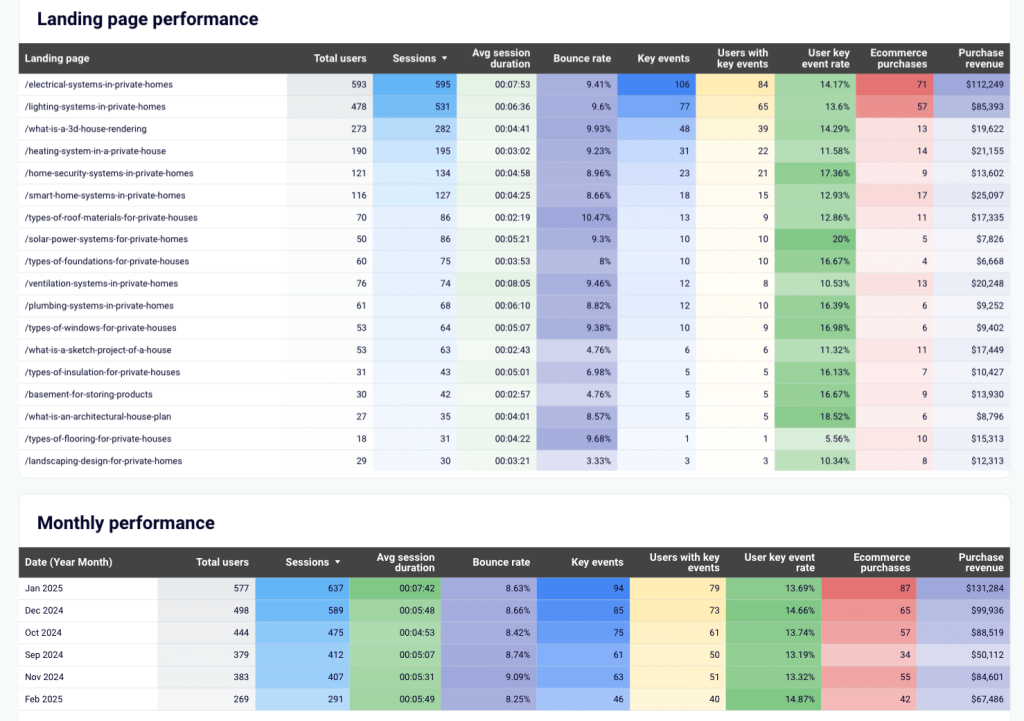
This dashboard is quite handy for looking at different performance metrics regarding referral traffic from YouTube by getting data from Google Analytics 4.

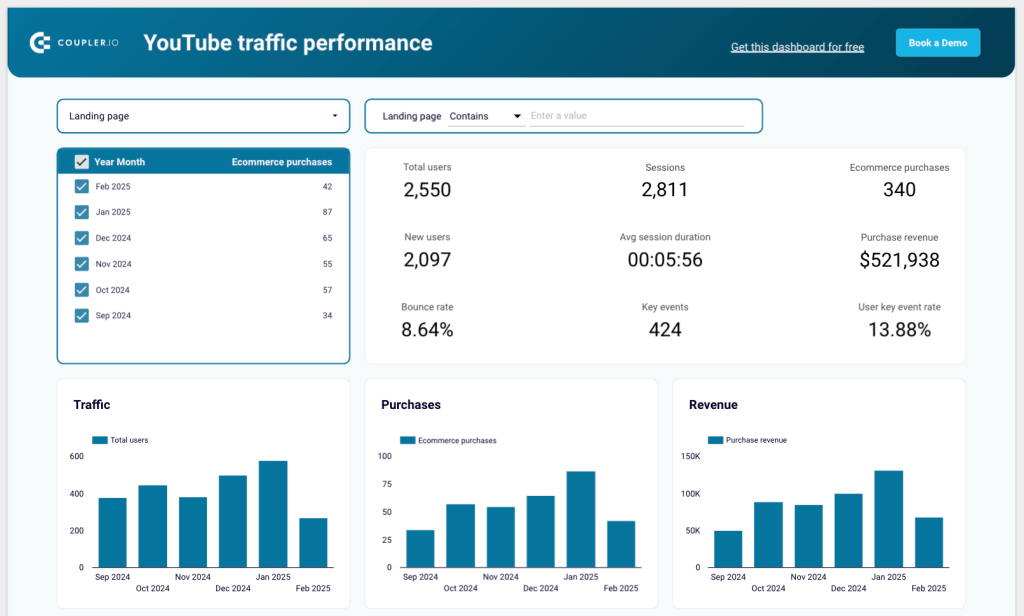
It’s effective at helping you understand how well your YouTube strategy is performing when it comes to bringing in traffic, engagement, and/or revenue.
What metrics does this dashboard Track?
You can analyze the performance based on nine metrics. These are:
- Sessions, total users, and new users – To understand how much traffic you get from your YouTube videos.
- Avg. session duration and bounce rate – To measure the user engagement after they land on your site.
- User key event rate and key events – To help you understand how many conversions and/or how many users are converting when they come from YouTube.
- E-commerce purchases and Purchase revenue – Quite helpful if you have an e-commerce website, but even if you’re selling a service or just one type of thing, you can at least measure the revenue these visitors bring in.
How does this dashboard help you win with referral traffic?
Let’s talk about how it can help you:
- Find out what pages/content types bring engagement and revenue. You can then focus on those vs spending resources on ineffective pages.
- Once you find out what type of videos are directing users to pages that perform better, you can focus on creating that type of content.
- The monthly view can be a good way to analyze your content calendar’s performance, e.g. how videos launched in November performed. You can even compare and see if certain content types have more engagement in one month than others.

How you use this dashboard comes down to what your end goal with YouTube is, so identifying that goal is a good starting point.
The dashboard template is available for Looker Studio and Google Sheets. Pick the one you like most and try it for free!
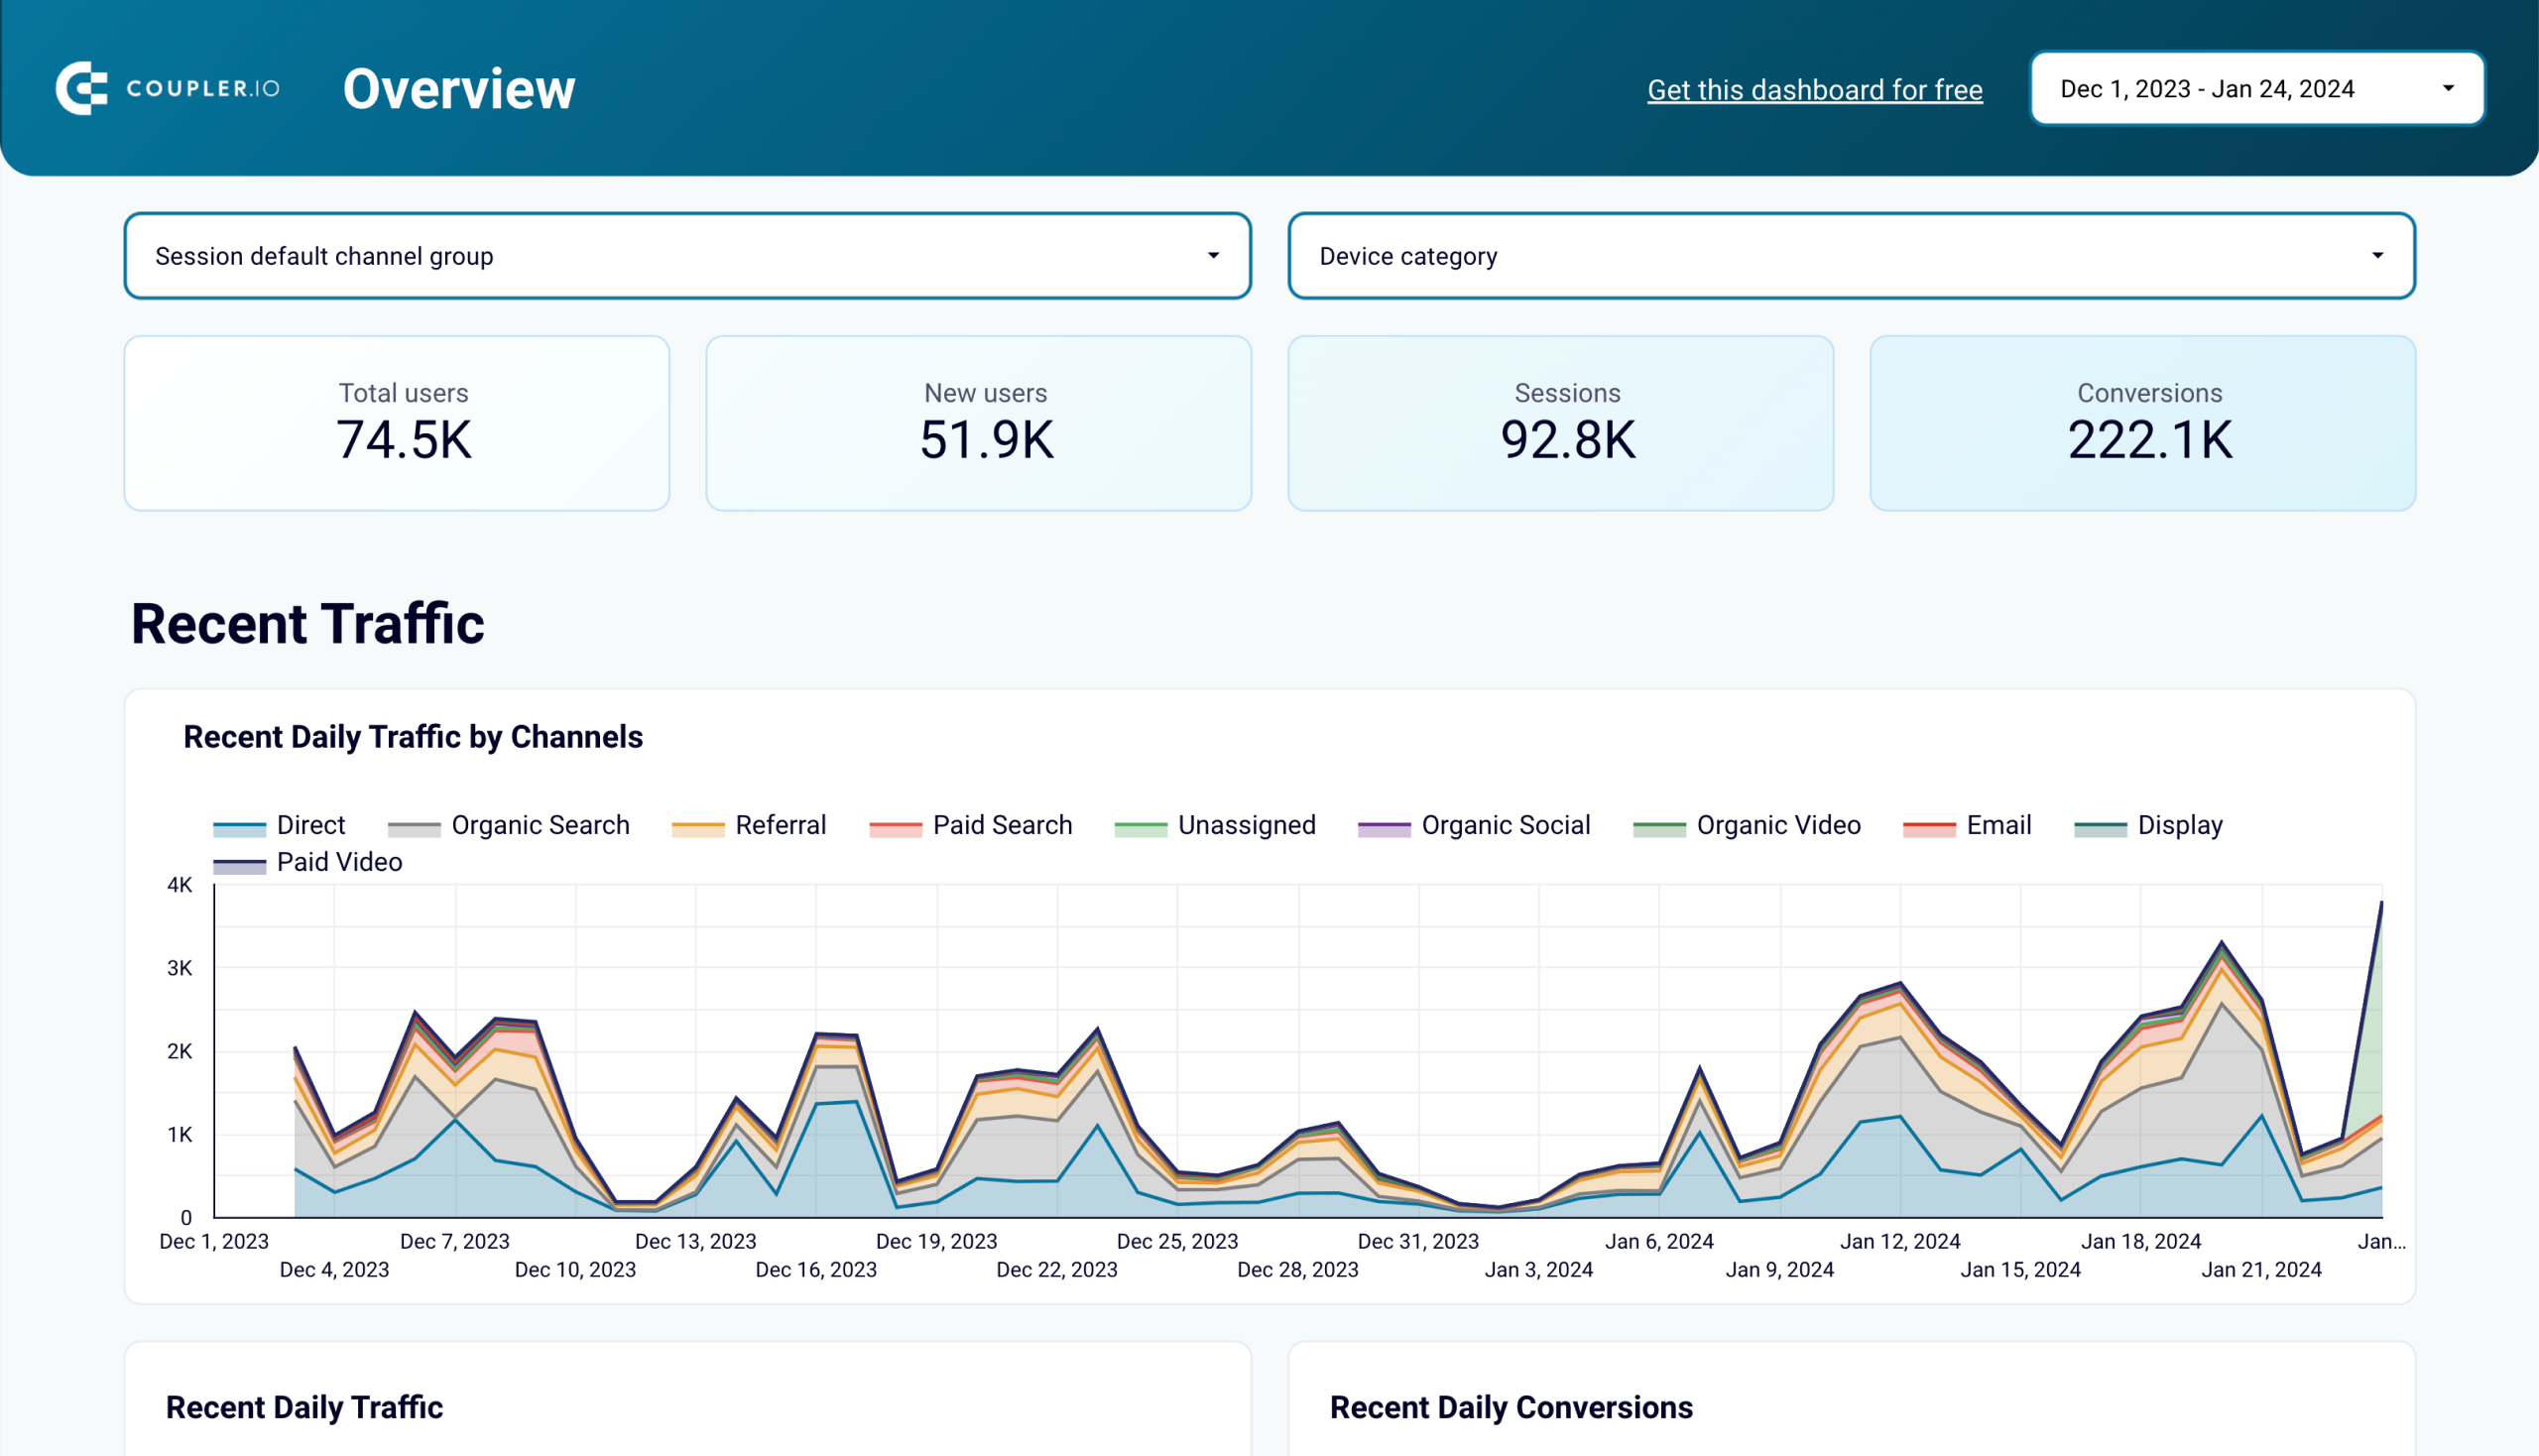
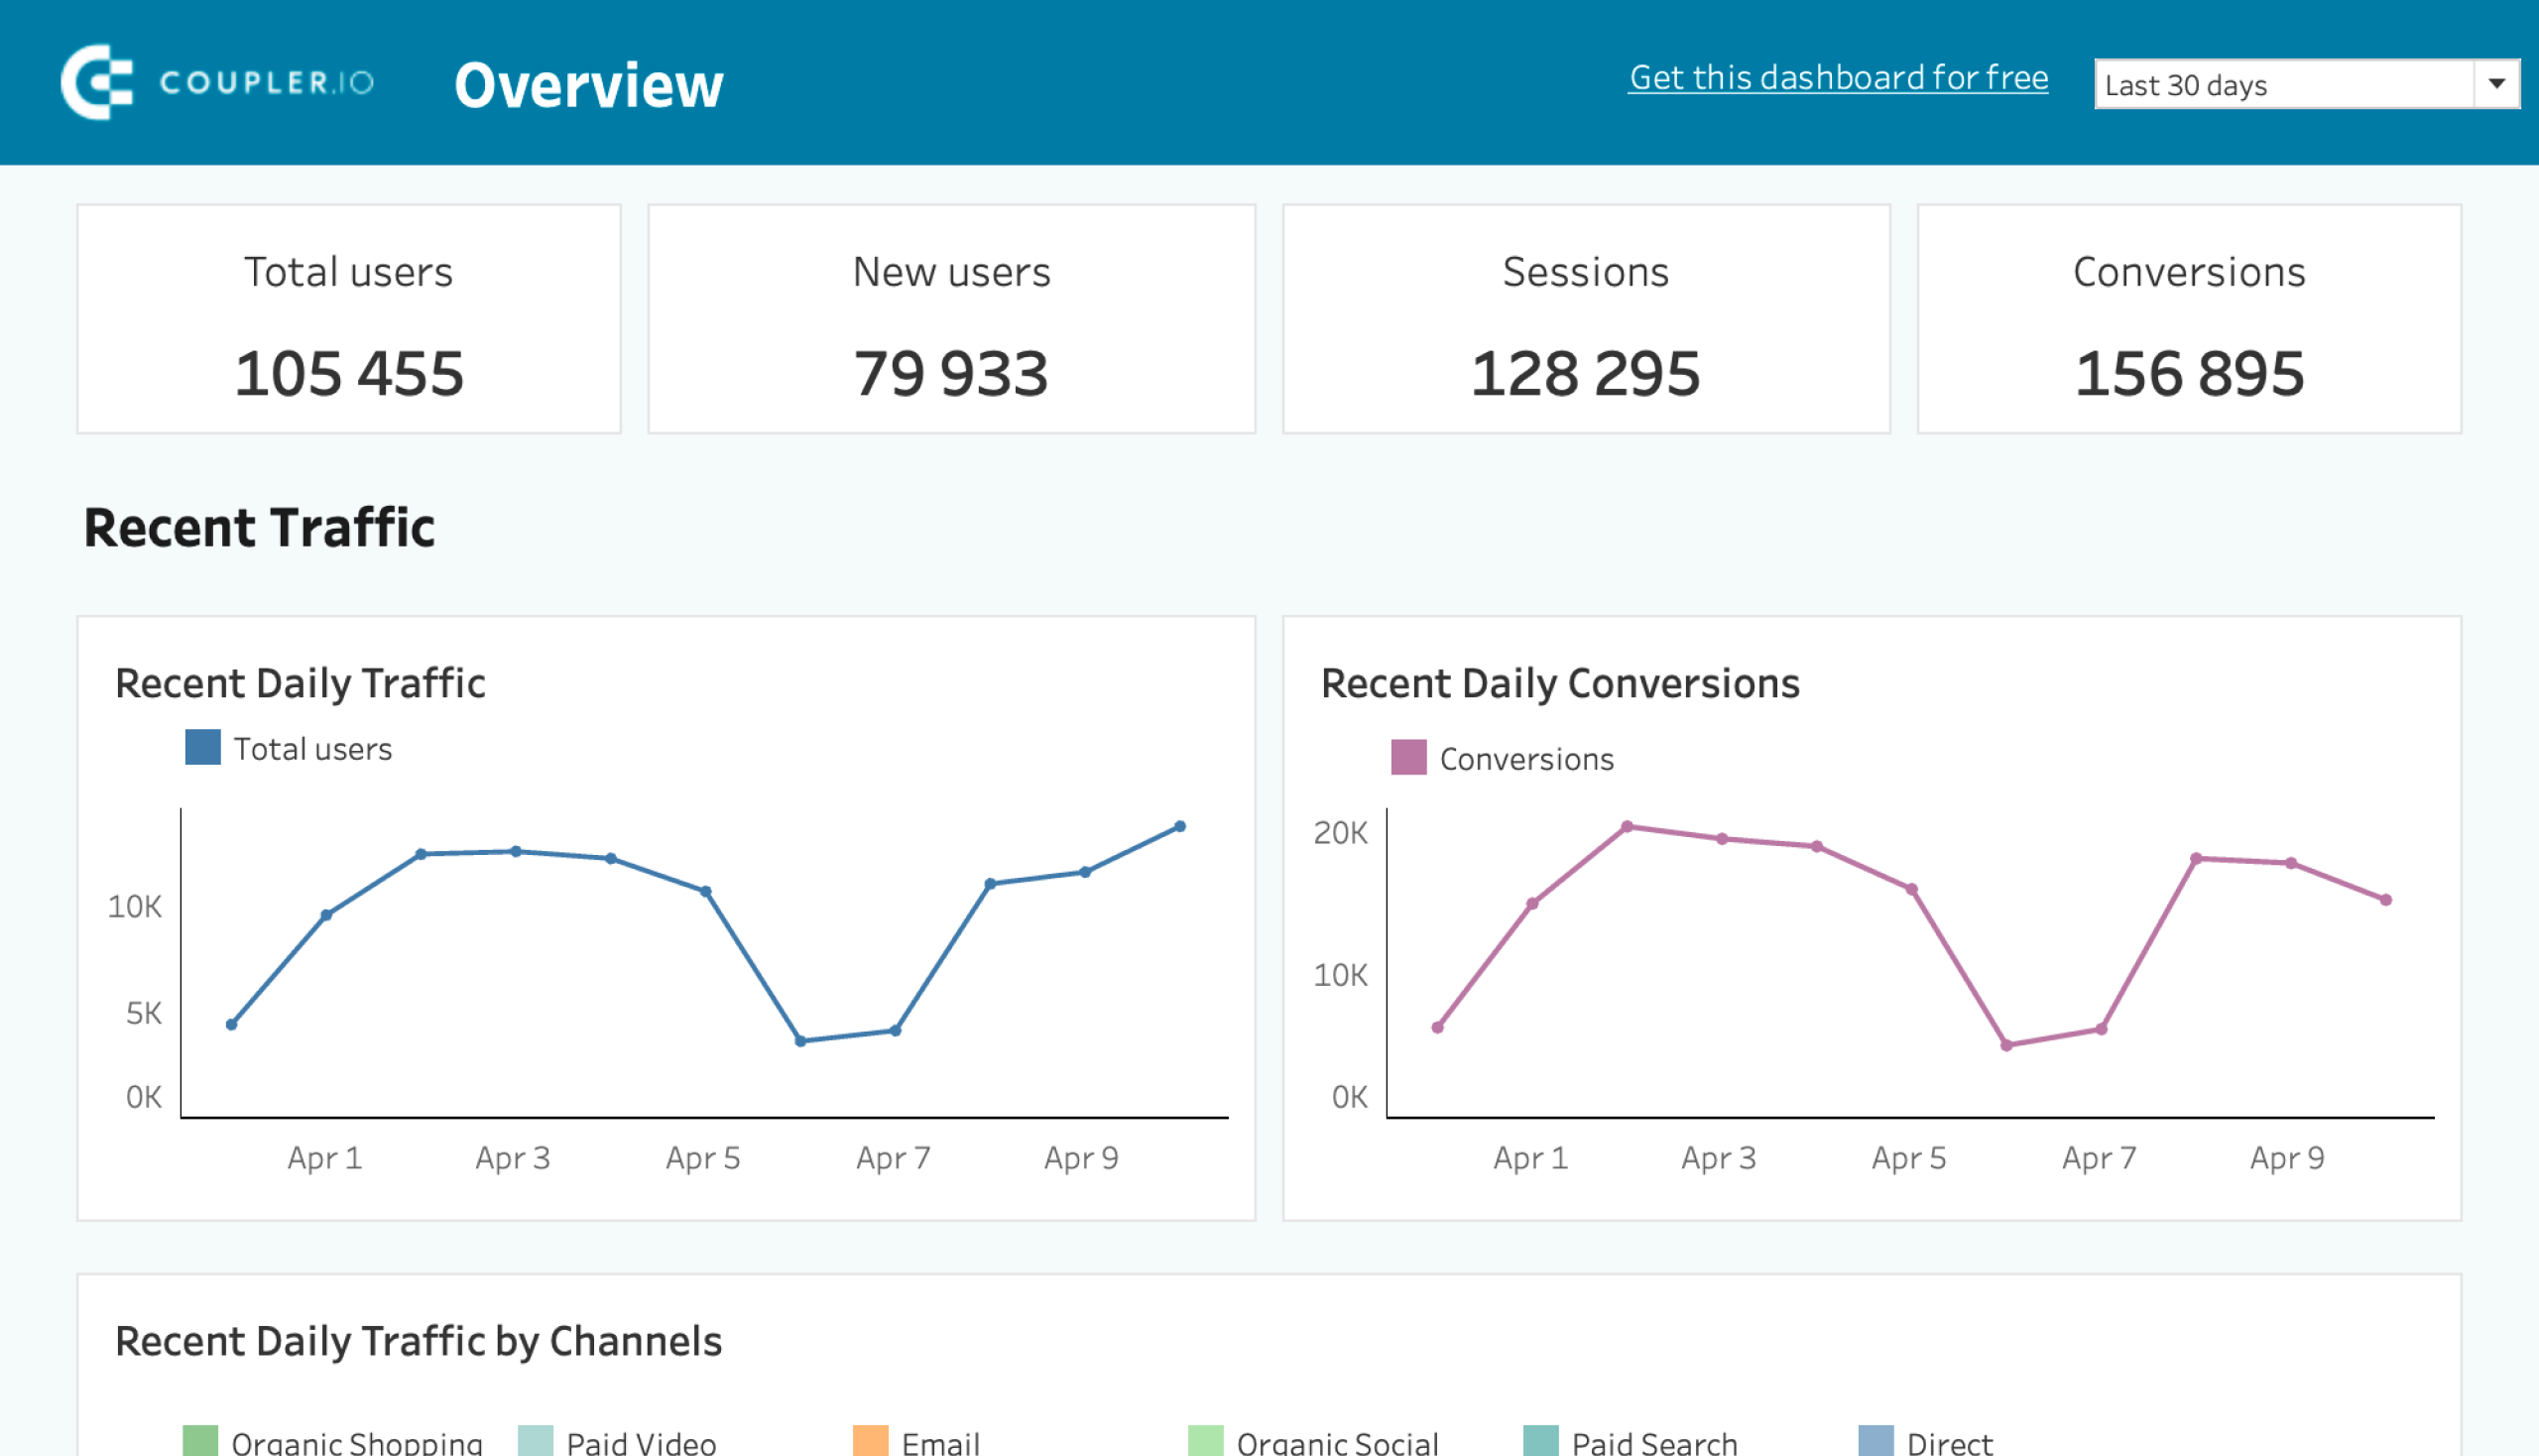
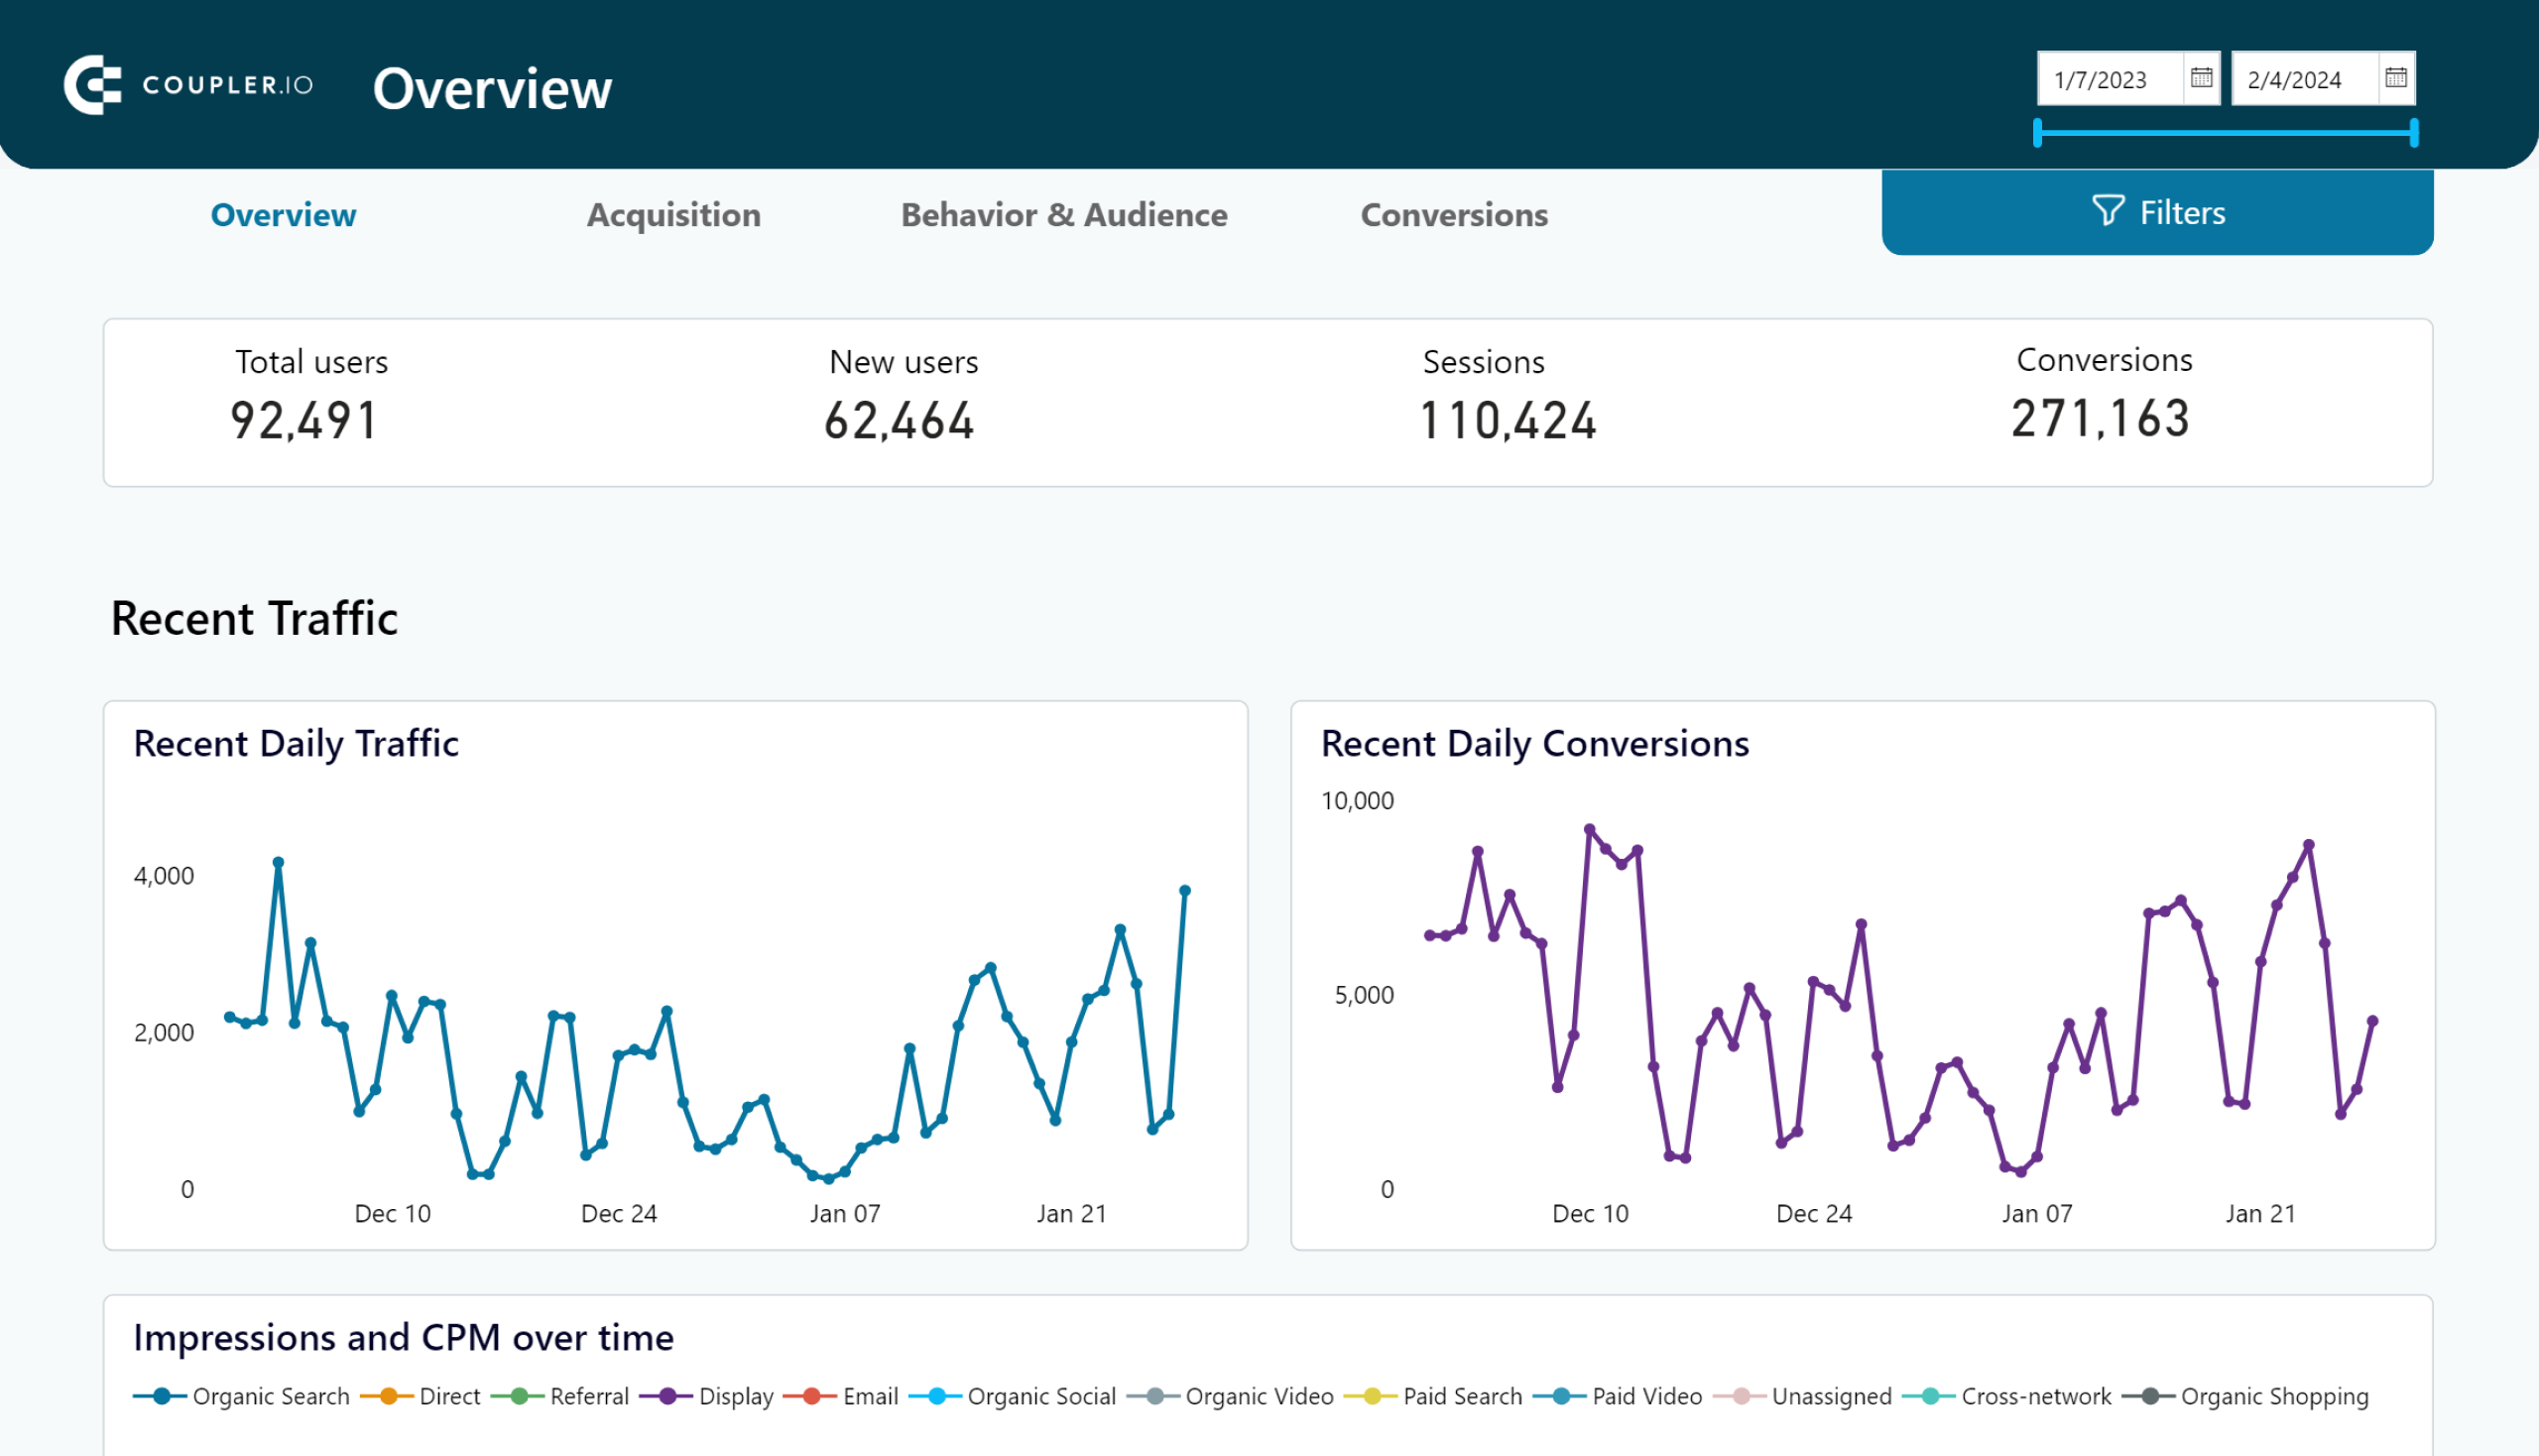
4. Web analytics dashboard
Another dashboard but one that’s quite comprehensive in nature as it doesn’t only look at the referral traffic.

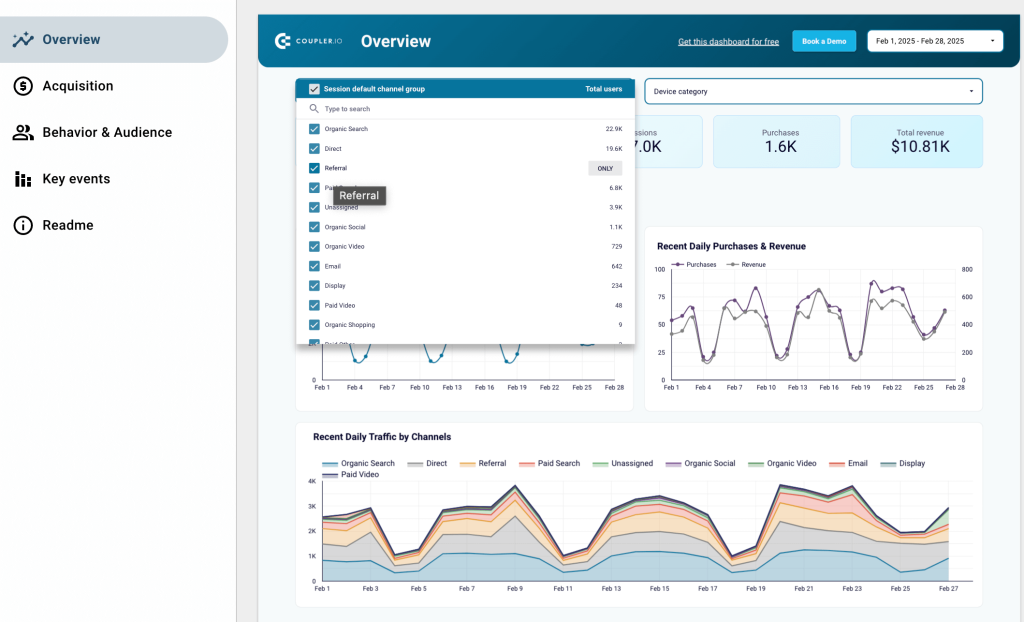
Powered by Google Analytics 4, it shows daily, weekly, and monthly overviews of your website’s key performance metrics.
What metrics does this dashboard track?
You can track the following fourteen metrics with this dashboard:
- Total users, New users, Active users, and Sessions – To understand traffic growth.
- Average engagement time per session, Average engagement time per user, Views, Views per user, Engaged sessions per user, and Event count – To measure engagement.
- Key events, Key event rate, Total purchases, and Total revenue – To analyze the effectiveness of campaigns and the website in generating conversions and revenue.
This means you can use this dashboard to analyze quite a few things.
How does this dashboard help you win with referral traffic?
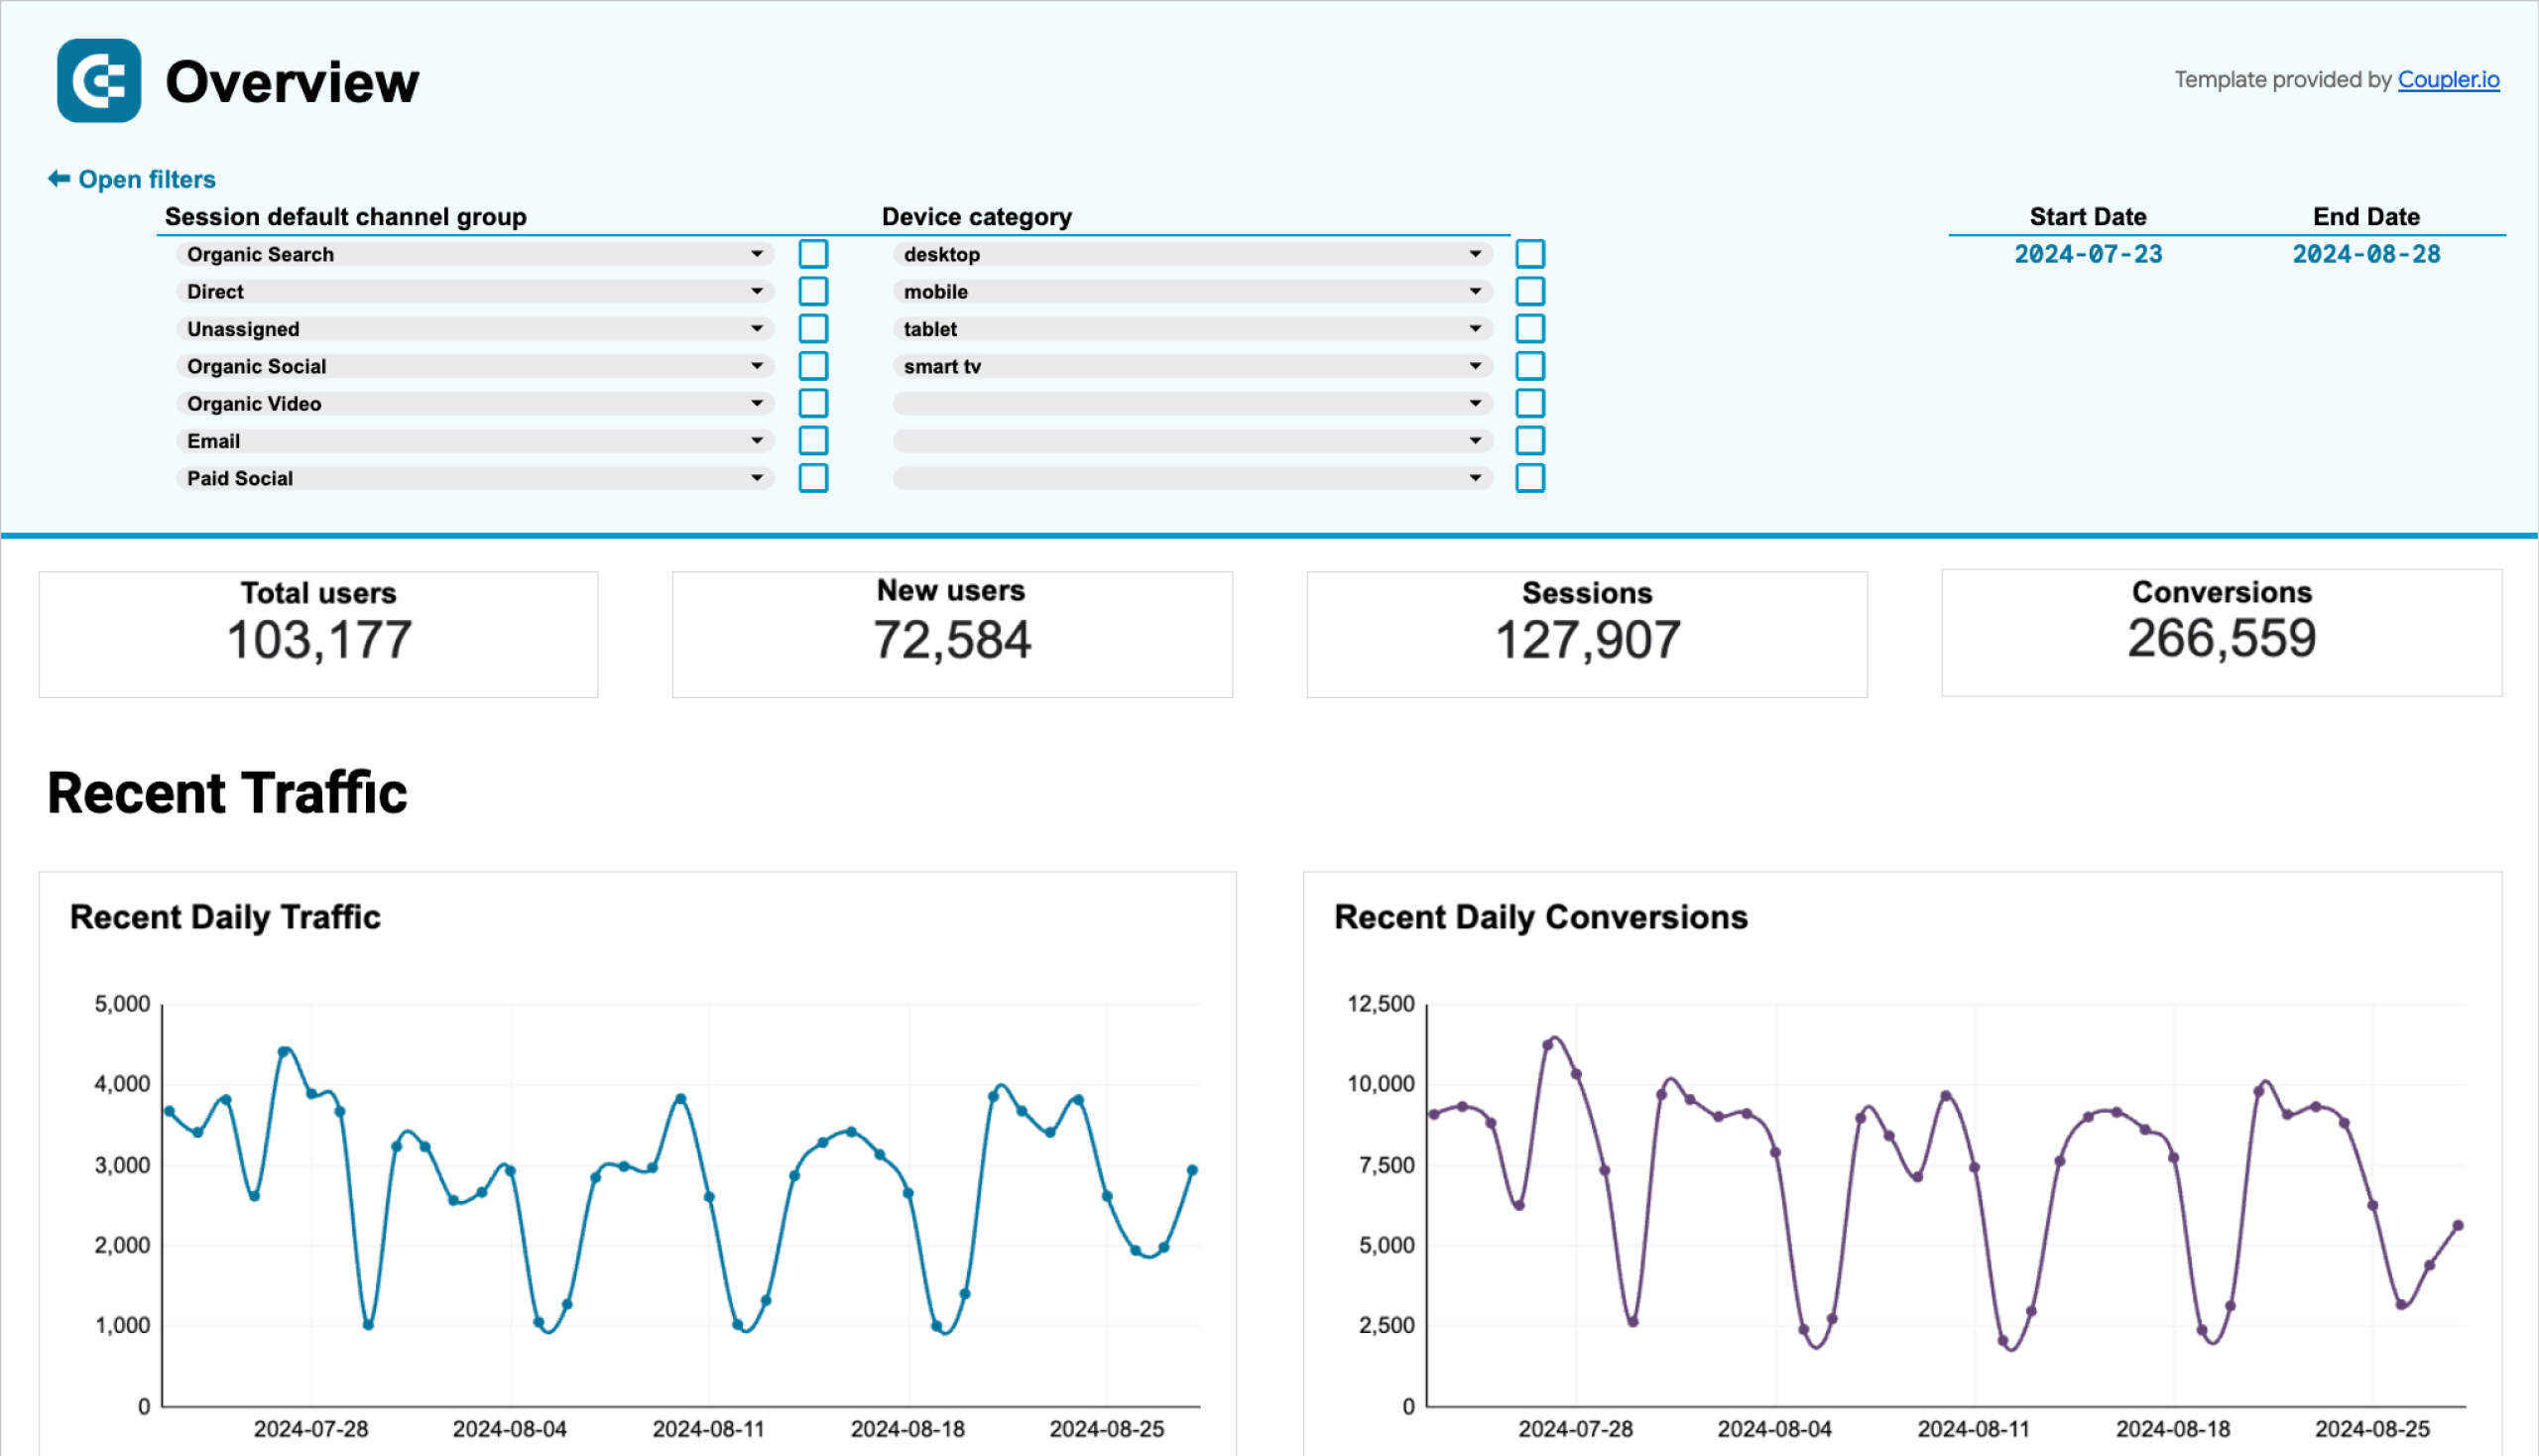
In all reports, you can filter the traffic by ‘Referral’ as your Default channel group, unlocking several key insights:
- Quickly spot any spikes or dips in key metrics. It helps you stay on top of things so you can take timely action.
- You can analyze the performance of specific referral sources in the Acquisition report by choosing it from the ‘Session source/medium’ filter. This helps to get granular insights.
- Measure how visitors behave on your landing and other website pages with the Behavior & Audience report.
- Understand which referral sources are bringing in conversions and revenue, these are the ones you want to focus on.
This dashboard template is available in Power BI, Tableau, Looker Studio, and Google Sheets. Pick the version you like most and connect to your GA4 property through the built-in connector by Coupler.

Web analytics dashboard in Looker Studio
Use the insights based on the data from GA4 to monitor your website traffic and discover which pages resonate most with your audience.

Web analytics dashboard in Tableau
Monitor the performance of your traffic, analyze the conversion funnel, and derive other insights from Google Analytics 4.
Web analytics dashboard in Power BI
Discover insights into your website’s traffic acquisition, audience, and conversions with Google Analytics 4 data seamlessly connected to our Power BI dashboard template.

Web analytics dashboard in Google Sheets
Gain valuable insights into your website’s traffic sources, user interactions, and conversion metrics based on data from GA4.
Let’s look at our final template which also covers a lot more than just referral traffic.
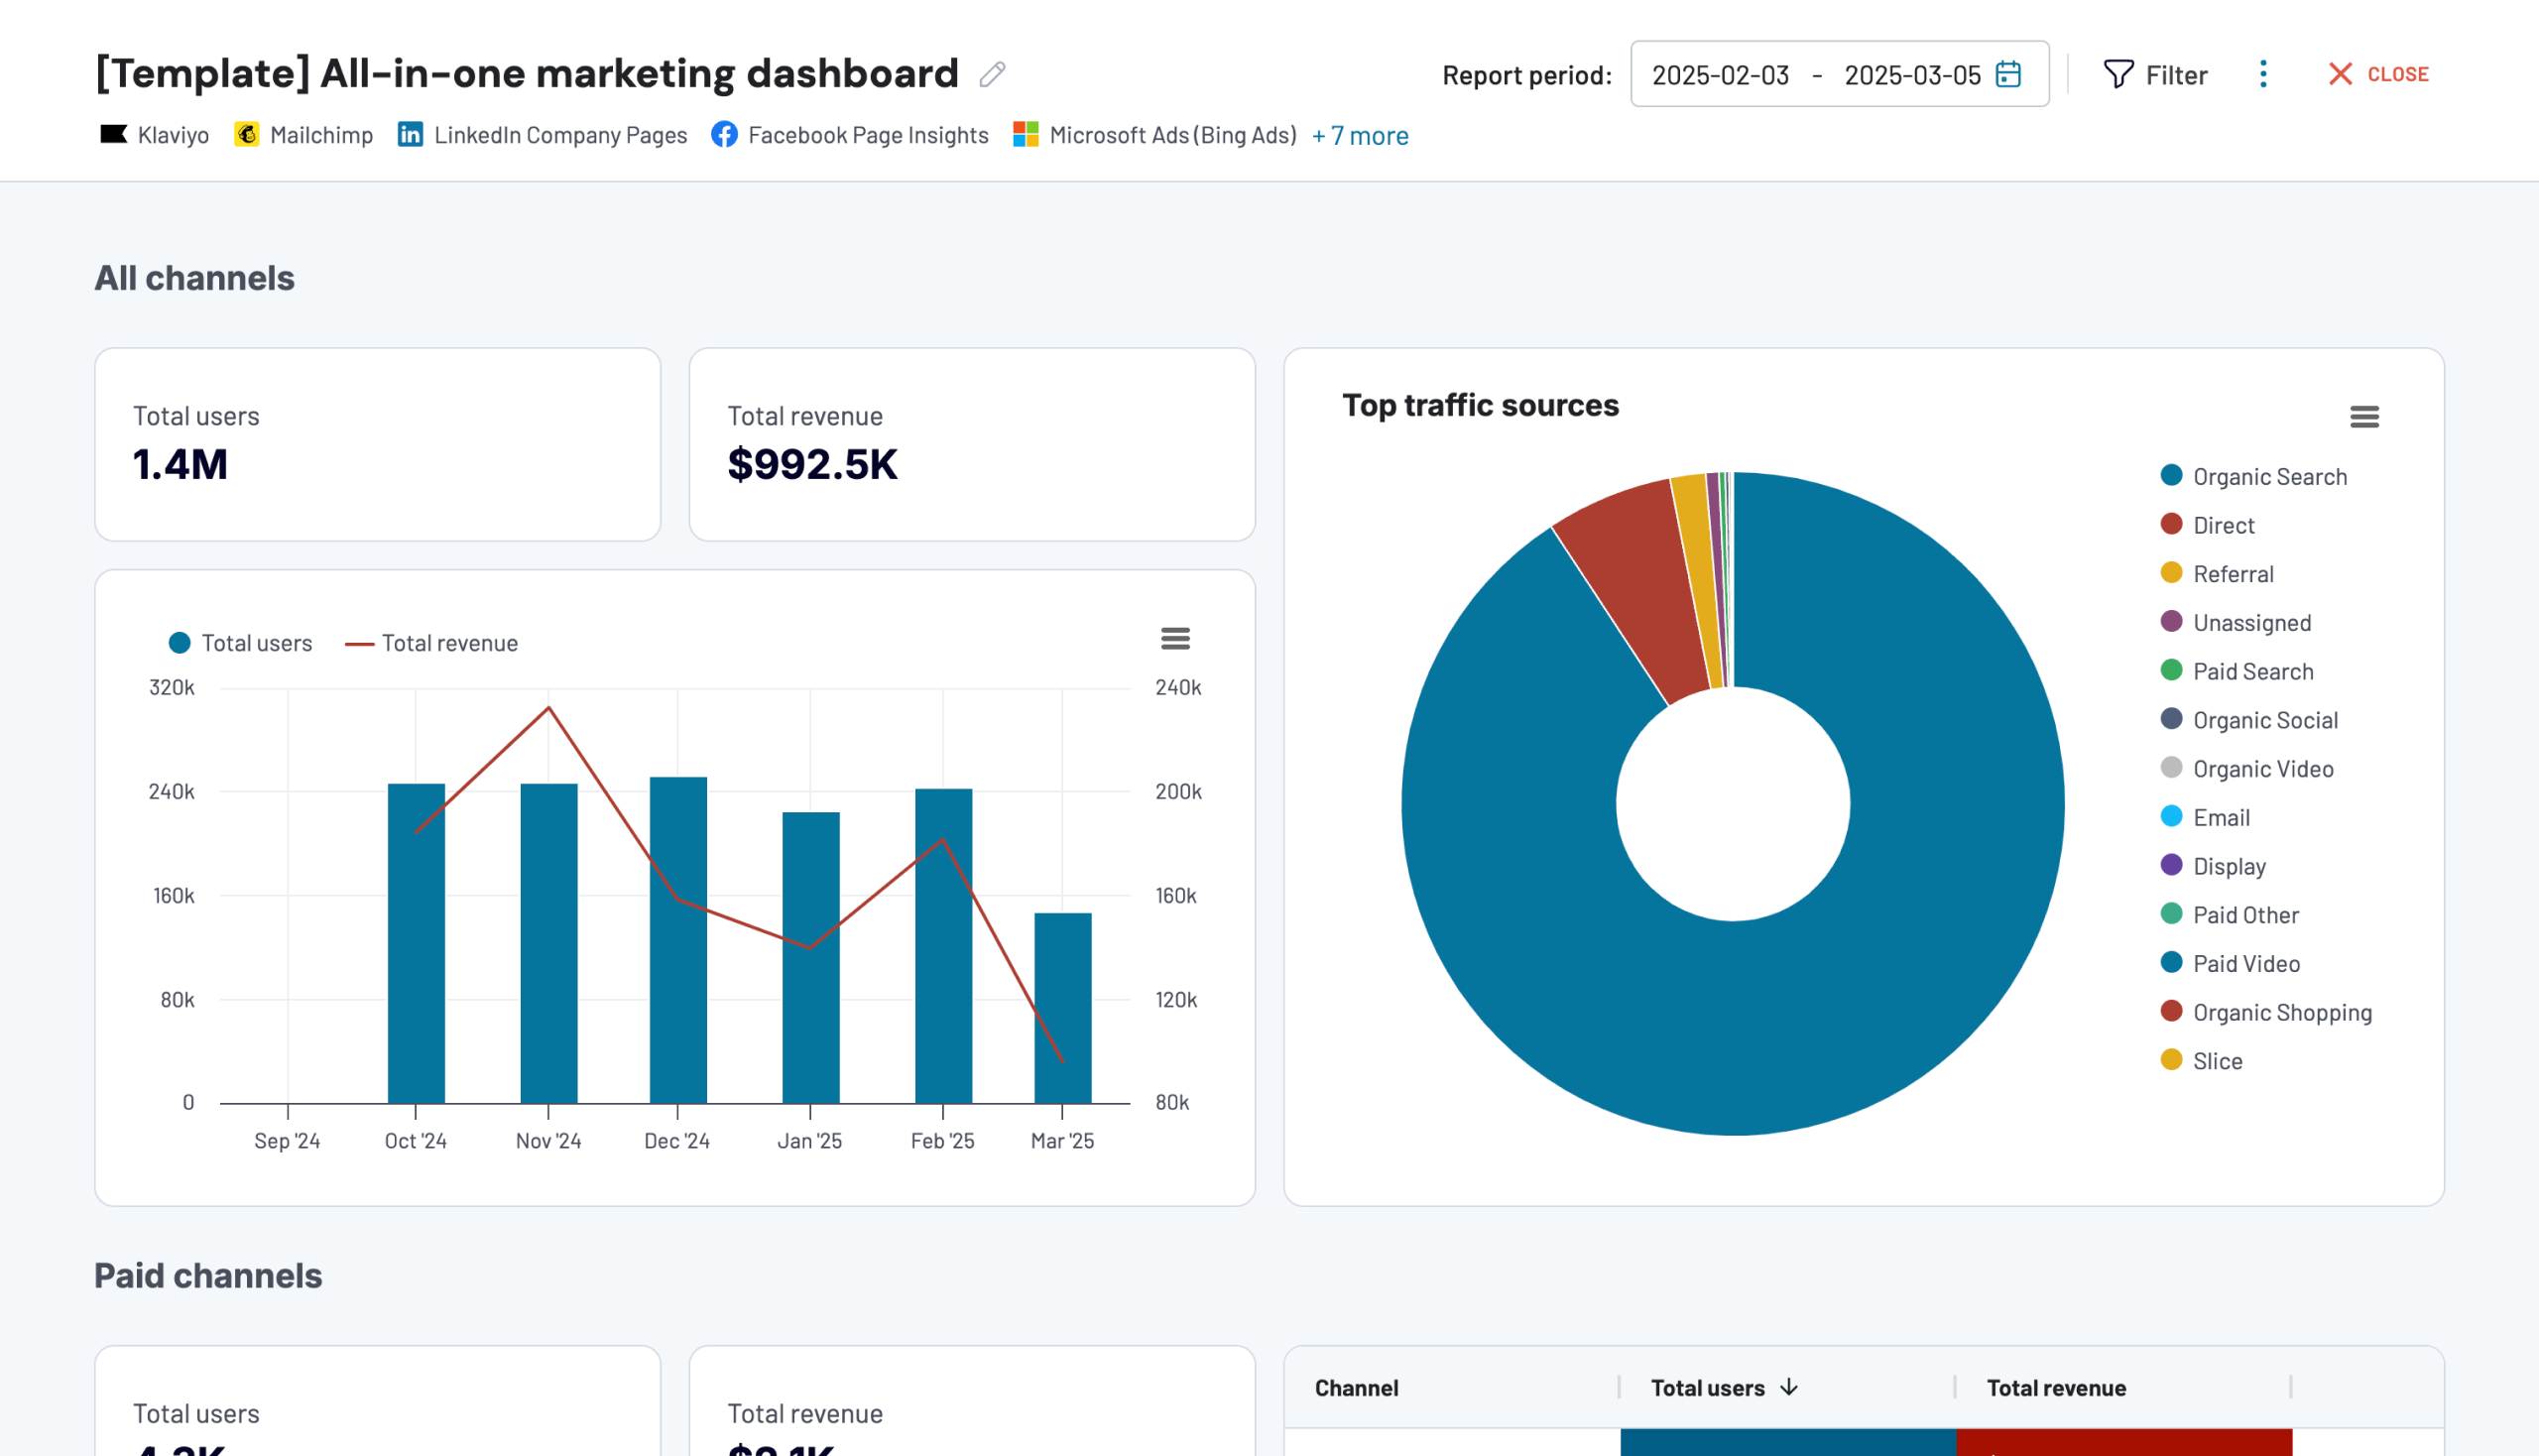
5. All-in-one marketing analytics dashboard
This dashboard goes beyond Google Analytics 4 by focusing on different marketing channels. It can pull data from Google Analytics 4, Google Search Console, ad platforms, social media, YouTube, and email tools – giving you a single view of your entire marketing performance.
What metrics does this dashboard track?
Here are the metrics you can track depending on the marketing channel:
- Paid – Impressions, clicks, CTR, ad spend, and CPC.
- Organic Search – Impressions, clicks, CTR, and average search ranking.
- Organic Social – Impressions and Average daily reach.
- YouTube – Views, Minutes Watched, and Engagements.
- Email – Emails delivered, Ppen rate, Bounces, unsubscribes, and clicks.
In addition to these, all channels also provide data on Total Users and Revenue, further broken down by ‘Session Source,’ powered by Google Analytics 4. This enables you to gain a more granular understanding of each channel and its specific sources.
How does this dashboard help you win with referral traffic?
While you can have a look at how other marketing channels are doing, you have the ability to filter down by referral sources, where applicable, i.e. Organic social and video channels.

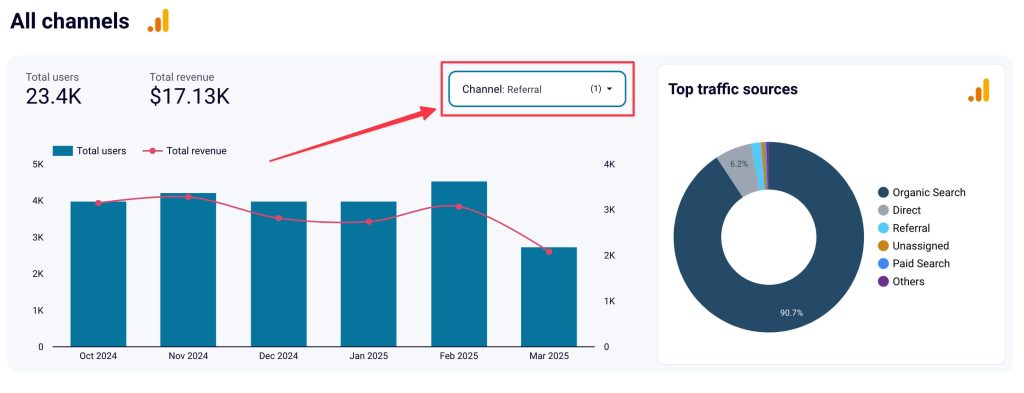
This also helps filter other traffic sources, such as how much direct traffic your site is getting.
- You can identify the top-performing referral sources by seeing which websites, social platforms, or content partnerships drive the most traffic and engagement.
- Measure the quality of referral traffic by analyzing session duration, bounce rate, and engagement to determine if referral visitors are truly interested in your content.
- Find out what referral sources are bringing in the most traffic and/or revenue.
- Consider partnering more with referral sites that are bringing high-value users or creating similar content that attracts them.
- Compare your referral traffic’s performance against other channels and find out if you should be redirecting resources to referral sources.
The dashboard is available right in Coupler.io or as a template for Looker Studio. Try it for free!
You don’t have to stick to just one template. Depending on your end-user, you can use a single template or a combination of them to get the most value.
Since all the dashboards are powered by Google Analytics 4 in some way, let’s explore how you can find referral traffic directly in the tool.
Google Analytics 4 reports for referral
If you’re using Google Analytics 4 as one of your analytics tools, you might be curious how to find your referral traffic there.
This data is readily available in two standard acquisition reports:
- Traffic acquisition – shows traffic sources for all the sessions acquired by your site.
- User acquisition – shows traffic sources only for the first user acquired by your site.
Here’s how you can view this data in both reports by following these steps:
- Go to Reports and click on Traffic acquisition report.

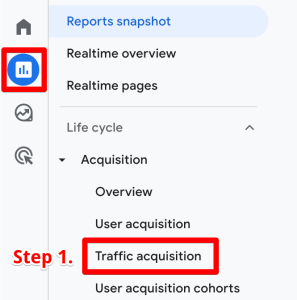
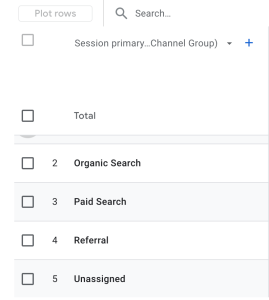
Once you’re in the report, you’ll find a dimension already selected, which is generally the Session primary channel group (Default Channel Group).
While you can see data for ‘Referral’ traffic here, it doesn’t tell you what those sites are.

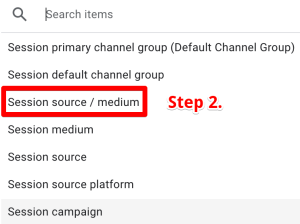
- To see referral sites, click on the pre-selected dimension and select the ‘Session source / medium’ dimension.

- You’ll now see a list of all different sources and mediums, but to narrow it down to only referrals, type ‘referral’ in the table’s search box.

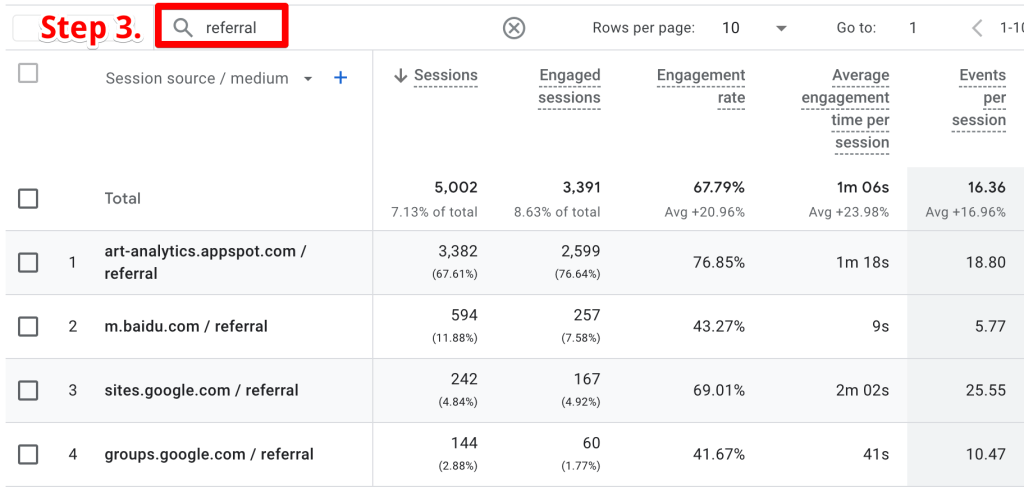
This will show you the referral sites bringing traffic to your site, and you can analyze their performance based on the metrics that matter to you.
But it doesn’t show you the full URL. If you have added Page referrer (page_referrer) as a custom dimension, then you can add that as a secondary dimension and find the URLs as well.
Even though it’s an automatically collected parameter by Google Analytics 4, it’s not readily available for use in the reports. However, you can use it in Explorations even if it’s not added as a custom dimension.
Talking about referral traffic, let’s quickly look at some ways you can grow it.
How can you drive more referral traffic to your website?
There are several strategies you can use to grow your referral traffic, we are going to briefly look at four of them:
Digital PR and media outreach
You can build strong relationships by working on getting featured in online news articles, industry blogs, and press releases.
Consider pitching guest posts or expert opinions to journalists, influencers, bloggers, and publications in your niche.
Link building campaigns
Generally, the SEO team takes care of this but it’s not really set in stone. It’s similar to digital PR and media outreach but you’re more focused on getting linkbacks to your site, ideally, from reputable websites.
Not only does it help you improve your SEO rankings but you can also gain quality referral traffic.
Distribute your content
Creating content is one thing, but ensuring it’s distributed across different platforms can be pretty helpful in gaining a wider reach.
Share your content on relevant sites like LinkedIn, Reddit, Quora, industry forums, and other social media sites.
You can also convert content into different formats (infographics, slides, videos) and post on sites like Pinterest, SlideShare, and YouTube.
Another good strategy is to republish articles on Medium, Substack, or other content-sharing platforms.
Form relevant partnerships
Partnering with businesses/sites that are complementary to your site can lead to cross-promoting each other’s content.
You can run joint events, webinars, and workshops that can be shared on both sites’ channels.
This isn’t an exhaustive list, but it can help you get started growing your referral traffic.
The power of referral traffic in the age of AI
We’ve covered a lot in this blog but perhaps the most important point is to understand the value of referral traffic, especially in the context of AI.
For years, referral traffic has been a source of engaged, high-intent traffic that is likely to convert. But now, AI-driven content discovery, search, and recommendations are reshaping how traffic is generated.
Websites that learn to harness AI-driven mentions will have the upper hand in expanding their audience and improving conversions. The rise of AI search tools is already changing how people discover content. Many of these tools prioritize citing specific sources, creating new opportunities for websites that position themselves as authoritative references in their field.
Perhaps the key takeaway here is that referrals aren’t just about backlinks anymore; they’re about visibility and credibility in the eyes of AI tools. This shift makes your referral strategy more important than ever. The sites that AI systems and human curators choose to reference today will likely enjoy compounding benefits as these technologies evolve.
Armed with the dashboards and techniques outlined in this guide, you’re well-positioned to track your current referral performance and strategically expand this valuable traffic source as digital discovery continues to transform.
Whether we like it or not, this change is happening rapidly. How we invest in new tech and react to these changes will define how we grow our referral traffic in the future.