You’ve created a report to present results to stakeholders. To keep the report up-to-date, you need to spend 10 to 15 minutes to refresh data regularly. It’s not a big deal if you do this once per month. However, the time you spend reporting grows exponentially depending on the refresh frequency, the number of reports you manage, and the amount of data you process. Report scheduling is meant to save you time by replacing the need to refresh data in your reports manually.
What is report scheduling?
This is the automation of data refreshes in reports on a set schedule. The schedule may include:
- Frequency, e.g., every hour, day, month, etc.
- Day of the week, e.g., every Tuesday, except weekends, etc.
- Time range, e.g., from 1 PM to 3 PM, up to 12 PM, etc.
For example, you may schedule the refresh of your sales report every day from Monday to Saturday between 9 and 10 AM.
In addition to data refresh, scheduling may be implemented in another form. For example, QuickBooks Online provides a scheduling feature to send an email with a chosen report to a specific email address at a chosen interval. In this case, the automation does not refresh data but generates a fresh report and sends it to recipients.
Report scheduling vs. triggering
Both triggering and scheduling are options to automate reporting. However, it’s important to differentiate between these terms to understand which option your project needs.
- Report scheduling is a time-based automation. It is based on the specified time and frequency, such as every hour, every Monday, etc.
- Report triggering is an event-based automation. It is based on a specific event or condition, such as a new deal closed, the total number of sales exceeding $10,000, etc. This is often triggered via event-based APIs, which use an event-driven API management for smooth and secure functioning.
In this article, we’re only focusing on scheduling reports, including benefits, types, best practices, tools, and other valuable things.
What is the value of automated reporting to businesses?
The main benefit of automation is increased productivity and efficiency. When you automate something, you spend less time doing it manually. The same applies to reporting automation. When you schedule reports, you won’t have to refresh the data in your reports manually. As a result, a time-consuming and probably complex task turns into an automated process that may just require some occasional supervision.
Saving time is not the only benefit you get when you schedule reports. The efficiency of dynamic reporting is also improved by reducing errors and streamlining data-driven decision-making, which has become an essential aspect of business growth. Below, you can find some other important benefits that report scheduling provides.
Benefits provided by report scheduling
- Continuity. Scheduling reports enable you to maintain the continuity of your reporting process. You can turn a one-time report into a dynamic one that will automatically refresh at regular intervals. This eliminates the need to create the same report repeatedly or manually update the data.
- Time management. Once you set up the time frame and interval for your report schedule, you won’t have to upload new reports or worry about manually inputting any information. Due to this, you will be able to focus on other aspects that are critical to your business, thus freeing up your valuable time and resources.
- Improved data management. Reporting automation allows you to fully optimize your data management through the scheduled refresh of data. This, in turn, enables you to have access to the latest information and ensures accuracy as well as reliability.
- Data integration. One great aspect of report scheduling is the ability to automatically refresh data from multiple sources that feed data to your reports.
How you can schedule reports
Reporting automation tools
The most actionable option to automate reporting is to opt for a dedicated solution. As a rule, such tools encompass three stages of report creation:
- Data collection from sources
- Transformation of data in the form of a report
- Loading the report for further visualization and scheduling
The last stage is actually where you can enable the automation to make your reports dynamic. Basically, some ETL tools also provide scheduling options, so you can use them instead.
Examples of reporting automation and ETL tools you can use are Coupler.io, Skyvia, Dataddo, and others.
BI and data visualization tools
Most custom reports are created using data visualization or business intelligence tools such as Looker Studio, Tableau, or Power BI. Some of these do provide scheduling as a feature so you can automate data refresh of your reports and dashboards on a schedule. However, not all of them allow you to customize the frequency of the report schedule.
It depends on the BI tool you use since not all have this functionality implemented in the way you need. For example, Looker Studio automatically updates data every 12 hours, and you can customize this schedule.
With Tableau and Power BI, things are more complicated since they provide different connection options. For a report at Tableau Server, you can select a refresh schedule for published extract data sources and published workbooks that connect to extracts.
If the provided scheduling options are not enough, you can always use a combination of a reporting automation solution and a BI tool. For example, Coupler.io supports the mentioned BI tools as the destination for your reports and allows you to schedule data refresh at the desired frequency.
Code solution
Let’s say you want to update your report every 23 minutes 🙂 Most ETL tools have a preset schedule, like every hour, every 30, or 15 minutes. But you only need a 23-minute frequency for your report schedule. It’s a joke, of course, but the point is that to implement a custom report scheduling, the only option you’ve got is to use coding. Python, Apps Script, and other programming languages allow you to automate data flows with the help of REST APIs of your source and destination apps.
The drawback of this method is that it requires solid technical background and expertise. If you have a data analyst or data engineer in your company, then all is good. However, without such a tech expert at hand, you’ll need to hire a service that will be able to create and maintain the required automation for your reporting system.
Example of creating a scheduled report with Coupler.io
If you think that automating a report is not an easy job, we’d like to convince you the opposite. With Coupler.io, it only takes a few clicks to collect data from your sources, transform it into a report, and automate the data refresh.
1. Collect data
The first thing to do is sign up for Coupler.io. You can do this for free with no credit card required. When logged in, click Add a new importer, and choose a data source to get data for your report.
If you want to collect data from multiple sources, you can do this later once you’ve configured the connection to the primary source.
For the selected source app, you need to connect the account and select or specify the data to export. This can include reports, filtered data, metrics & dimensions, etc. For instance, here is what a configuration may look for the Facebook ads as a data source.
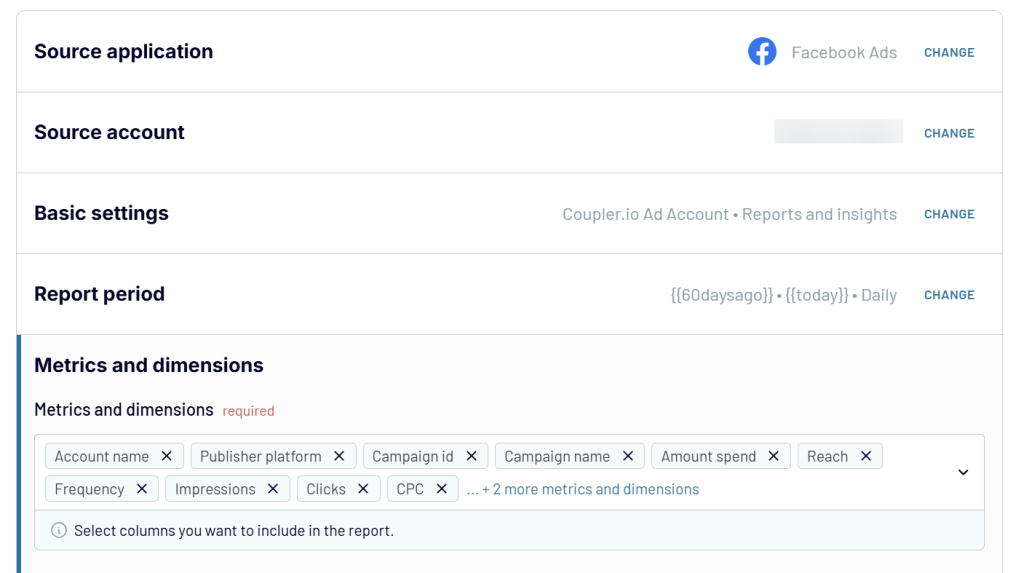
After this, you can add more sources to get data and configure them respectively. Then, proceed to the next step.
2. Transform data
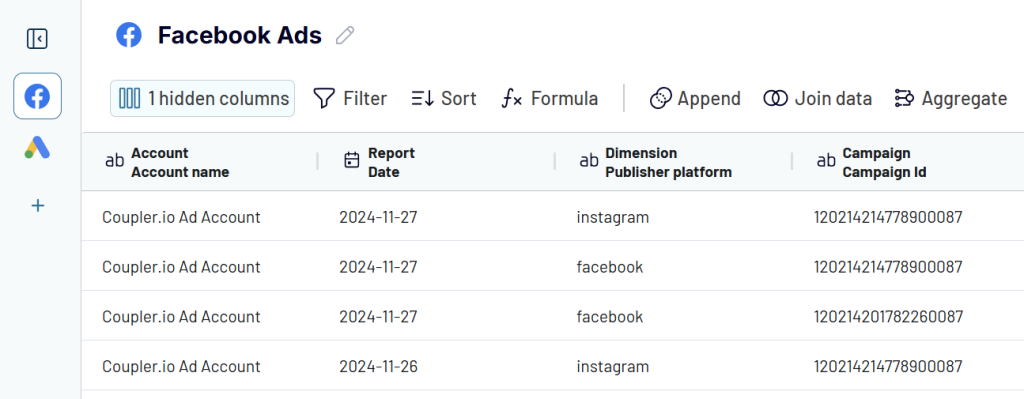
For data transformation, Coupler.io offers you the following capabilities:
- Manage columns (rename, reorder, edit, and make other manipulations).
- Sort and filter data for your reports.
- Create new columns using formulas.
- Aggregate data by performing operations like sum, average, count, min, and others using the selected metrics and dimensions.
- Append or join data if you’ve connected multiple sources.
Here is what it looks like:
3. Load data and schedule refresh
The last step is to select a destination application for your report and enable automation. As the destination, you can choose from spreadsheet apps, BI tools, and data warehouses. Follow the instructions for the selected application to load your report.
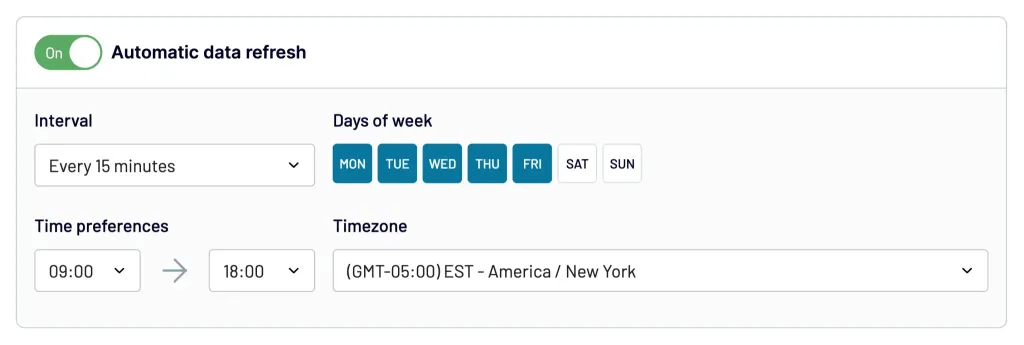
Then toggle on the Automatic data refresh and configure the desired schedule for your report automation, including:
- Interval – from every month to every 15 minutes
- Days of the week – select the desired days of the week for automated data exports
- Time preferences – select the one-hour frame for the export to take place
- Schedule time zone – choose the preferred time zone for your schedule
This is it. Depending on the number of sources and transformations you want to apply, the entire process of report creation and automation should not take more than 10 minutes! Of course, data visualization will take additional time, but it’s done on the destination side for now…
Try to create and automate your report yourself right away for free!
What types of reports you can schedule
Basically, all report types can be scheduled. The more important thing is whether you need to schedule a custom or default report.
Default reports are mostly those provided within the software. Such preset reports are available in accounting tools, CRM apps, and other software solutions you use. In addition, these apps may have a built-in report scheduling feature. So, you get the automated report generation and scheduling out-of-the-box. However, in this case, you’re limited to the report design and functionality provided in the software. If you want to go beyond this, you should build a custom report.
Custom reports are bespoke reports, i.e., they are designed considering your requirements for design, data source, and scheduling. With custom reporting, you may not limit yourself to one data source and have multiple information sources combined within one scheduled report. Let’s take a look at some of the reports that are already automated, thanks to the built-in connector by Coupler.io. All the users need to do is connect their source account and customize the schedule for data refresh.
Marketing report example – all-in-one marketing dashboard in Looker Studio
The all-in-one marketing dashboard provides a unified view of your marketing efforts across various channels. It integrates data from Google Analytics, Google Search Console, ad platforms, social media, email tools, and YouTube.
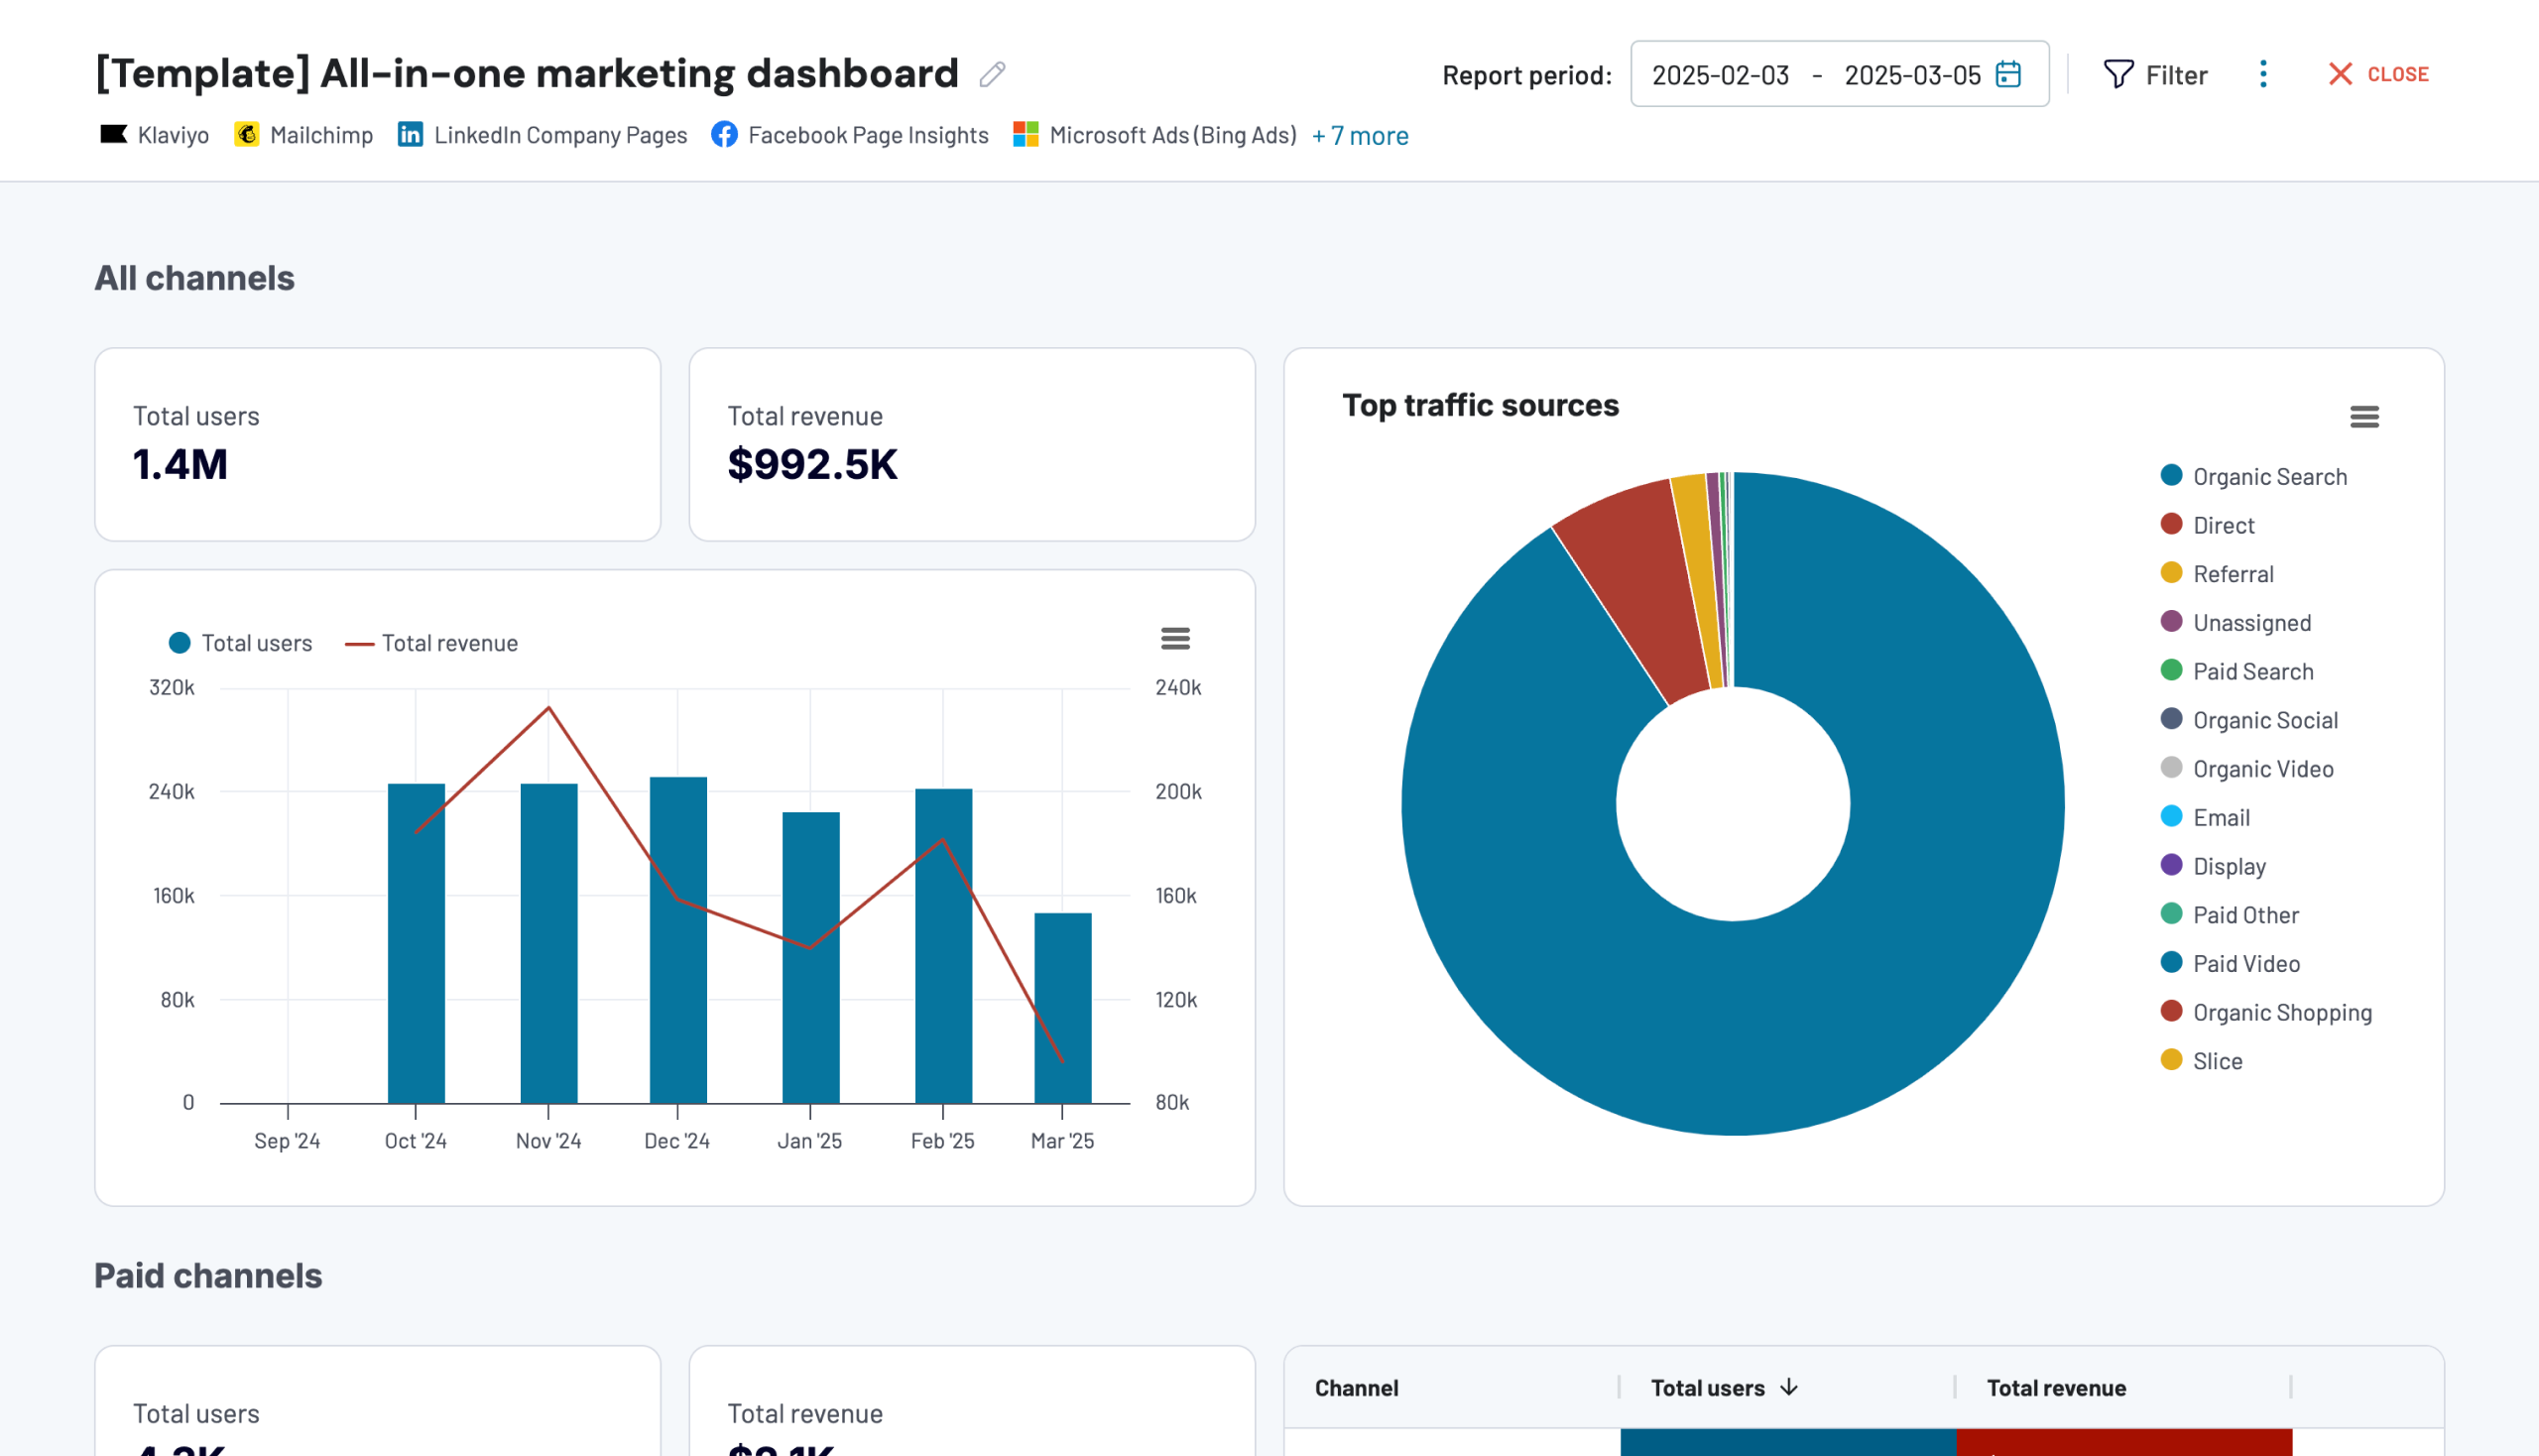
This dashboard is available in Coupler.io and as a template in Looker Studio. Get this automated report for free. Follow the instructions to collect and transform your raw marketing data into actionable insights.
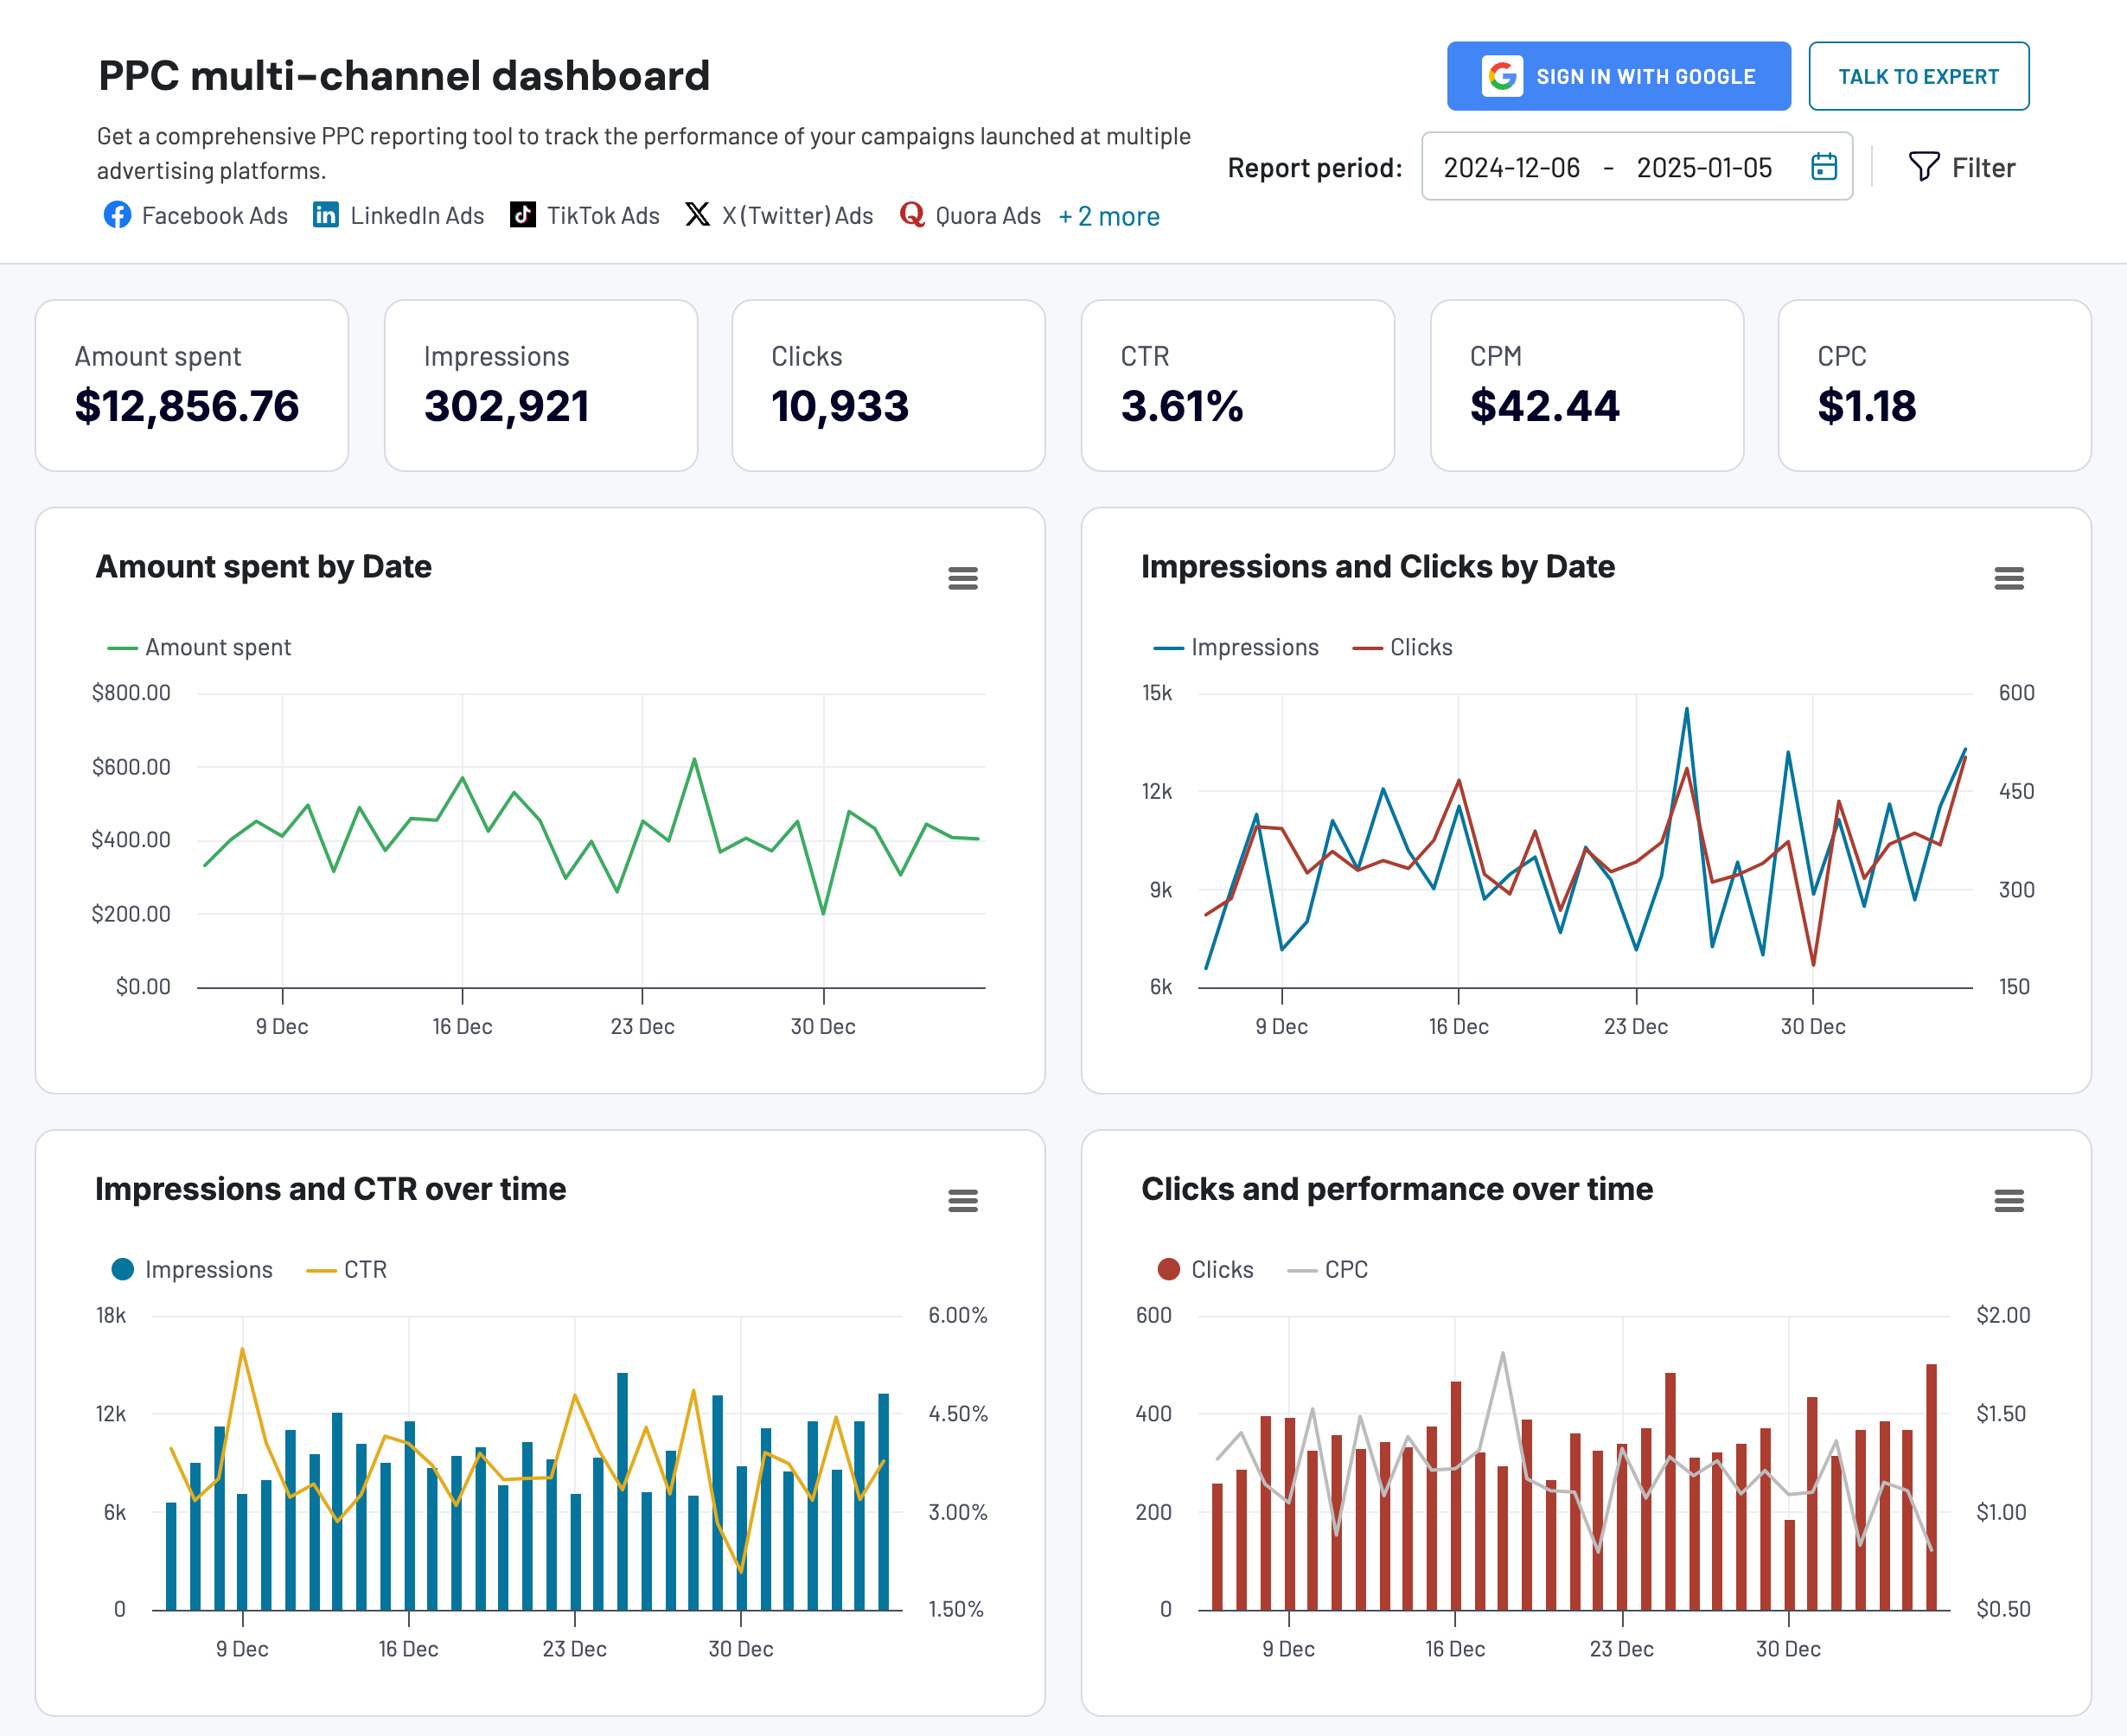
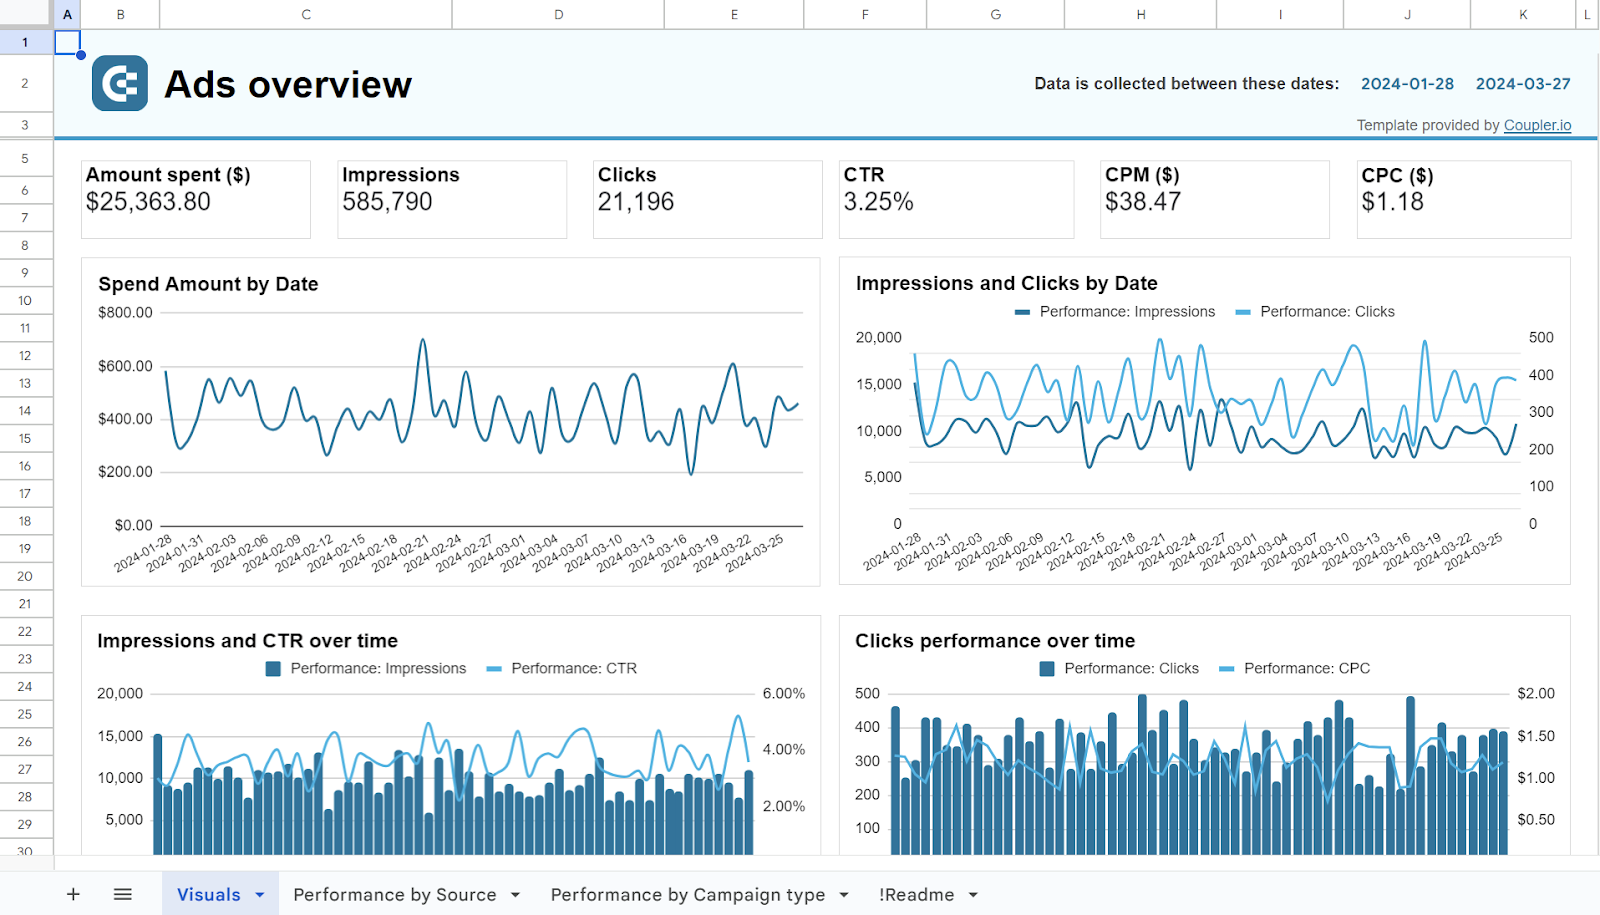
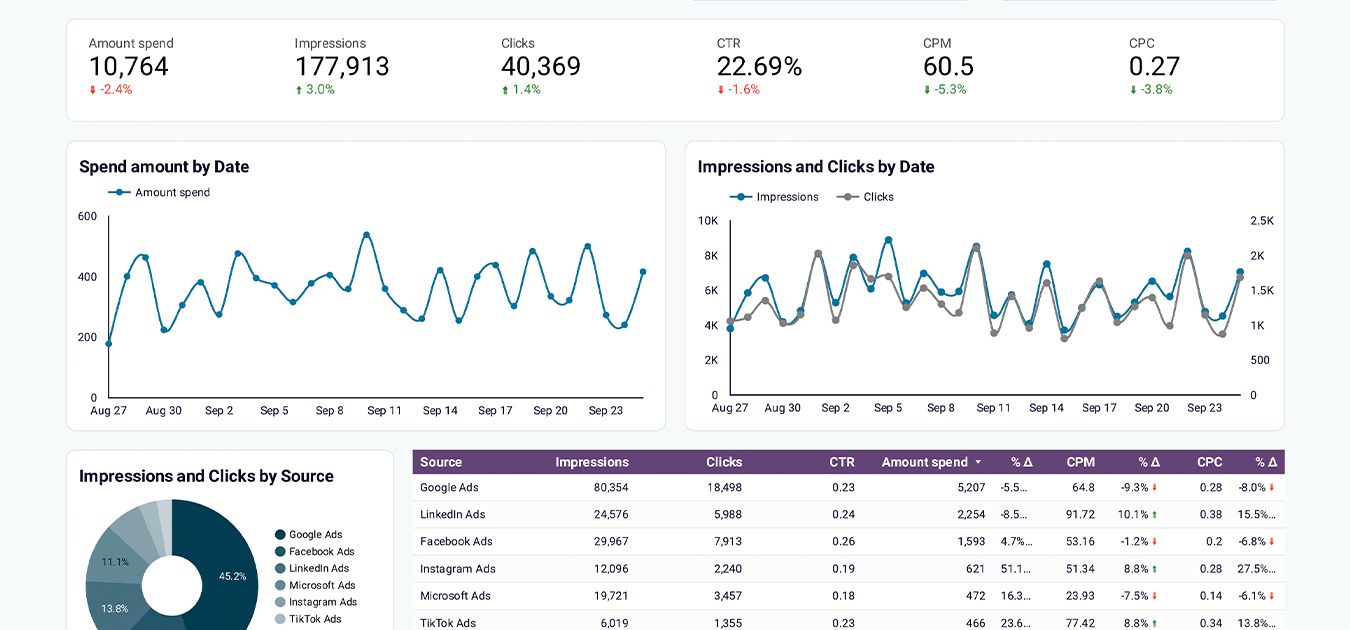
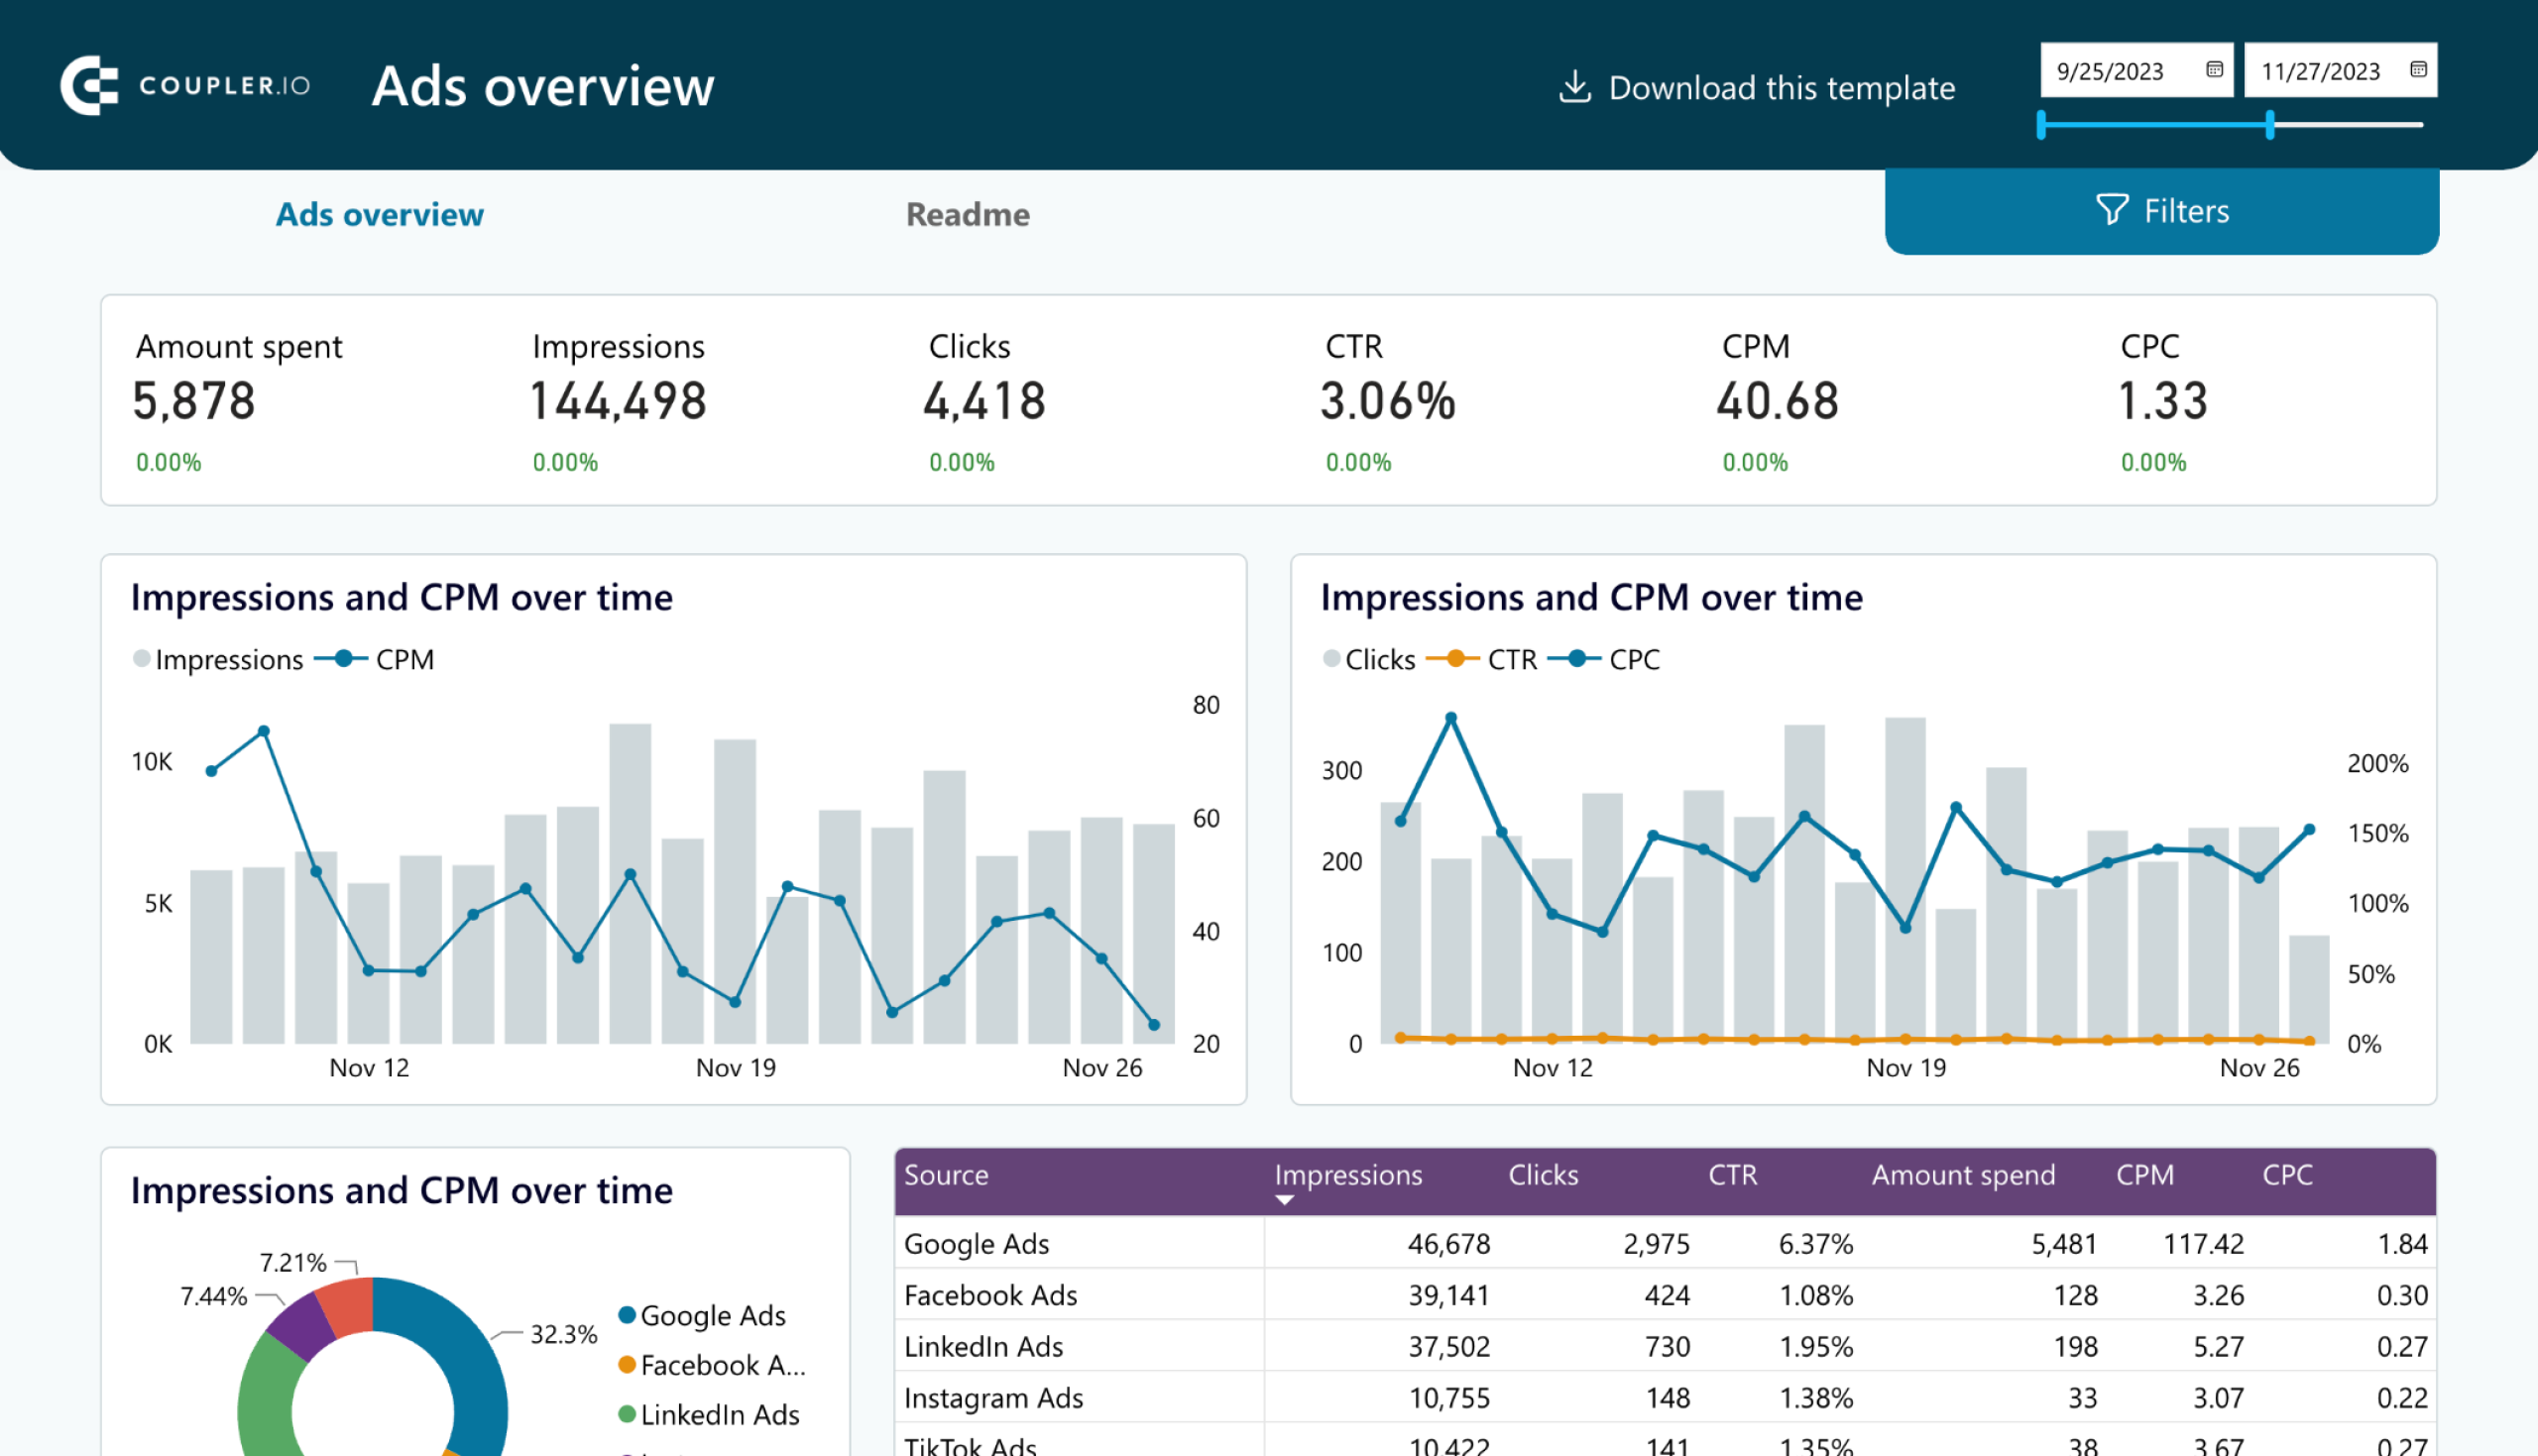
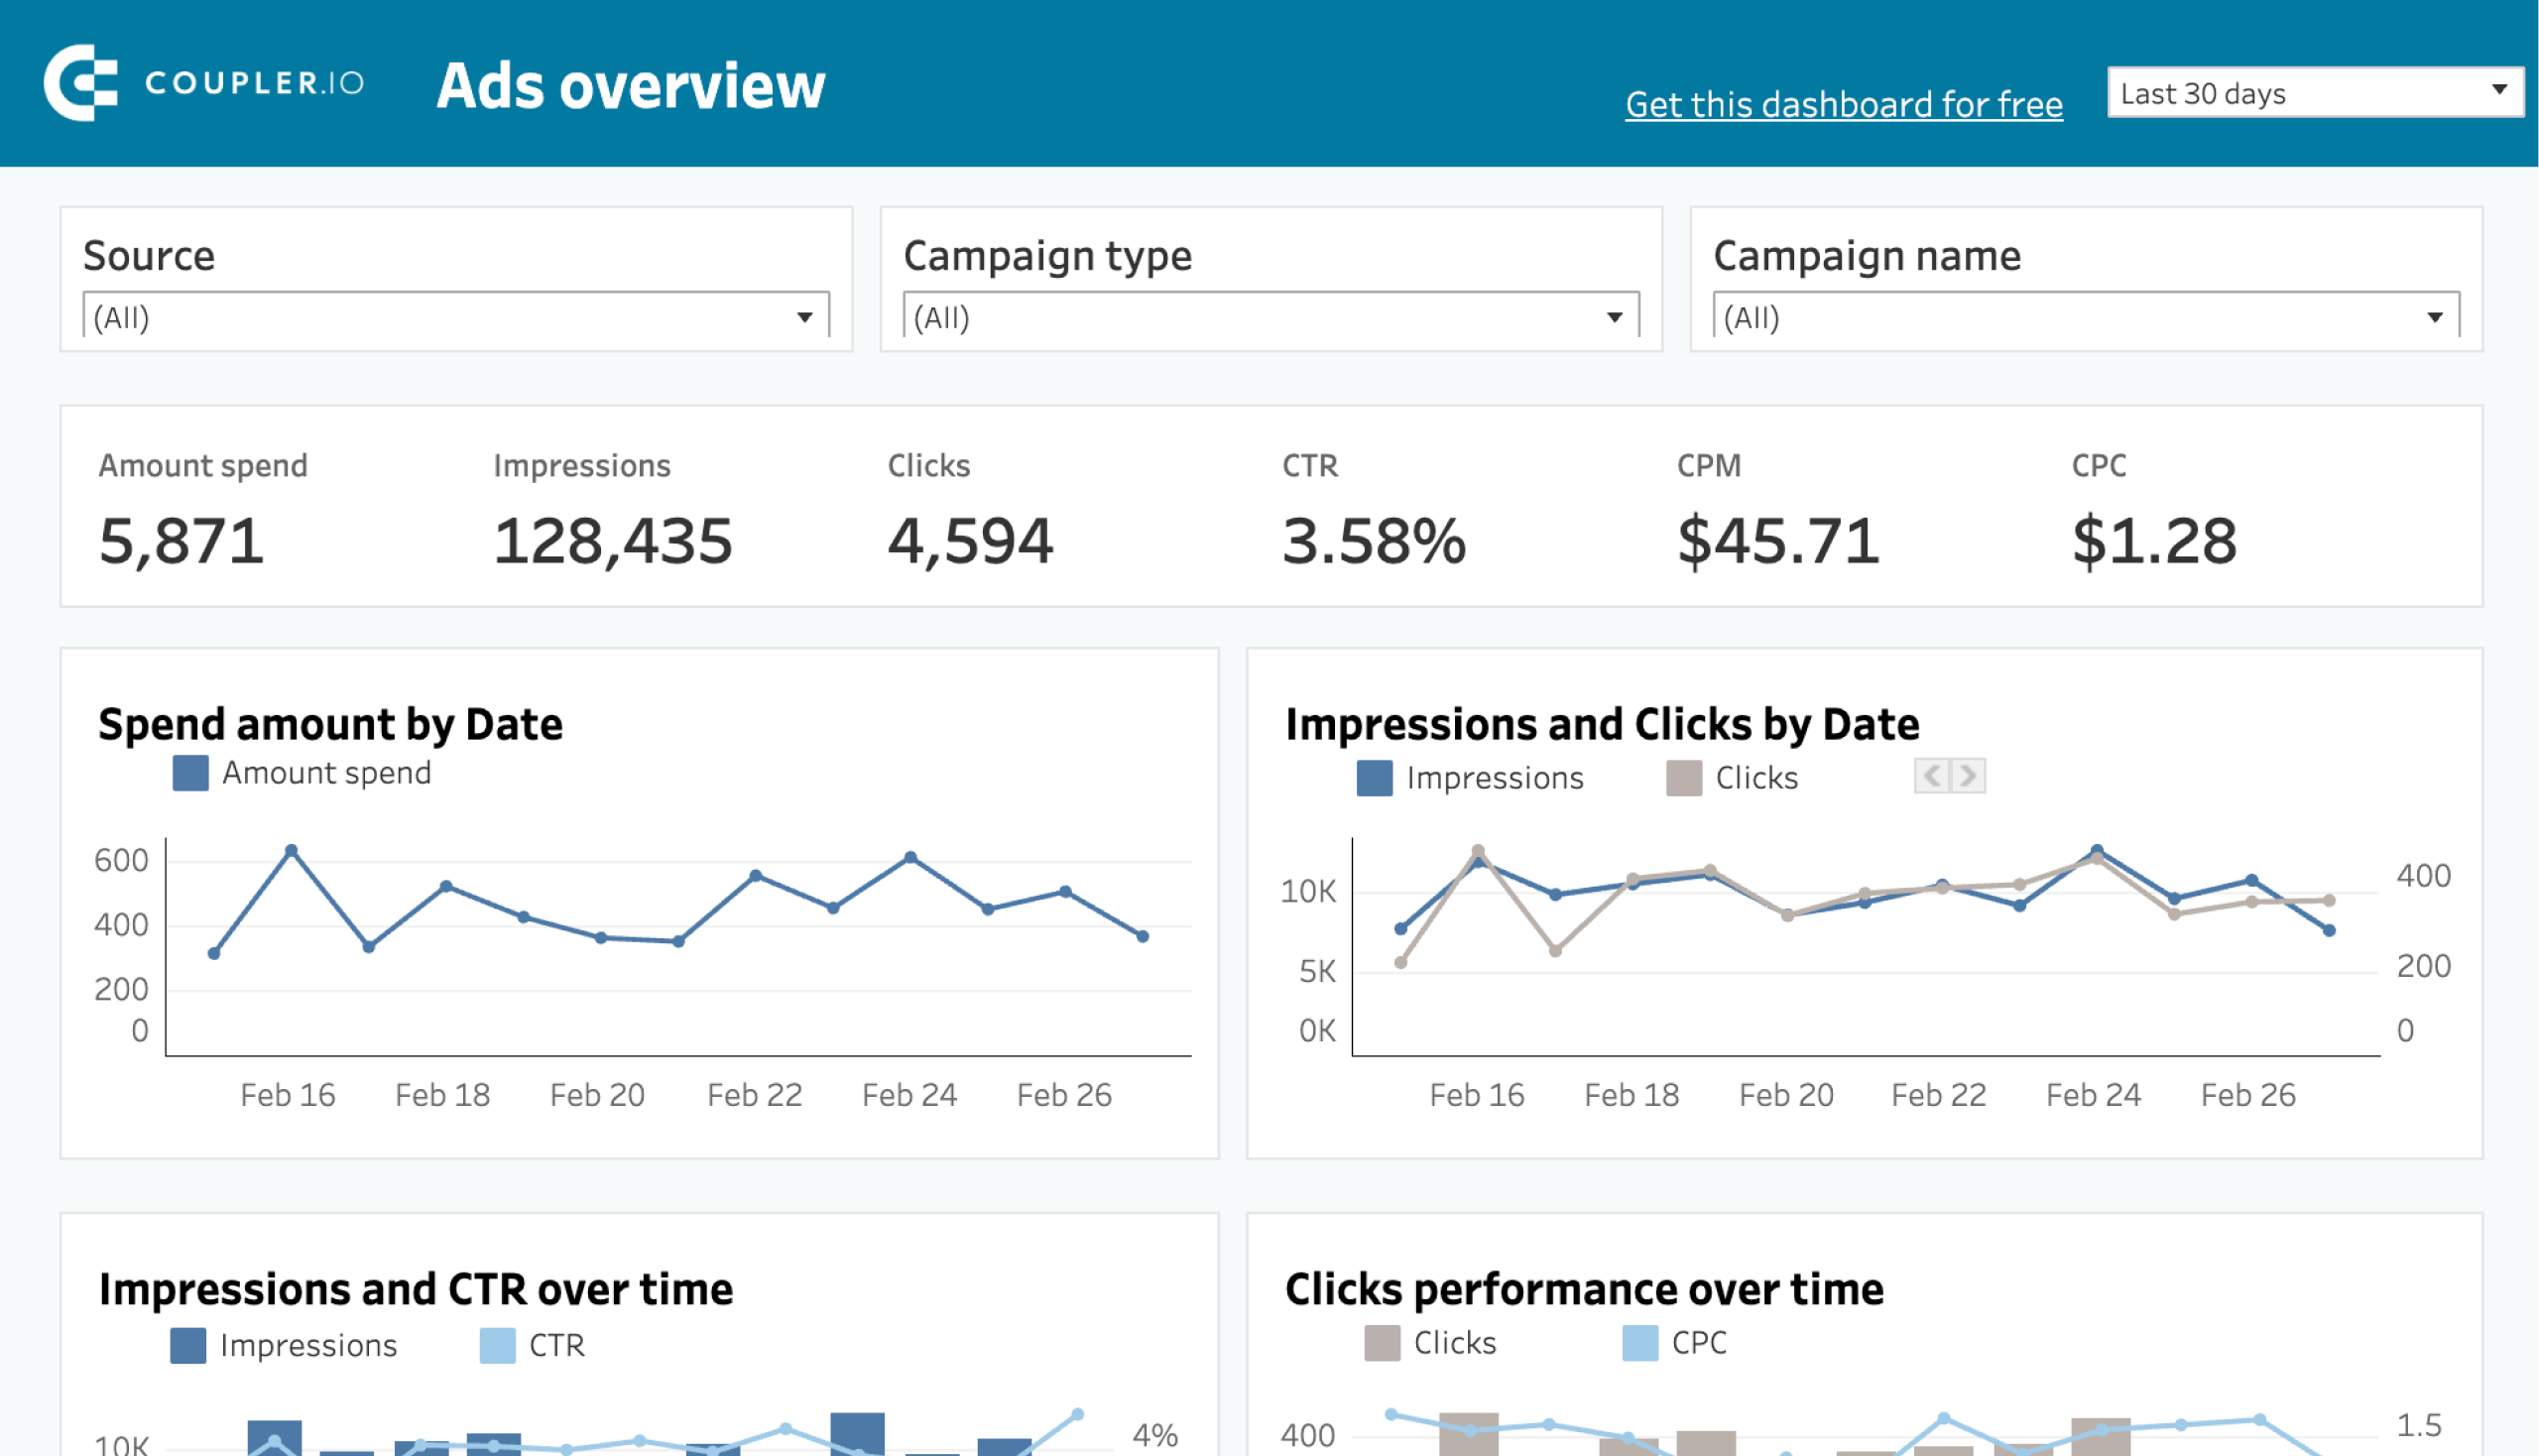
Paid advertising report example – PPC multi-channel dashboard
This PPC dashboard is a useful solution for omnichannel reporting. It visualizes ad performance across different channels, including Google Ads, Facebook Ads, TikTok ads, LinkedIn ads, and more. As a result, you have one place to showcase ROI across multiple ad campaigns.

This automated white-label report is available in Coupler.io UI and as a template for Google Sheets, Looker Studio, Power BI, and Tableau. Pick the one that meets your reporting requirements and get it for free.


SEO report example – Landing page performance dashboard in Looker Studio
With this report, you can monitor how much traffic your landing pages receive and how this results in purchases. The data is coming from two sources: Google Search Console and Google Analytics 4.
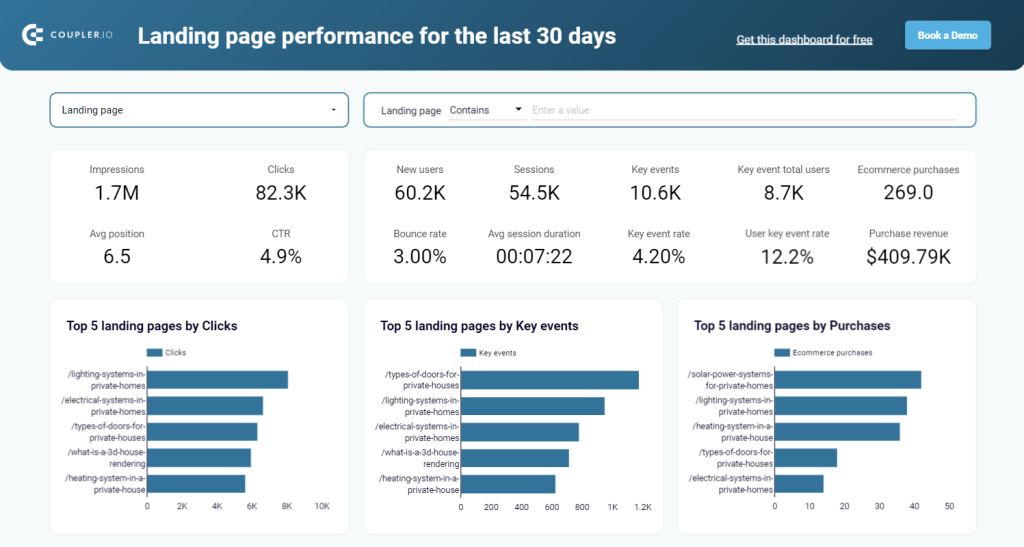
To use this automated report, you only need to connect your Google account, which you use for Google Analytics 4 and Search Console. The template in Looker Studio will be populated with your data and refreshed according to the set schedule.
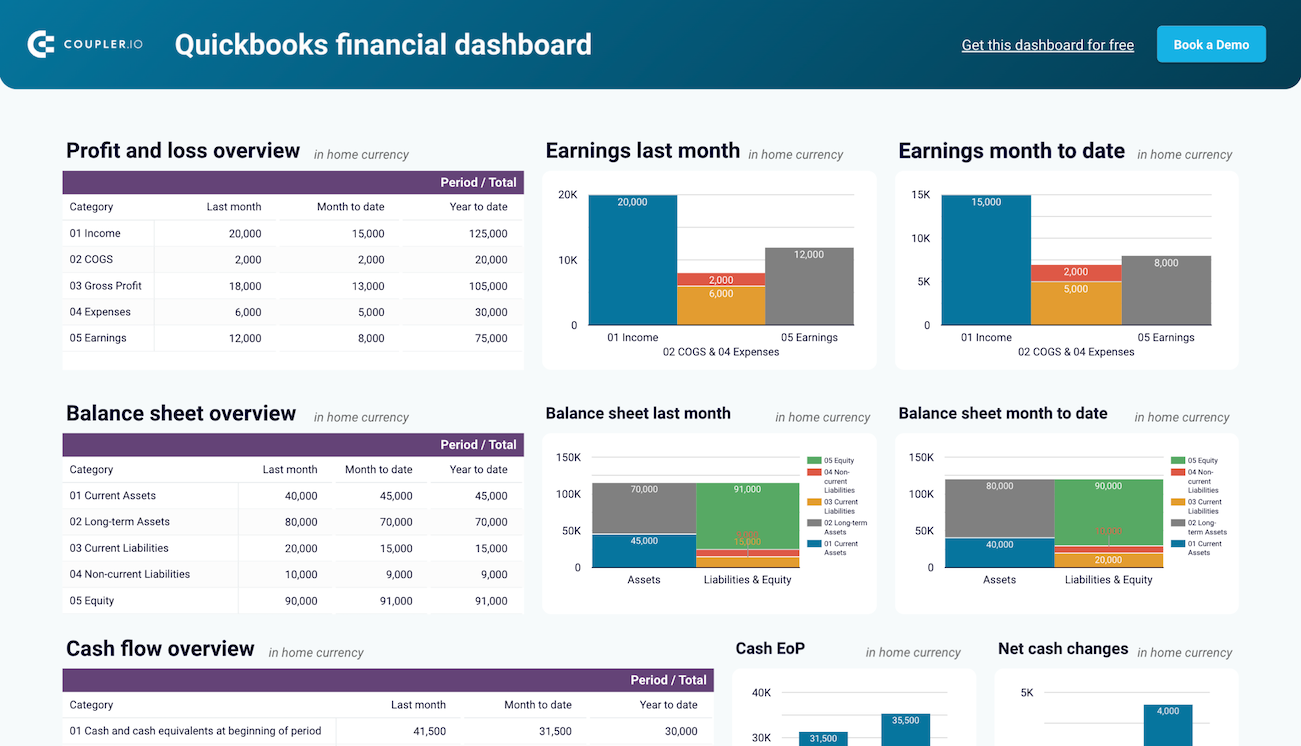
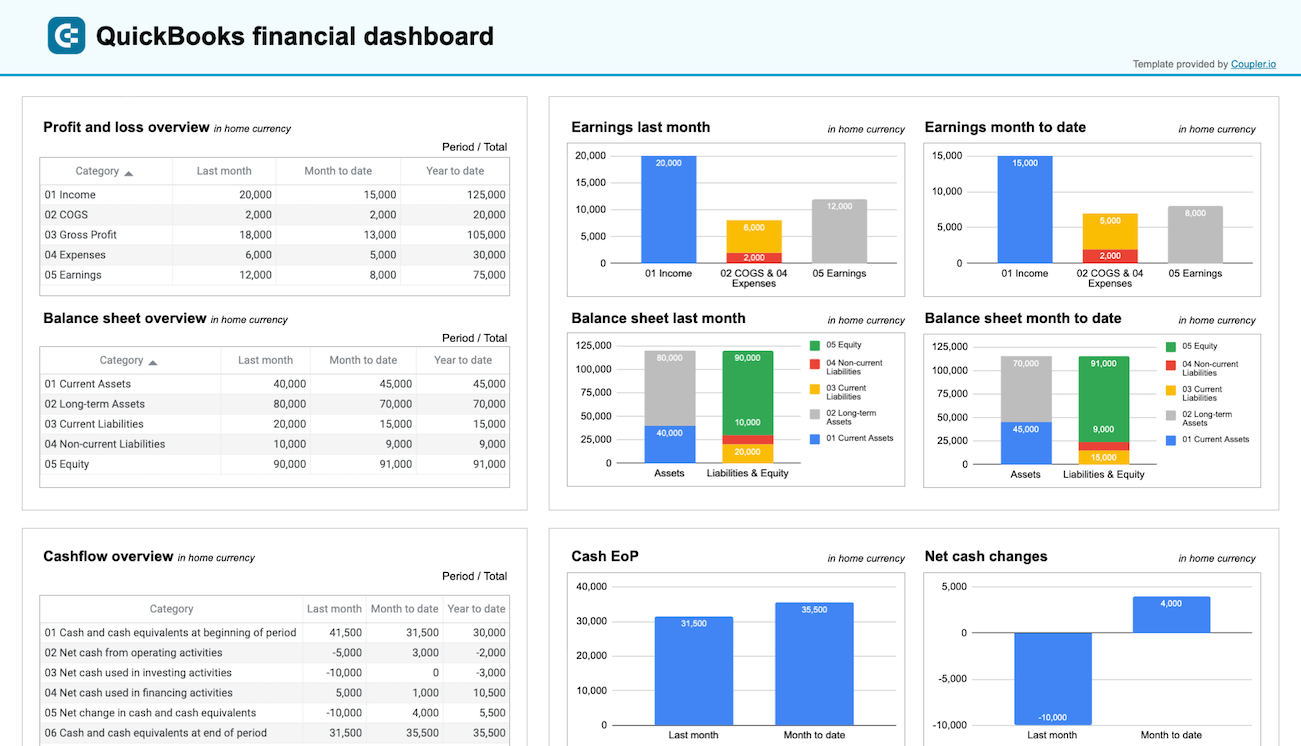
Finance report example – QuickBooks financial dashboard
This financial dashboard for QuickBooks accumulates multiple reports in one place, including profit and loss, cash flow, cost of goods sold, etc.
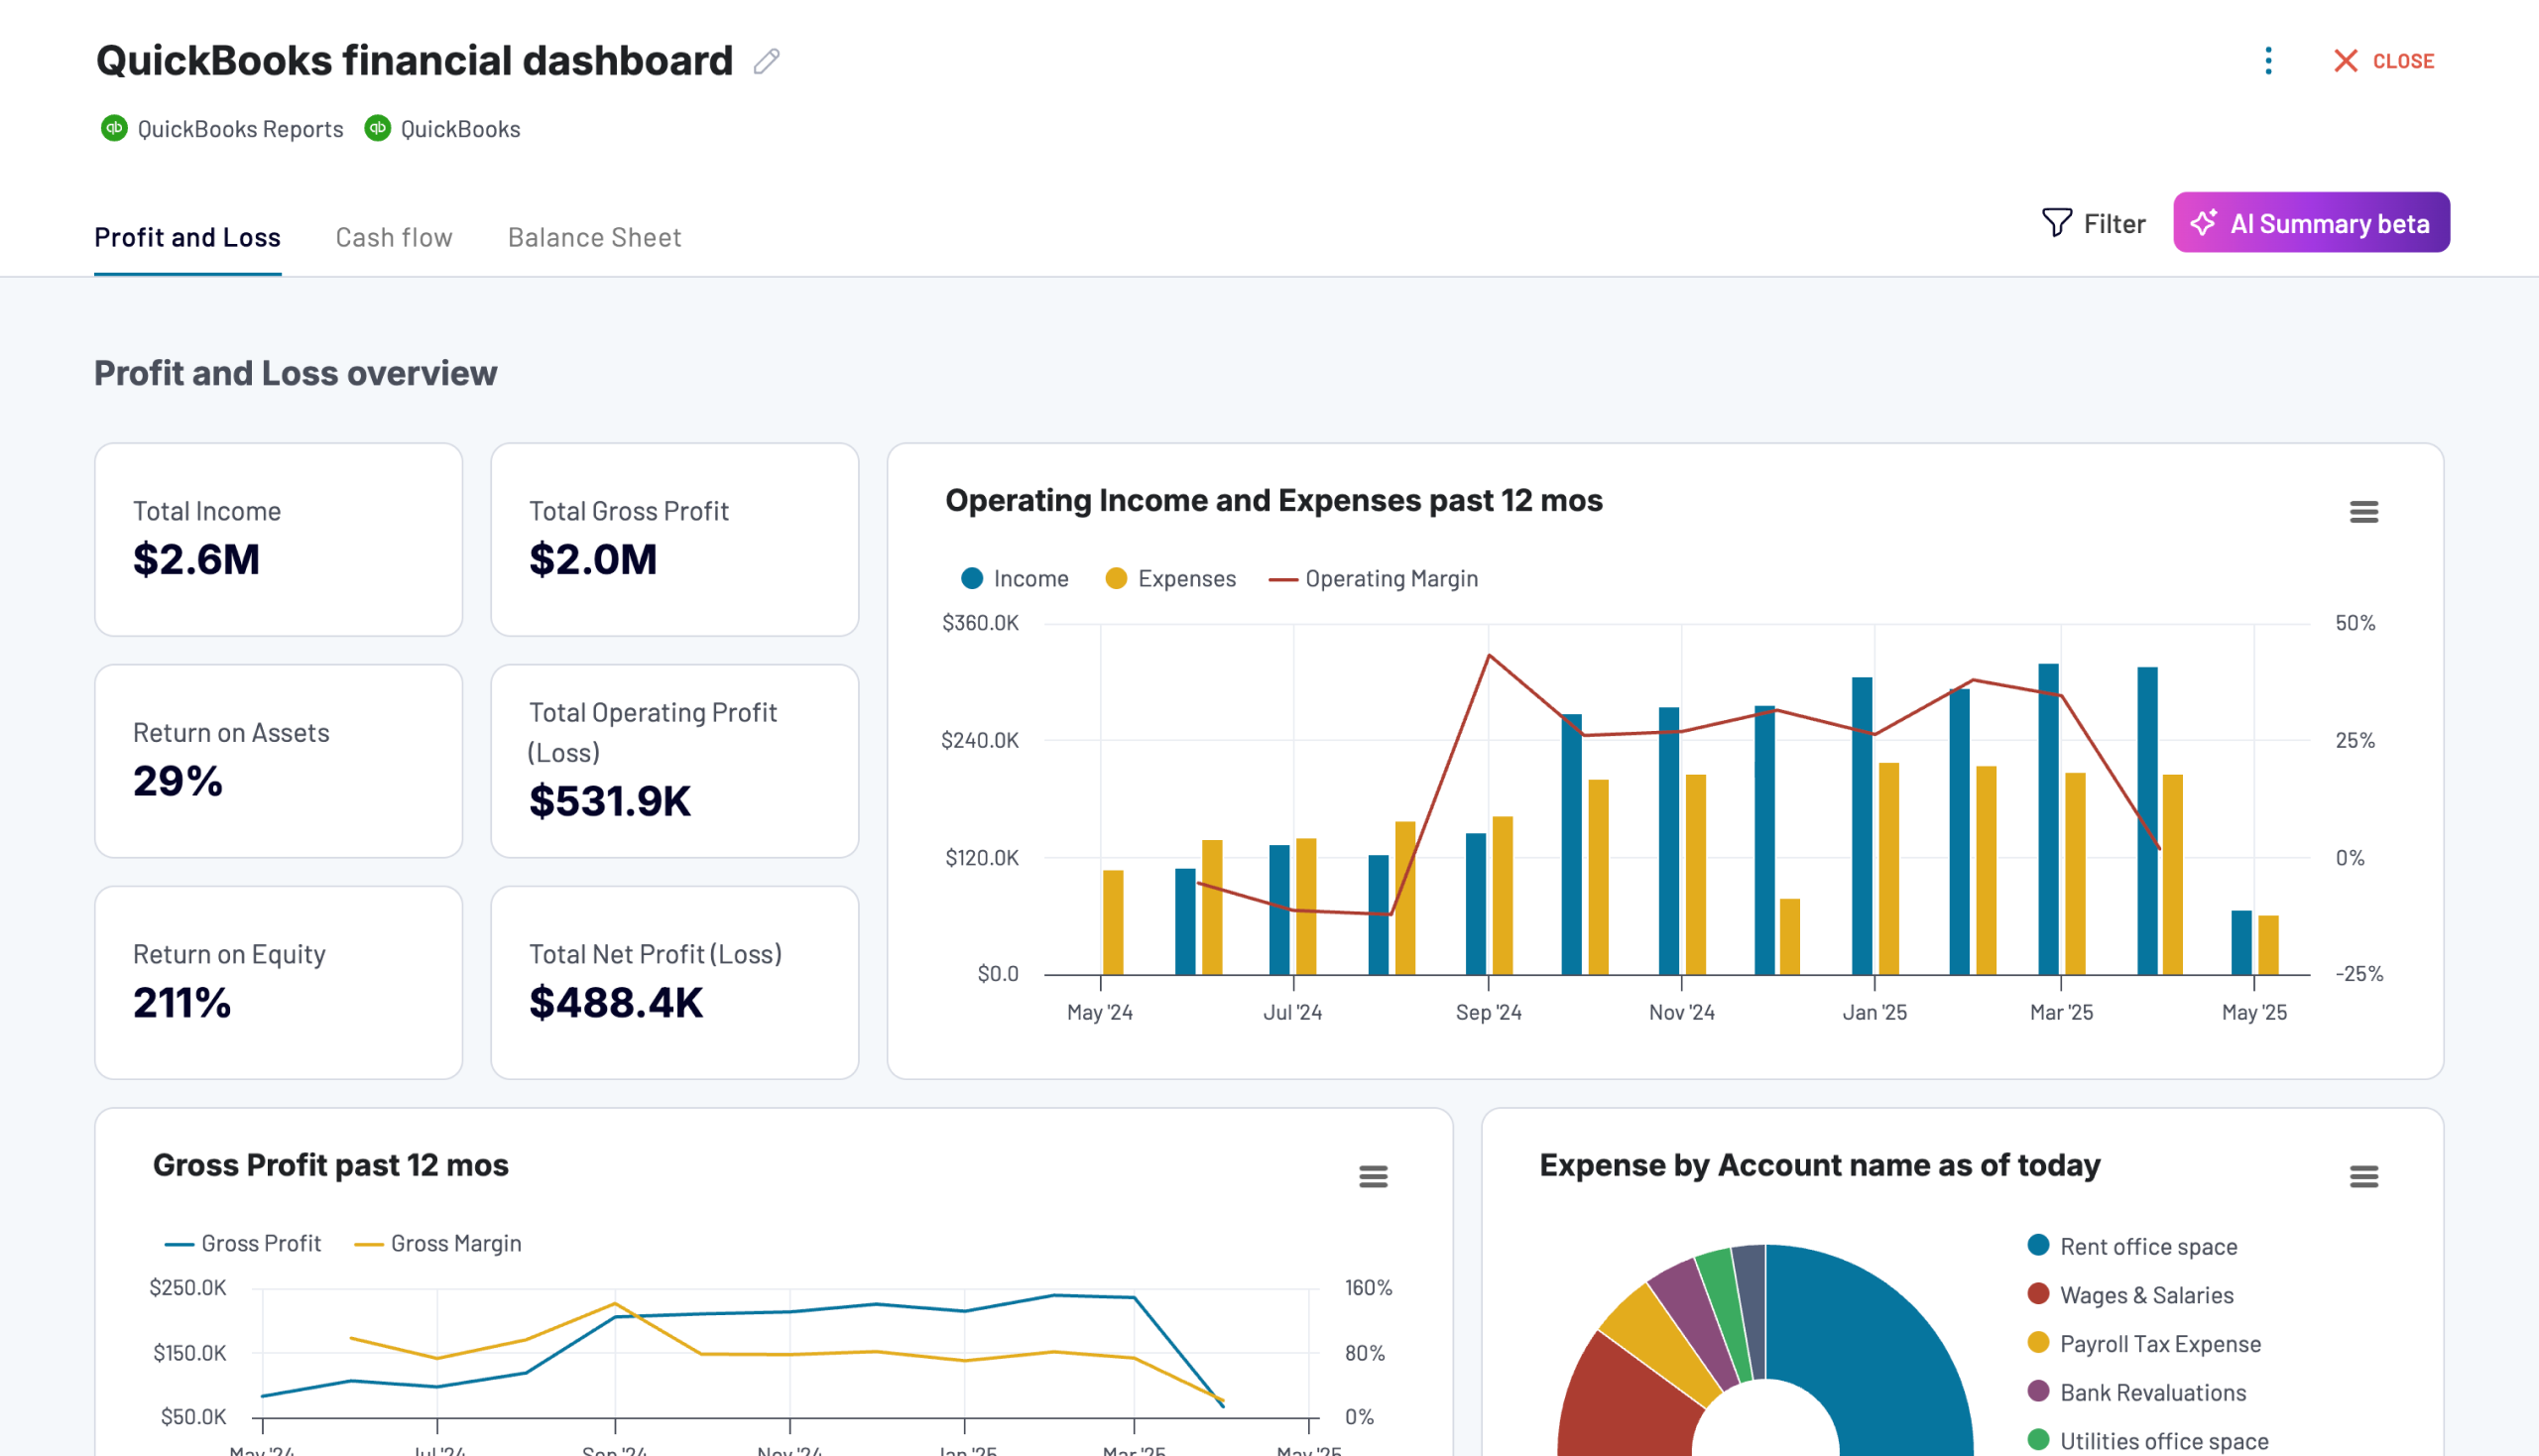
Simply connect your QuickBooks Online account using the Coupler.io connector and get the fully automated dashboard that refreshes data on its own. The financial dashboard is designed in Coupler.io with AI insights available. It also comes in two template versions, for Google Sheets and Looker Studio.

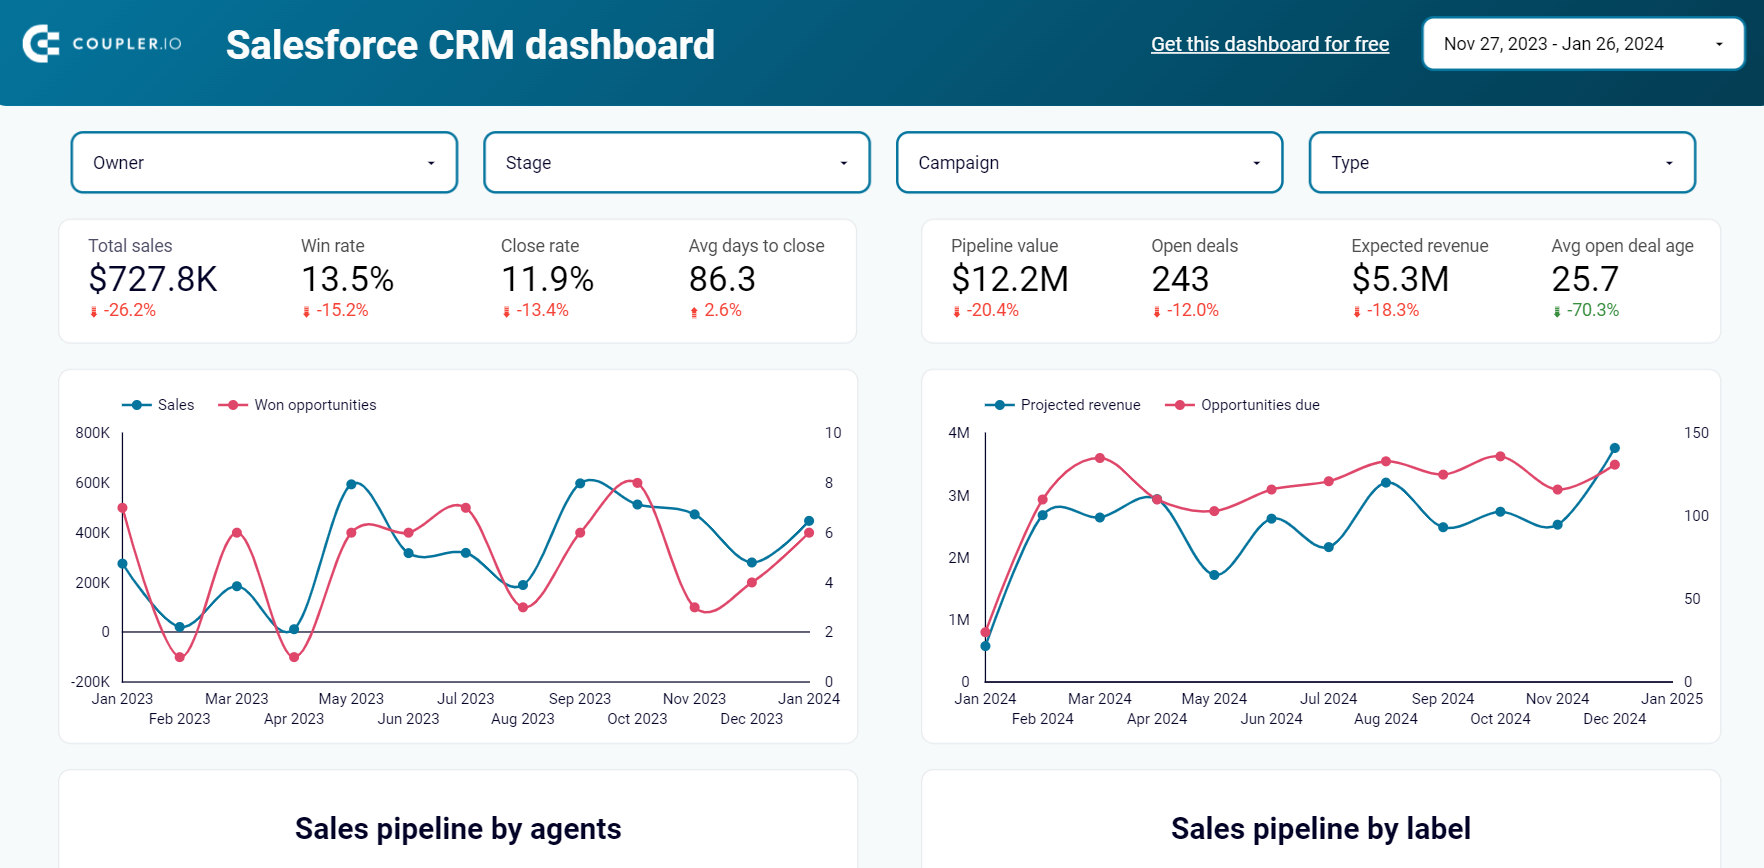
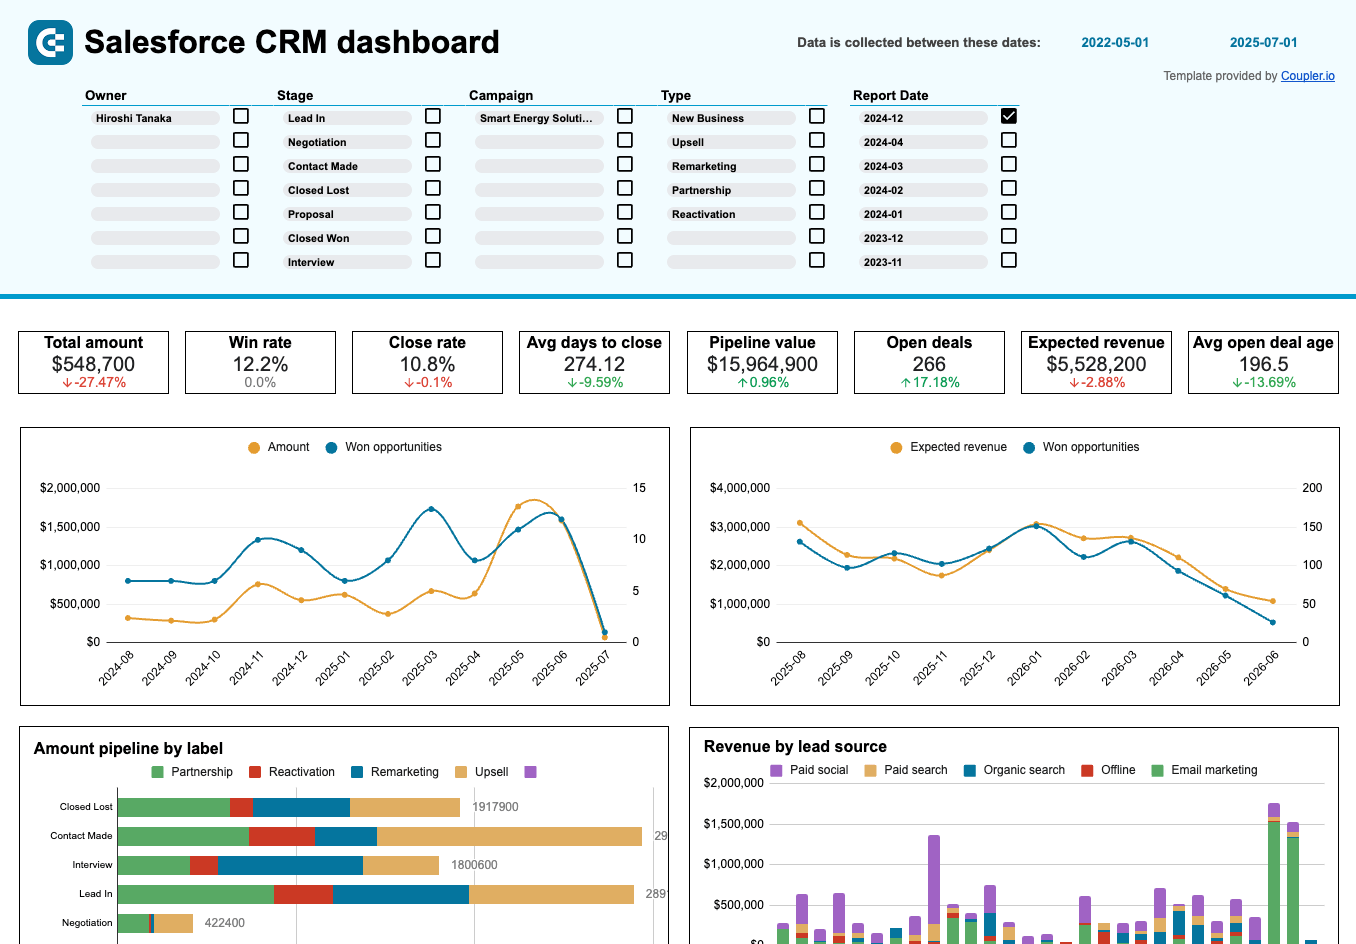
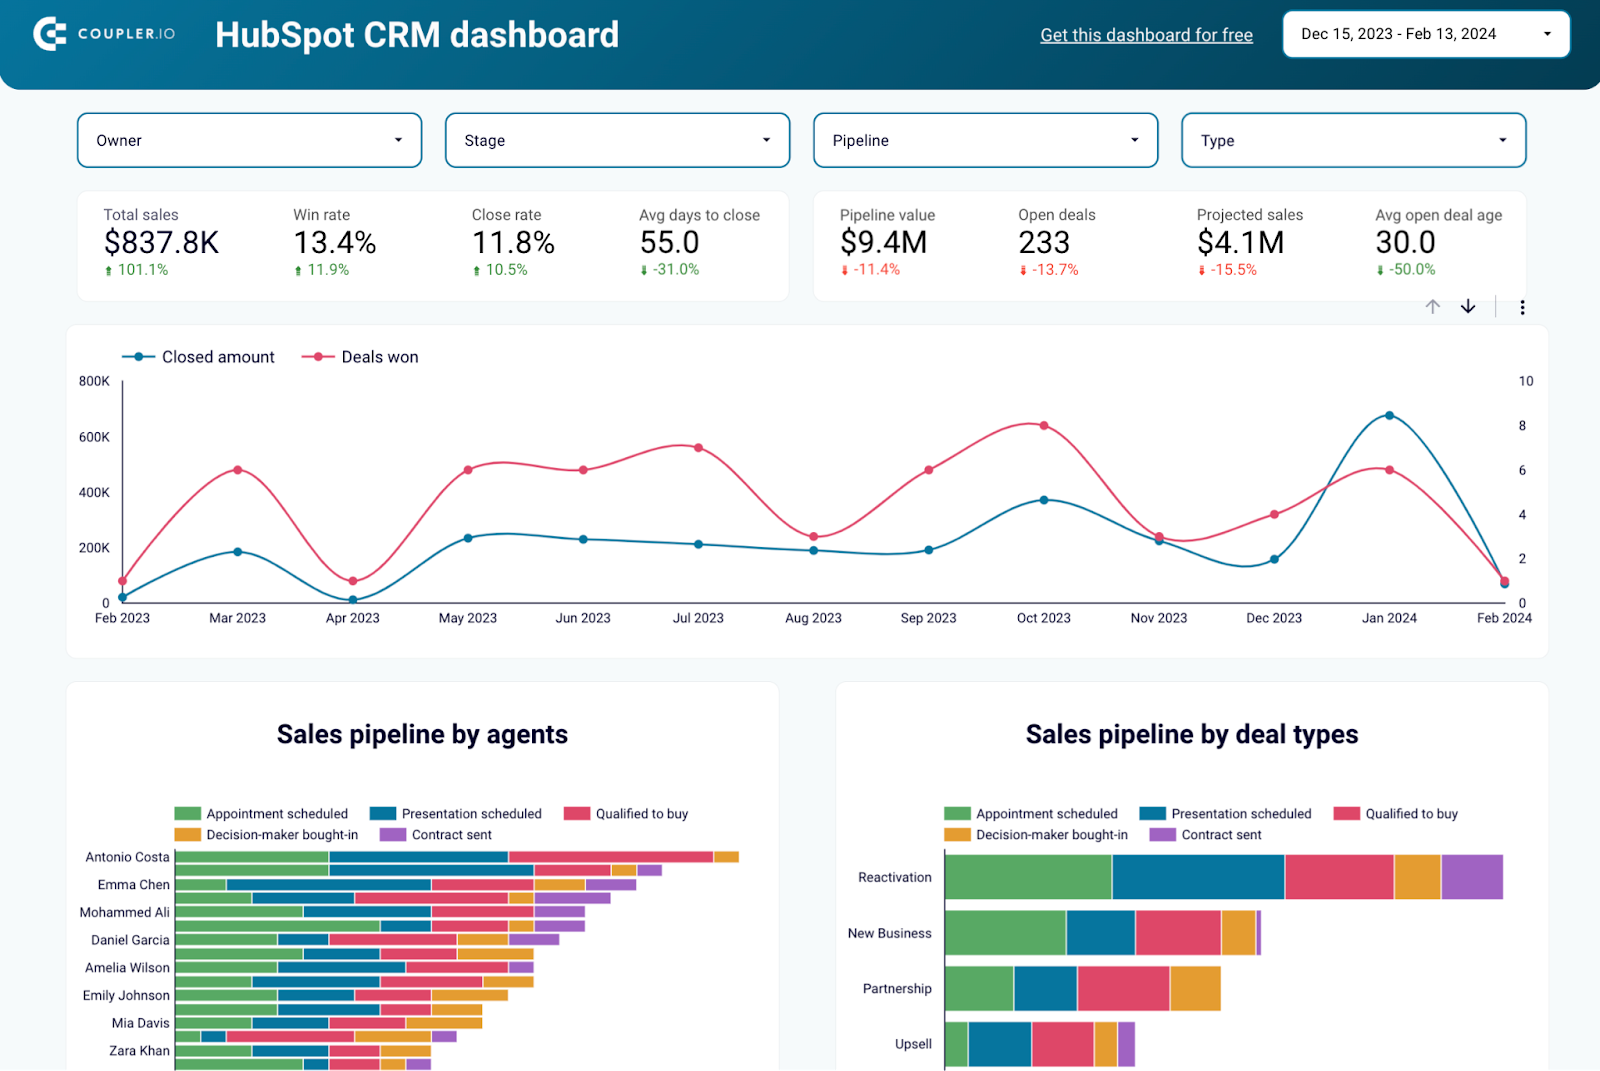
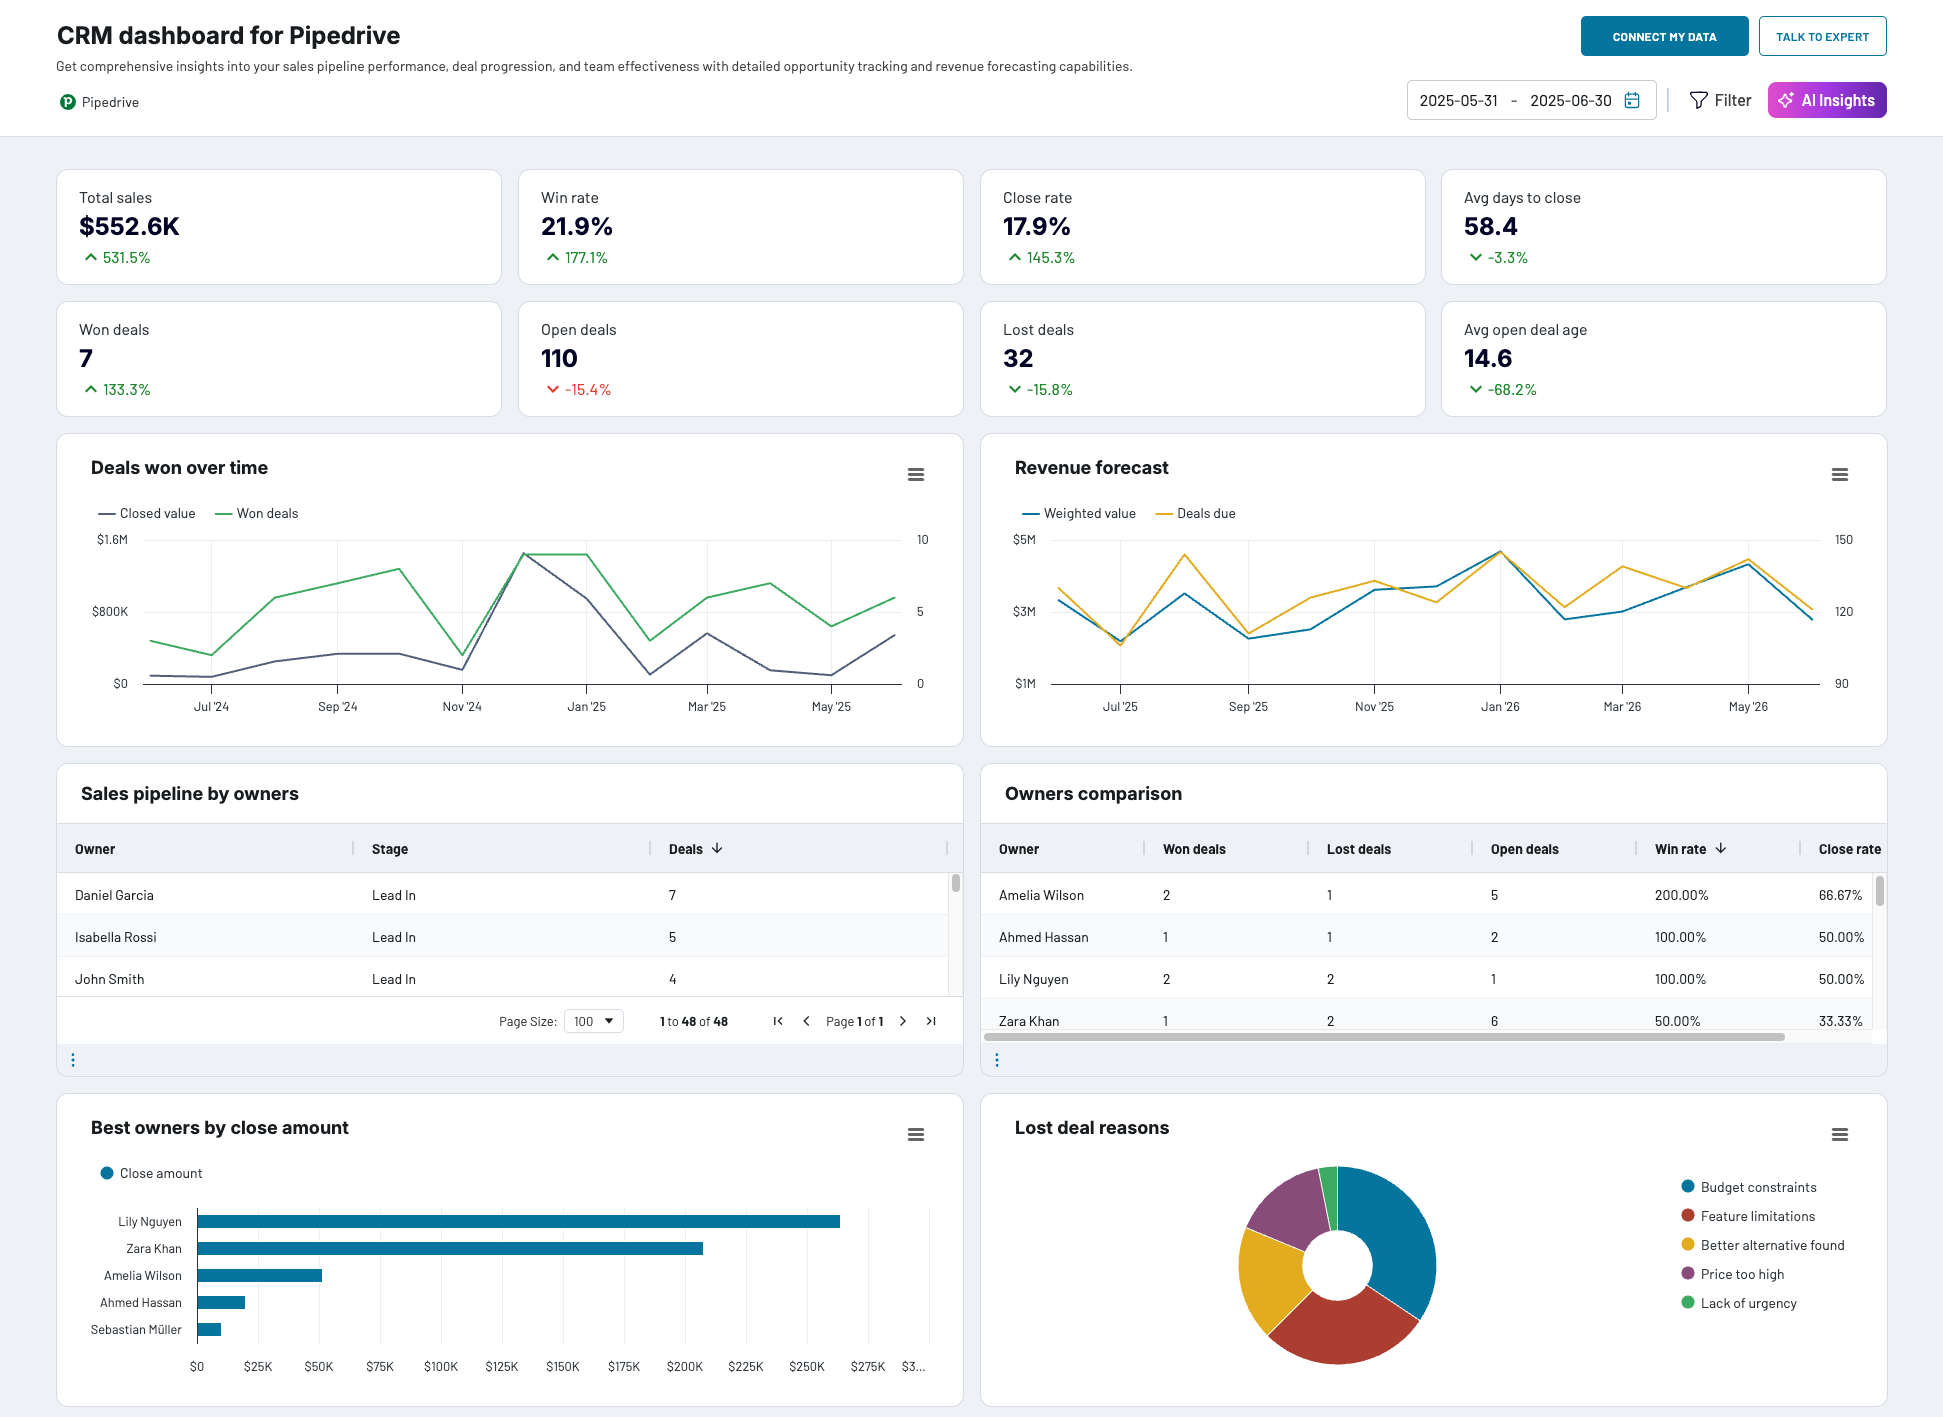
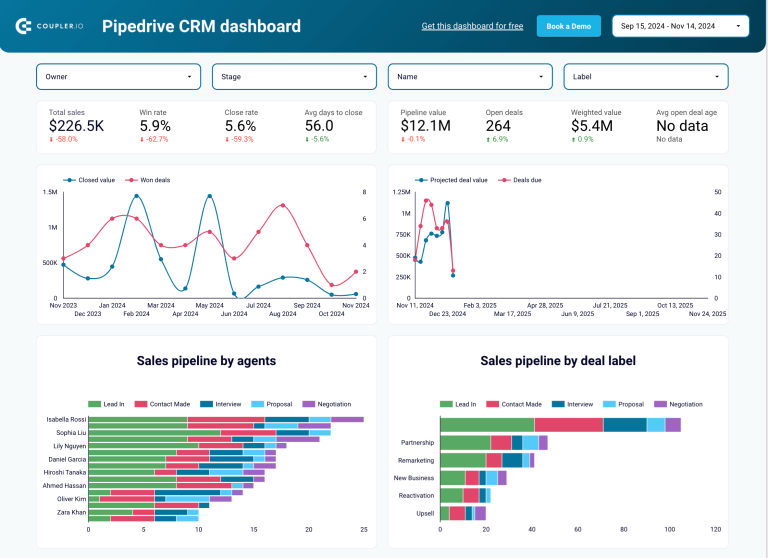
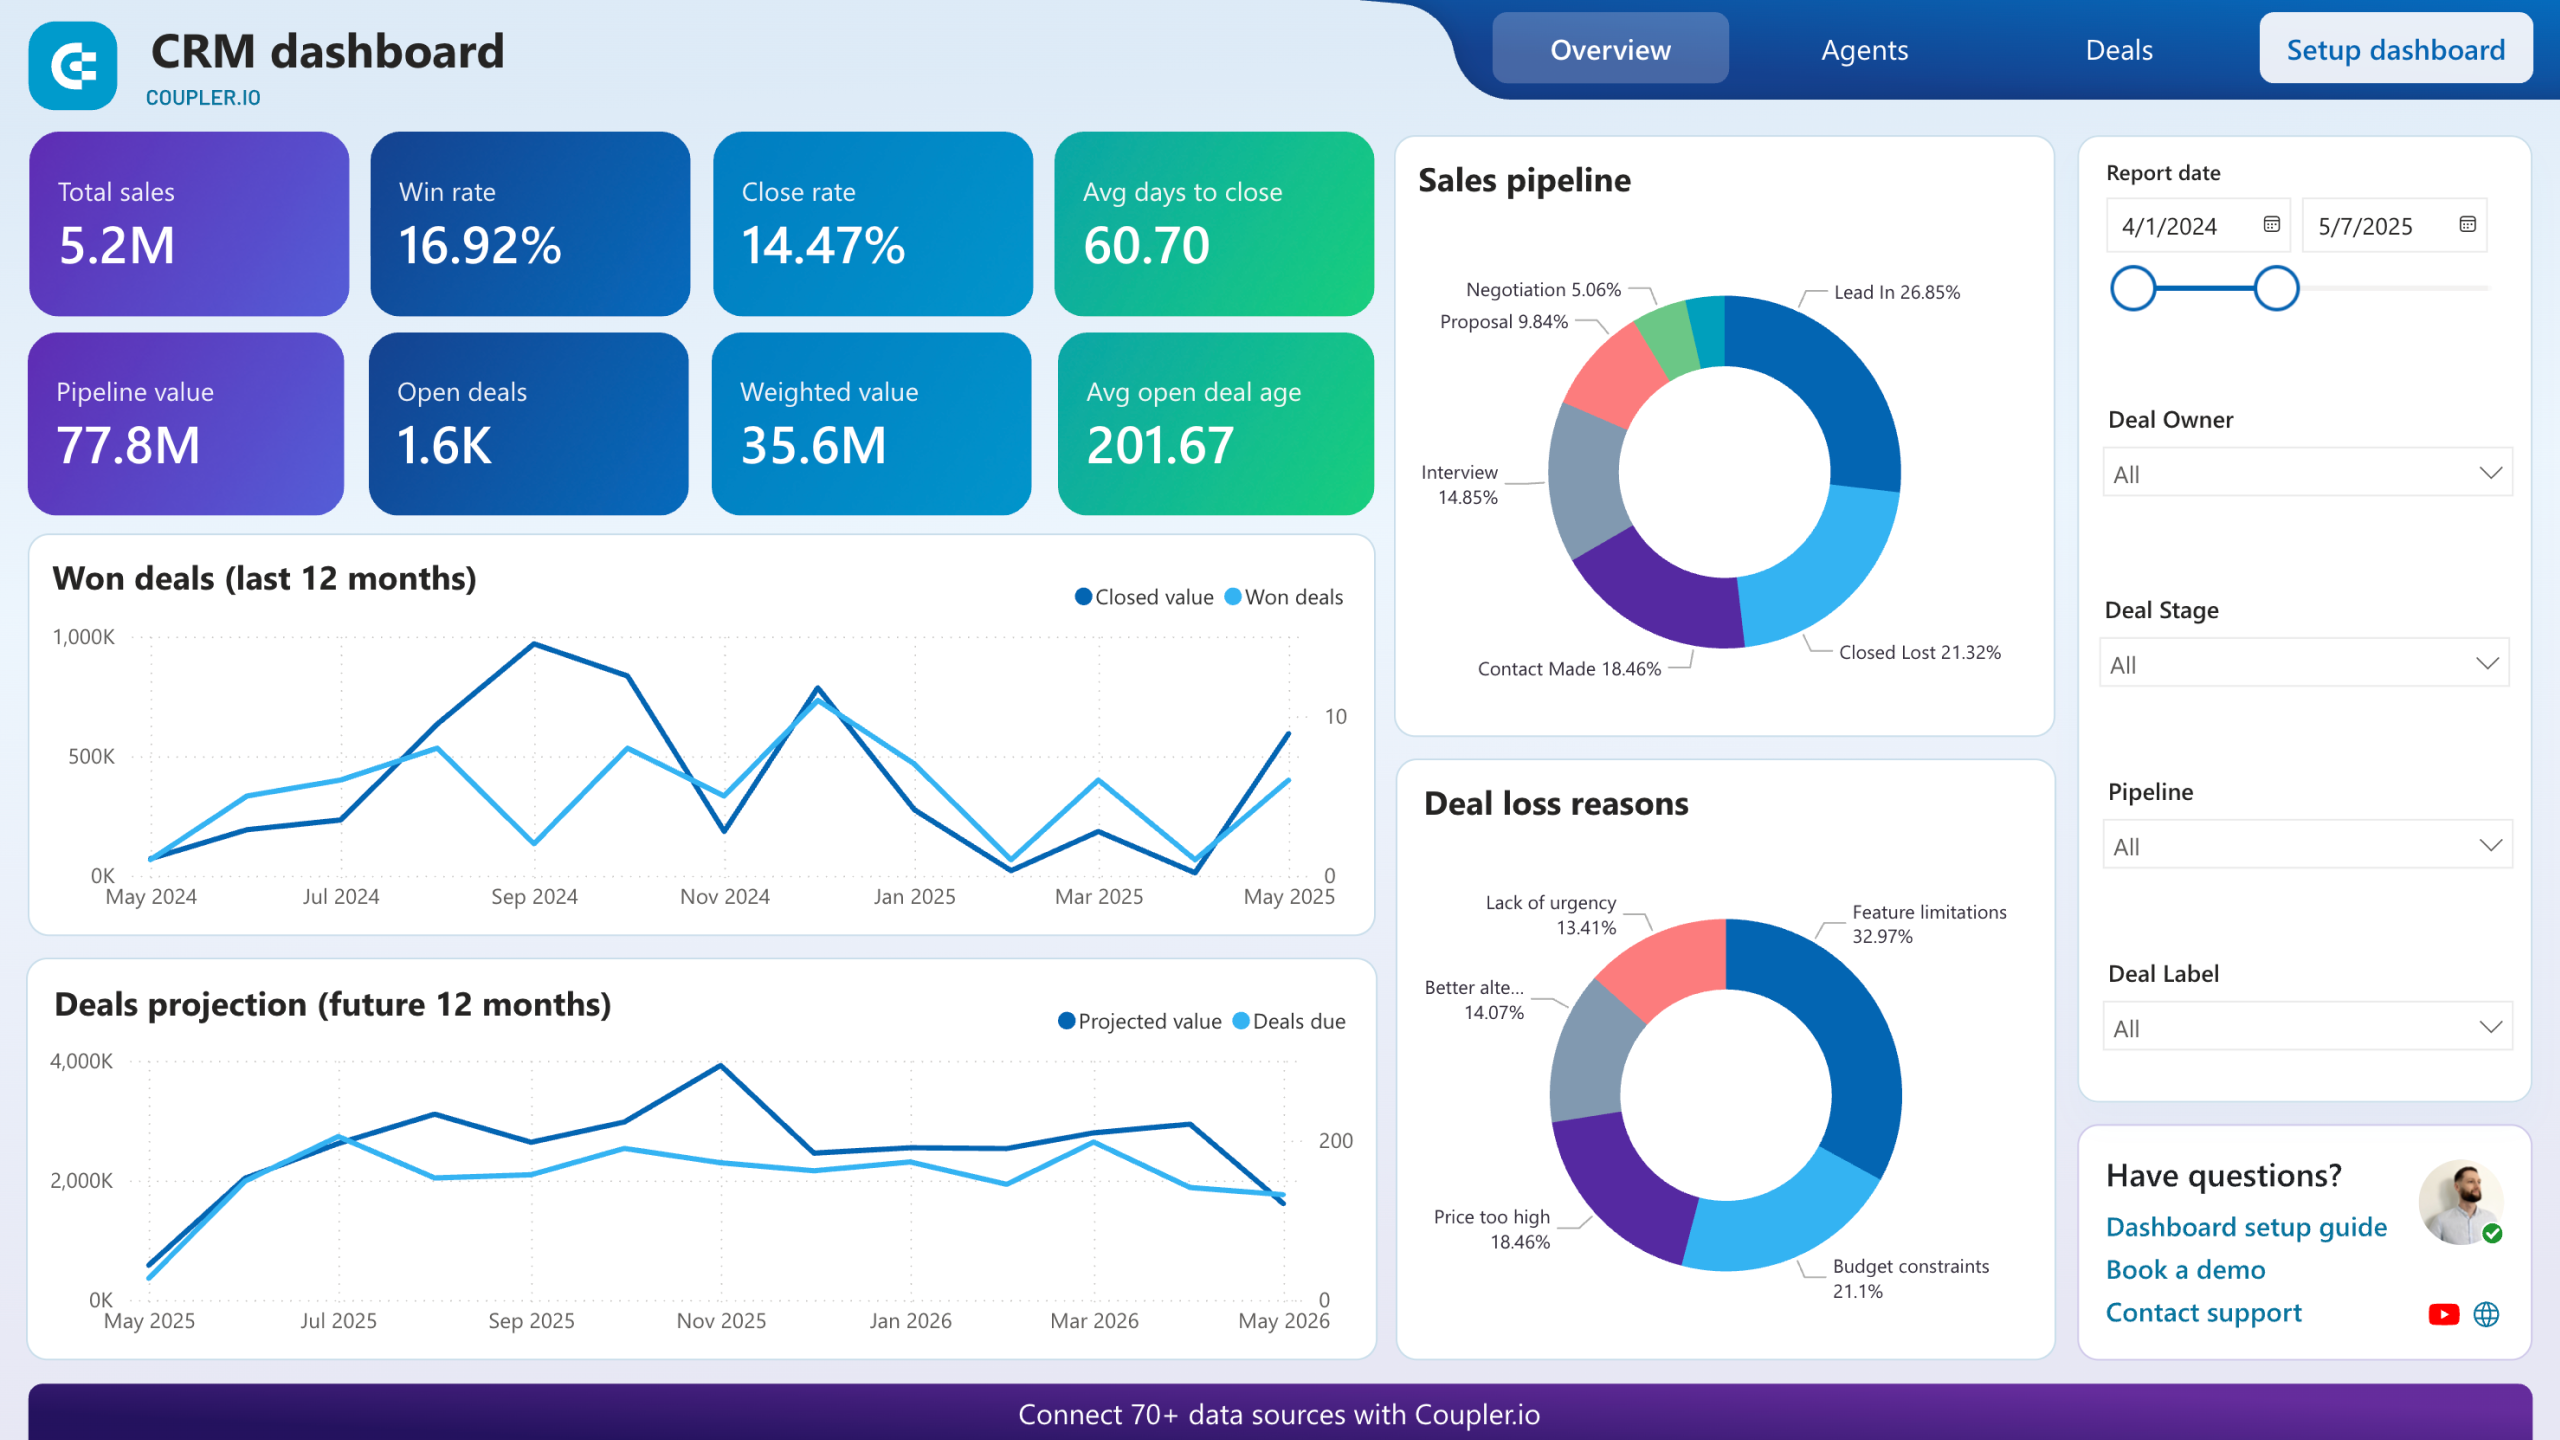
Sales report example – CRM dashboard for Salesforce, HubSpot, or Pipedrive
This sales dashboard gives you a detailed overview of your sales pipeline and other major KPIs. The built-in connector by Coupler.io regularly imports fresh sales data from your CRM app.
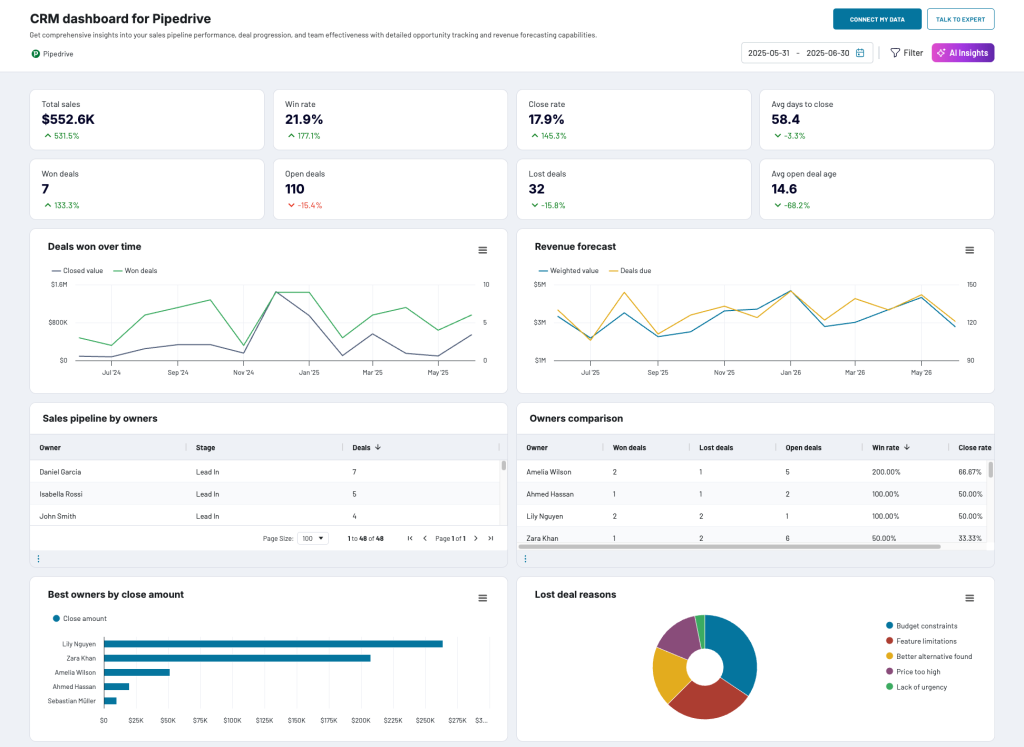
The template can be used for either Pipedrive, Salesforce, or HubSpot CRM. Connect your account and enjoy the scheduled refresh provided by Coupler.io.


These are just a few examples of ready-to-use automated reports provided by Coupler.io. We encourage you to explore more options in our template gallery with over 100 dashboards for different categories.

Explore automated dashboard and report templates by Coupler.io
Go to the galleryThings to consider when you schedule a report
Whichever option to schedule reports you go with, there are several important factors to consider:
Report scheduling frequency: Choosing report scheduling intervals should be determined by the specific needs of the business. For some, daily reports might be necessary to monitor real-time metrics, while for others, weekly or monthly reports that track performance are sufficient. While tracking inventory levels can be scheduled every week, website-related report scheduling should rather be updated daily.
Regular supervision of scheduled reports: Even the most reliable report scheduling solution needs to be checked on a regular basis. If you have a daily report refresh automated, it’s okay to check the status of your data once a week. For more frequent updates, be sure to make your data check-ups more frequent.
A very useful feature here is a notification that you will receive in case of an unsuccessful run of your automated refresh. Such alerts will let you know about a failure right away so you’ll be able to fix it without hindering the overall operation.
Is report scheduling needed for my business?
Report scheduling is useful for any type of business, be it a small ecommerce shop or a large SaaS company that runs hundreds of versatile reports. The area where you can benefit from scheduling reports is not limited to financial, sales, or marketing. Basically, every activity associated with reporting and analytics can be optimized with the help of automation and scheduling.
There are many examples of how automated report scheduling is driving business success. Within the sphere of marketing, report scheduling helps in tracking the performance of social media campaigns. For instance, by scheduling daily or weekly reporting that provides real-time insights into engagement rates, click-through rates, and conversion rates, a marketing agency can identify the most effective tactics and strategies. By doing so, the marketing firm can adjust its campaigns if needed in order to maximize impact and improve results.
For an e-commerce business, weekly report scheduling can be useful in terms of tracking inventory levels, sales performance, and shipping metrics. By scheduling weekly reports that provide insights into metrics such as sales volume, customer satisfaction ratings, and shipping times, the company can identify areas for improvement and adjust its operations accordingly. This can greatly improve the business’ efficiency as well as profitability.
For a SaaS company, daily reports can help track real-time user engagement and subscription metrics. Scheduling daily reports that provide real-time insights into metrics such as user activity, subscription, churn rates, and feature usage, the firm can adjust its product roadmap along with marketing strategies to improve user engagement and retention.
In essence, through report scheduling, businesses can save time and ensure that reports are generated and distributed in an organized and timely manner. This, in turn, allows organizations to make informed decisions that are based on real-time data and adjust their strategies as needed. For more on this topic, see our article about SEO reporting dashboards.
Automate reporting with Coupler.io
Get started for free