When you understand the ins and outs of your customer journey, you can level up your sales process. To get this understanding, use the visualized sales funnel. However, visualizing the funnel can be a complex and time-consuming process. Thankfully, templates can simplify and speed up this task.
This guide will help you improve your sales funnel and make analysis a much simpler and more efficient process through the use of templates.
Free sales funnel templates with automated reporting
Visualizing sales funnel data can be challenging, especially with multiple data sources. Thankfully, Coupler.io offers free dashboard templates for automated reporting. Let’s explore some options designed for your sales funnel.
1: Sales team performance dashboard for Salesforce
This sales team performance dashboard provides a comprehensive view of your sales team’s performance using Salesforce data. The dashboard is created in Looker Studio and Google Sheets. It’s perfect for teams with two or more sales managers.

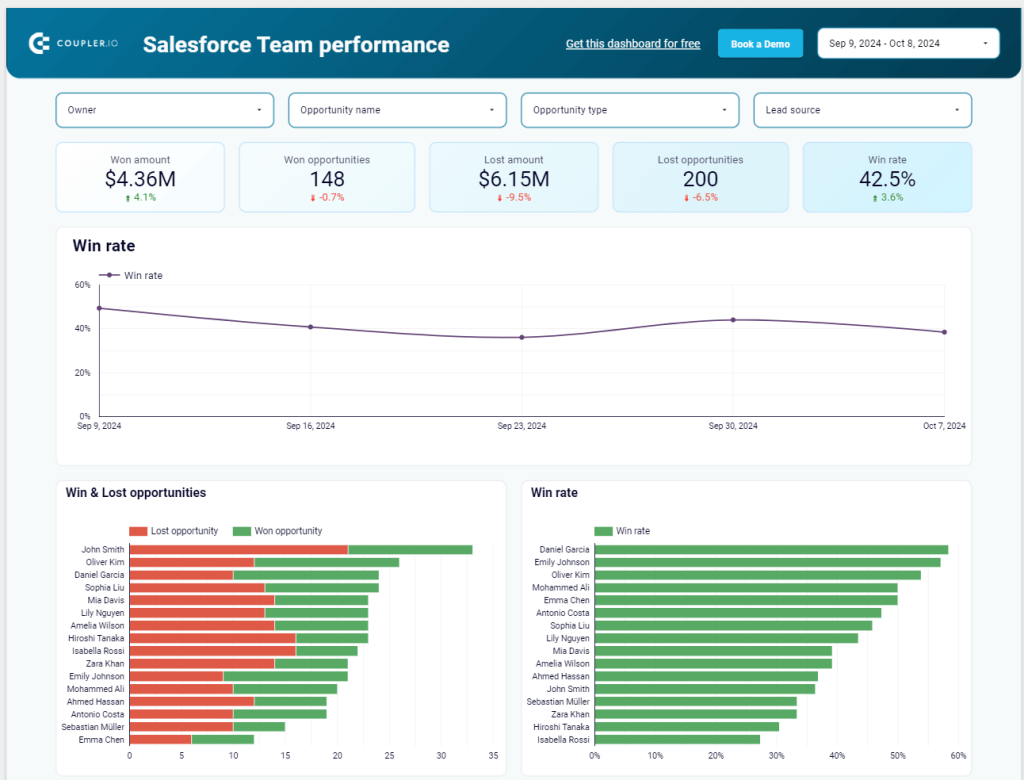
Insights you can get
Sales pipeline by owners: A stacked bar chart that visualizes how each sales manager’s funnel progresses through different opportunity stages. By default, the chart is sorted by the number of opportunities, from high to low. Each bar has different colored segments, showing various opportunity stages.

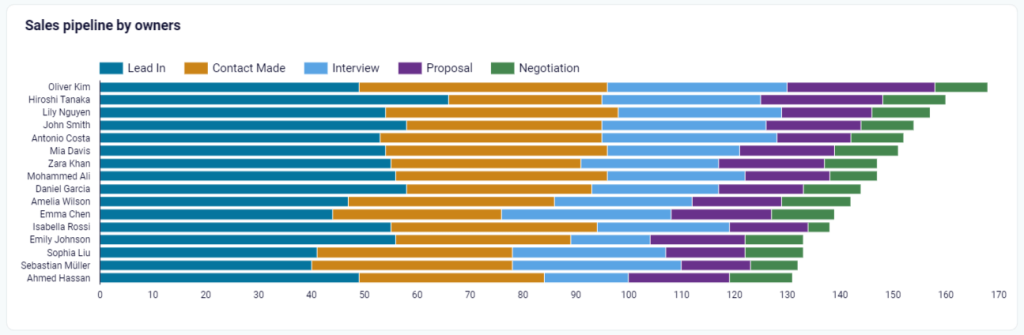
From this funnel, you can draw the following conclusions:
- The team member with the longest bar has the most opportunities.
- Team members with more deals in later stages (like Proposal and Negotiation) are better at moving opportunities forward.
Learn more about the difference between sales pipeline vs. sales funnel.
By analyzing these factors, you can identify which sales managers excel or need help. This allows you to make informed decisions for training and resources.
How to use the dashboard template
To get started, check the Readme page of this template for step-by-step instructions. You’ll need to install the Coupler.io connector for free to connect your Salesforce data with the dashboard in Looker Studio or Google Sheets.
If you don’t have a Coupler.io account, you can create one by signing up with your Google account. It’s free, and no credit card is required.

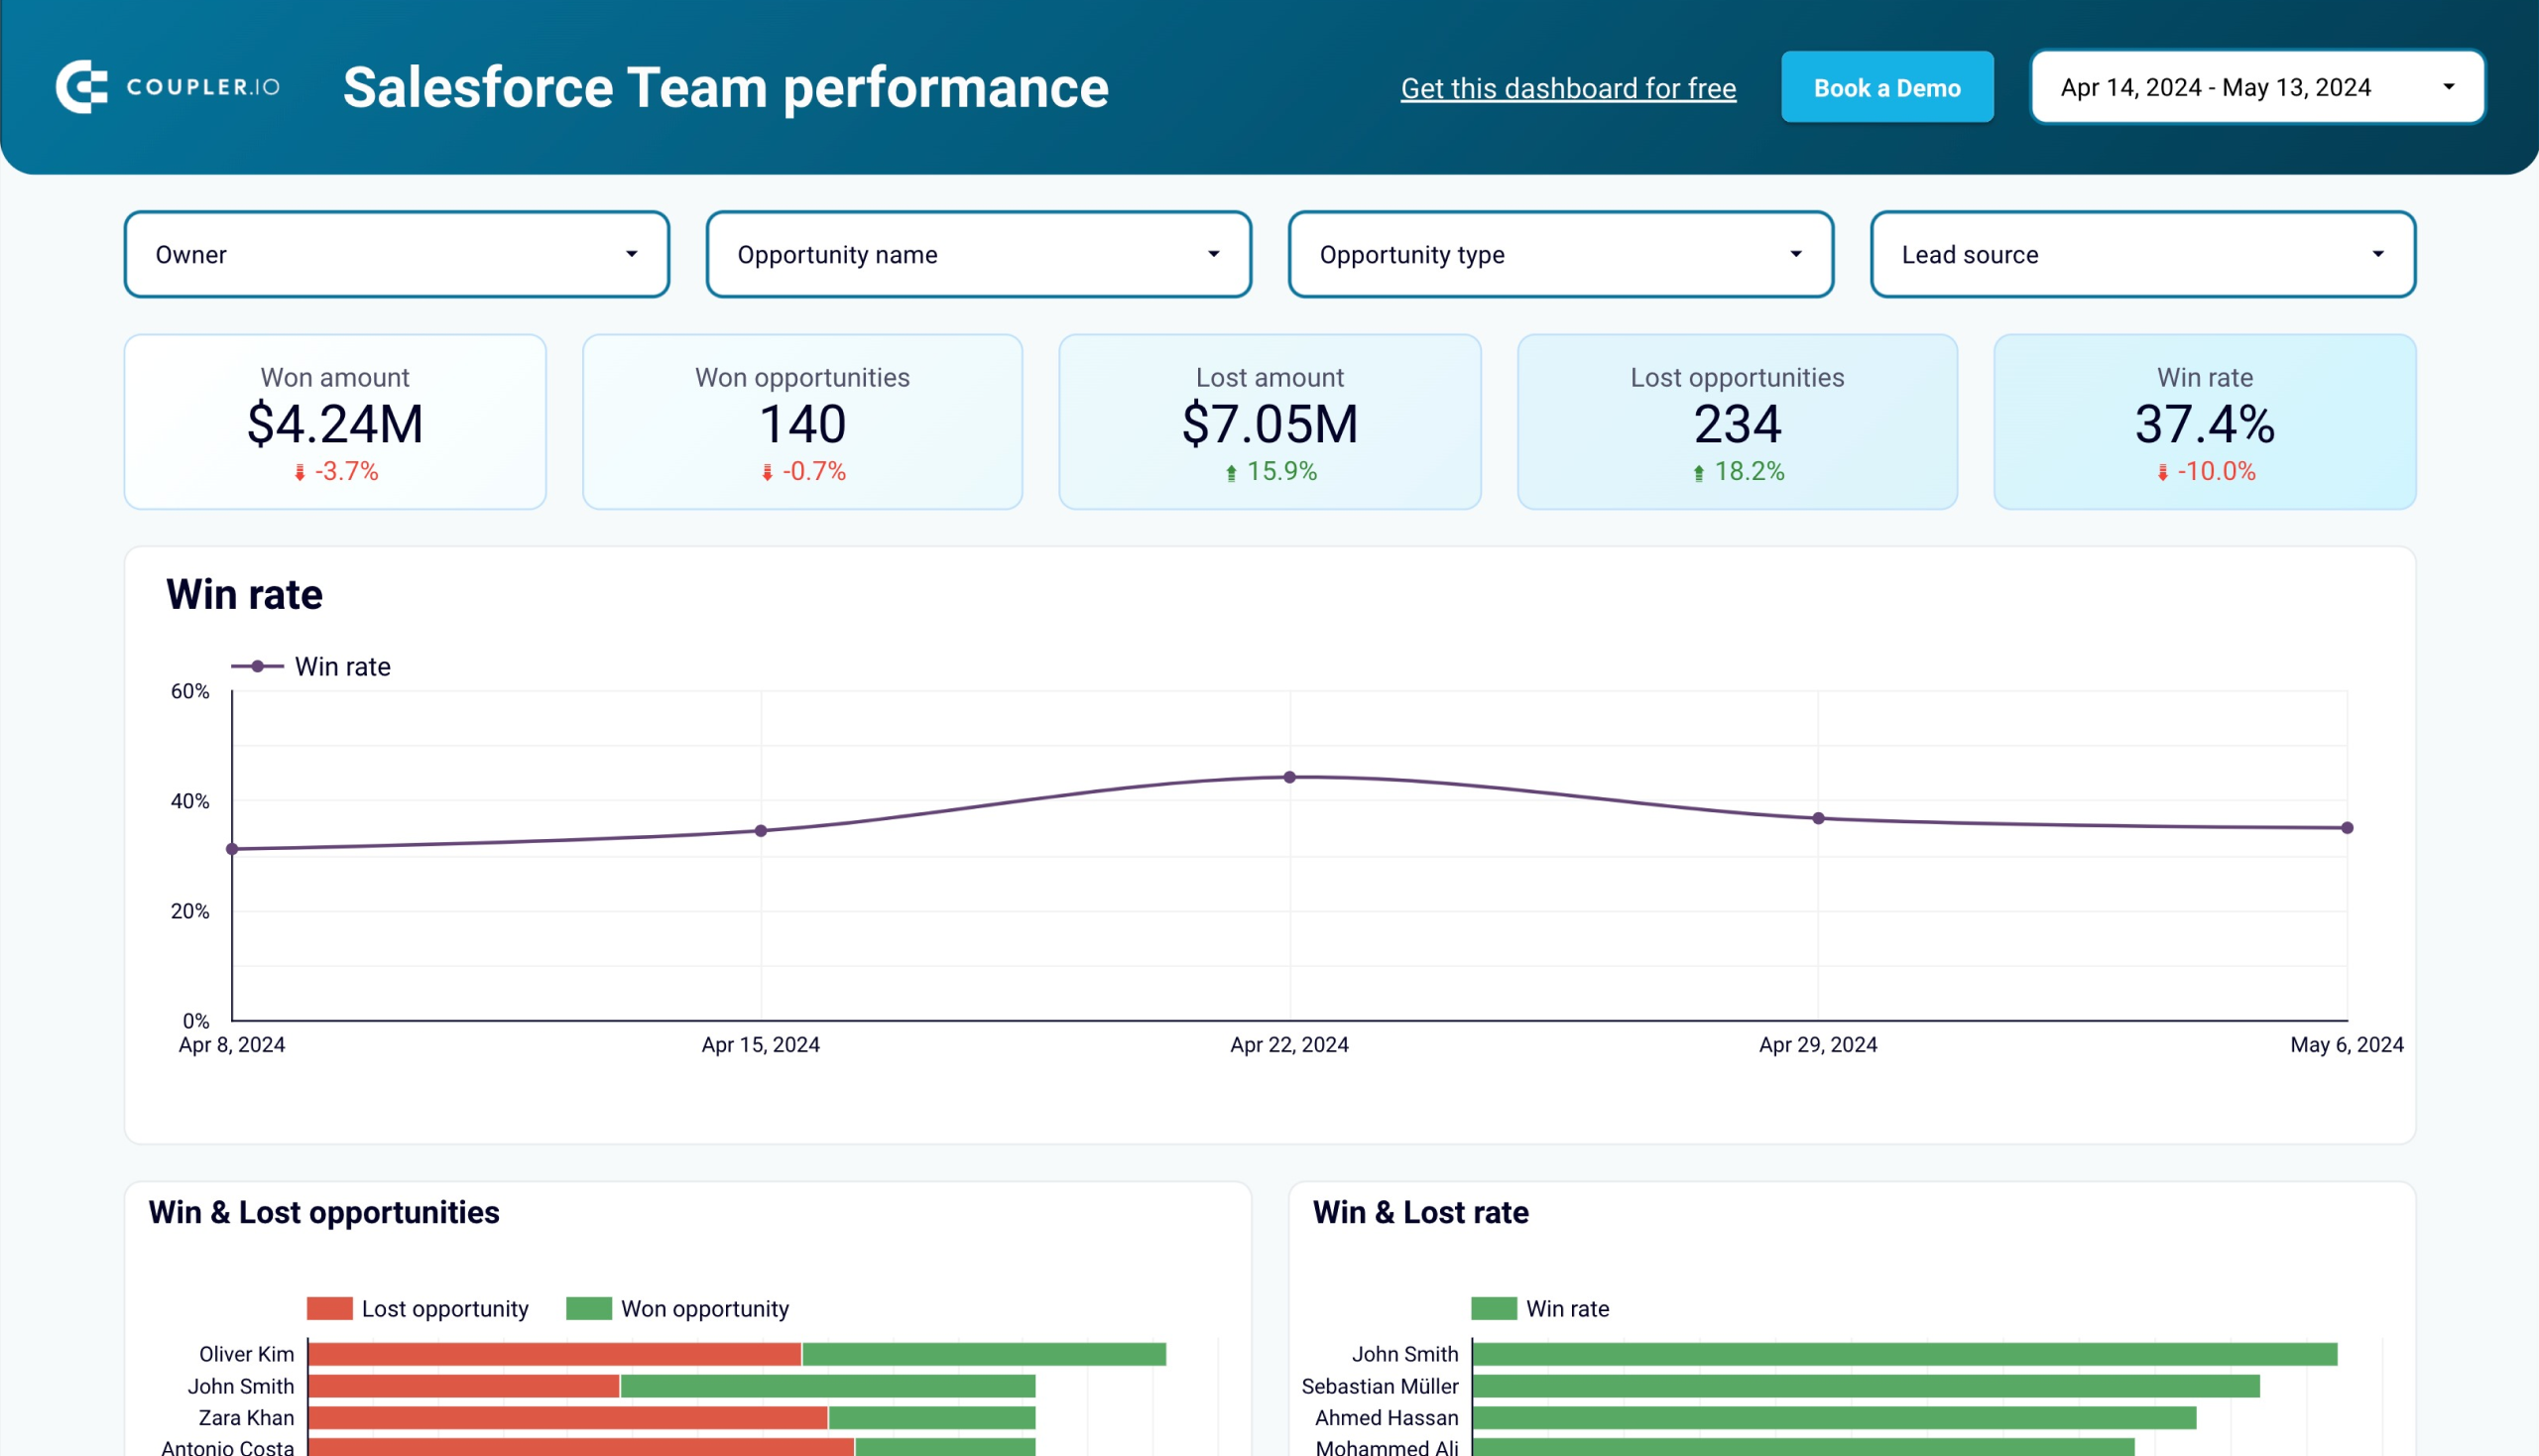
Sales team performance dashboard for Salesforce in Looker Studio
Get insights into your sales team’s effectiveness in converting opportunities within your sales pipeline in Salesforce.


Sales team performance dashboard for Salesforce in Google Sheets
Monitor the effectiveness of your sales team and derive insights into how to optimize your sales pipeline conversions in Salesforce.
2: Customer acquisition dashboard for Pipedrive/HubSpot
This customer acquisition dashboard allows you to analyze the performance of traffic and paid advertising channels in terms of lead generation. The template is designed in Looker Studio and merges data from a CRM app (Pipedrive or HubSpot), GA4, and major ad platforms like Google Ads, Facebook Ads, Bing Ads, etc.

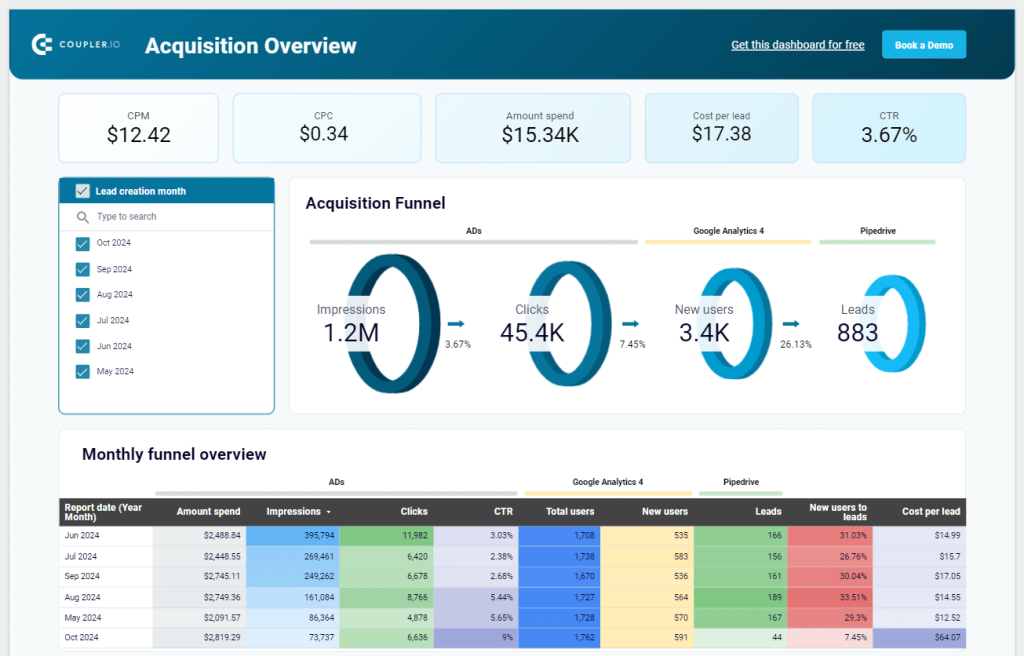
Insights you can get
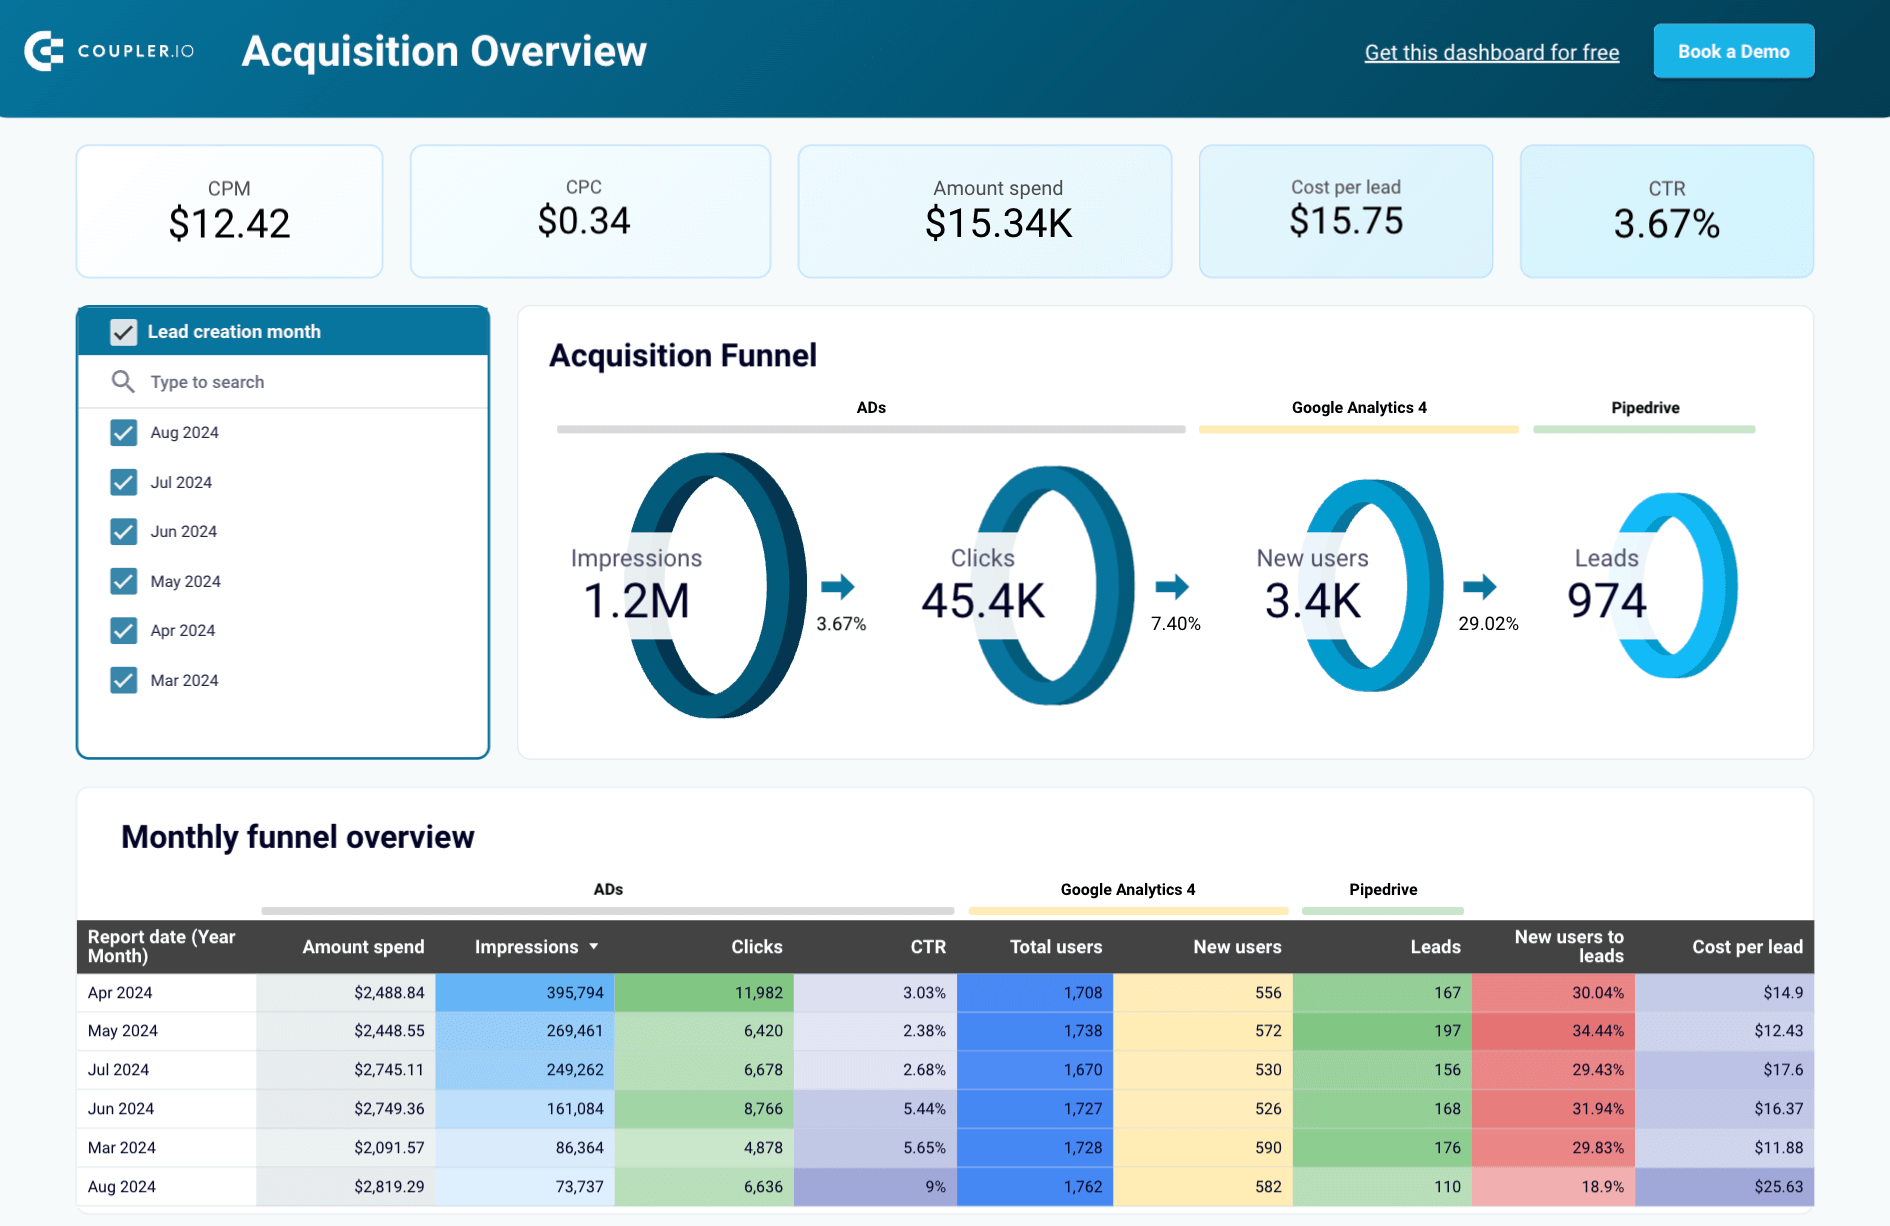
Acquisition funnel: This visualization is useful for tracking your multi-source acquisition efforts. It helps you track ad impressions and clicks, website visits, and leads entering Pipedrive.

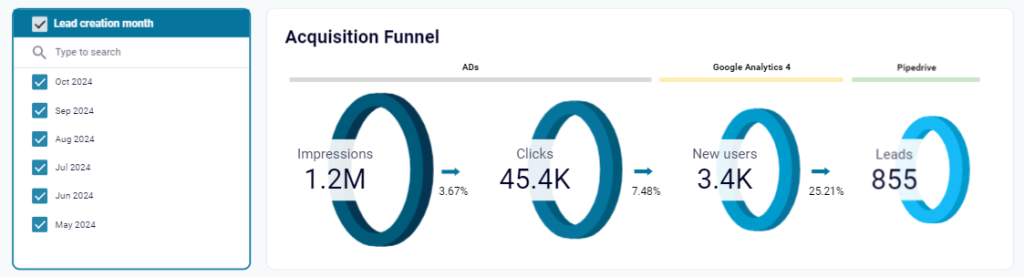
You can view conversion rates under the arrows. Compare them to industry benchmarks to identify funnel leaks and create strategies. For example, in e-commerce, lead conversion rates are typically 1% to 3%. If yours drops despite high traffic, this indicates it might be time to improve your calls-to-action.
Monthly funnel performance overview: Under the acquisition funnel, you’ll see a table showing monthly performance changes. You can assess how your ads are performing month by month by looking at how many impressions/clicks/new users you are getting and the cost per lead.

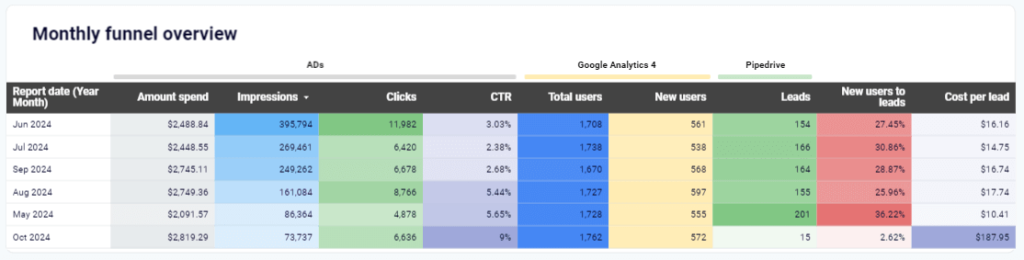
Analyzing the data helps you draw correlations between marketing activities and lead generation results. For example, by identifying the best-performing months, you can understand the effectiveness of specific marketing campaigns or seasonal trends. A high cost per lead indicates that you might need to reallocate your budget to more cost-effective campaigns.
How to use the dashboard template
Don’t worry about combining this data—simply follow the instructions on the Readme page and let the Coupler.io connector do all the work. Ads and Google Analytics reports cover the past 6 months of data by default, but you can customize this if necessary.

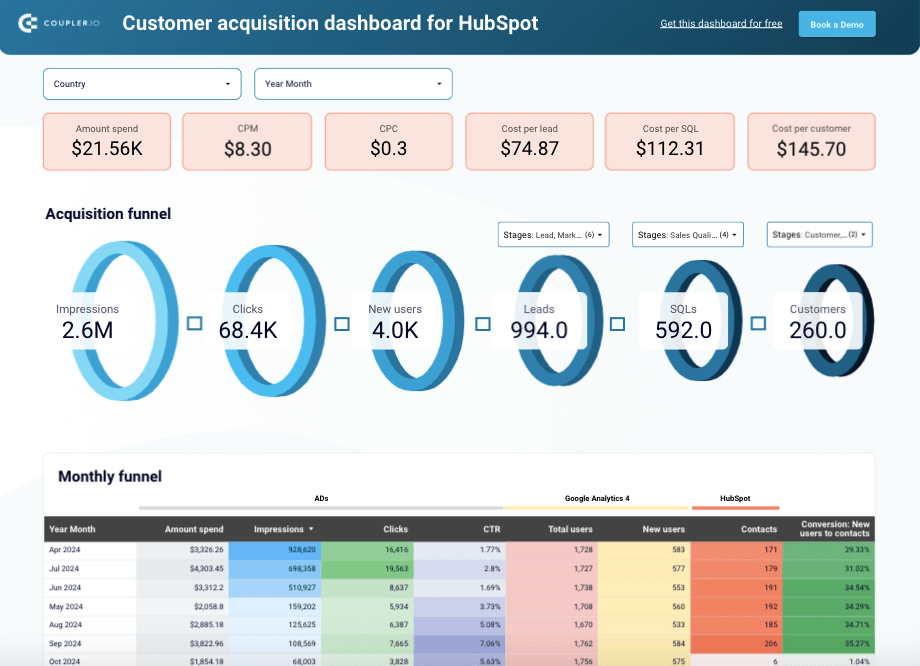
Customer acquisition dashboard for HubSpot
Monitor your acquisition funnel and analyze its effectiveness using the insights from HubSpot CRM, advertising platforms, and Google Analytics 4.

Customer acquisition dashboard for Pipedrive
Use one dashboard to analyze the effectiveness of your Pipedrive acquisition funnel. Gain insights from data sourced from ad platforms and Google Analytics 4.
3: Sales analytics dashboard for Salesforce
This sales analytics dashboard allows you to analyze leads and revenue by marketing channels. It combines data from Salesforce, GA4, and ad platforms you use for lead and revenue generation.

Insights you can get
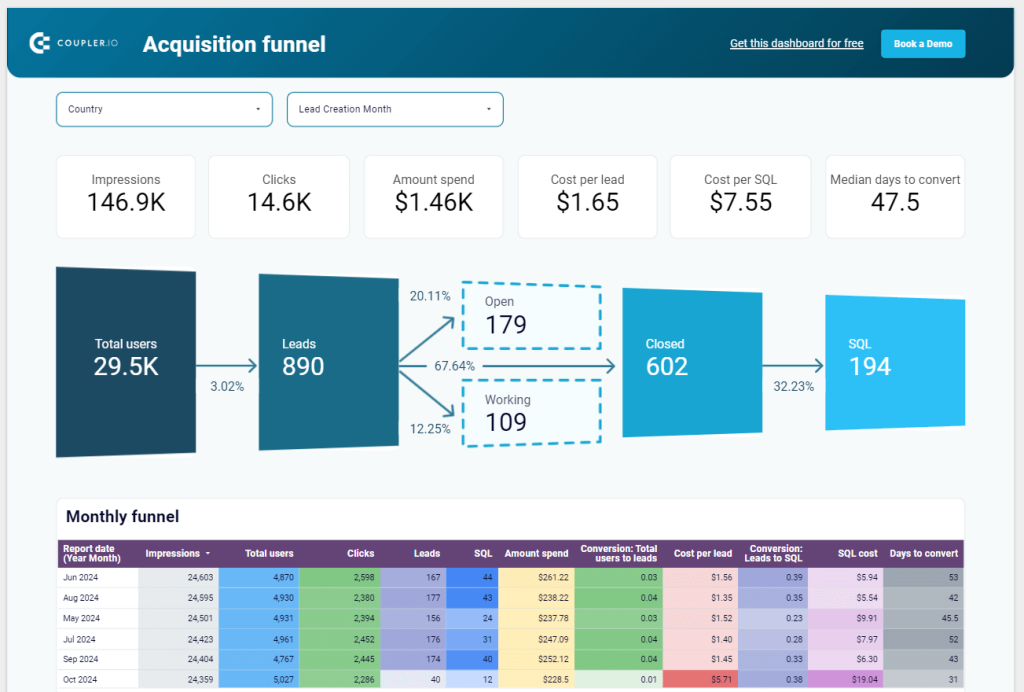
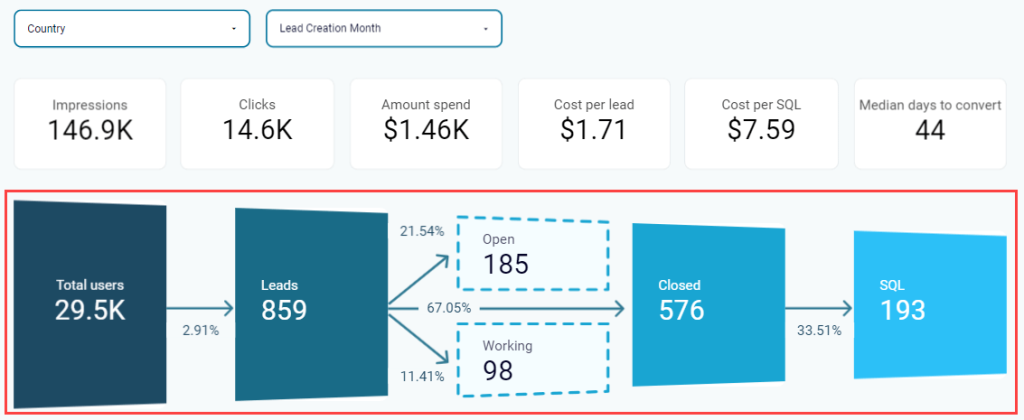
Sales funnel: This visualization tracks the transition from user to sales-qualified lead (SQL). It also displays conversion rates. By comparing these rates to industry benchmarks, you can see how well your traffic performs.

Consider these strategies to boost revenue if certain stages aren’t performing well:
- Ensure forms are easy to fill out to efficiently convert users into leads.
- Use targeted campaigns to nurture open/working leads, providing valuable information to guide them toward making a purchase.
- Refine criteria for SQLs to ensure you’re focusing on high-potential prospects.
This Looker Studio sales dashboard enables you to apply filters by country to determine which regions are best for lead generation and conversions. You can also spot issues. For example, if you get many leads from France but few sales, there might be problems like language barriers or shipping concerns that you need to address.
Monthly and geo funnels: Below the sales funnel, you can see tables showing the performance comparison of different months and regions. These help you identify top-performing segments and correlate them with marketing or lead-generation activities to uncover growth opportunities.

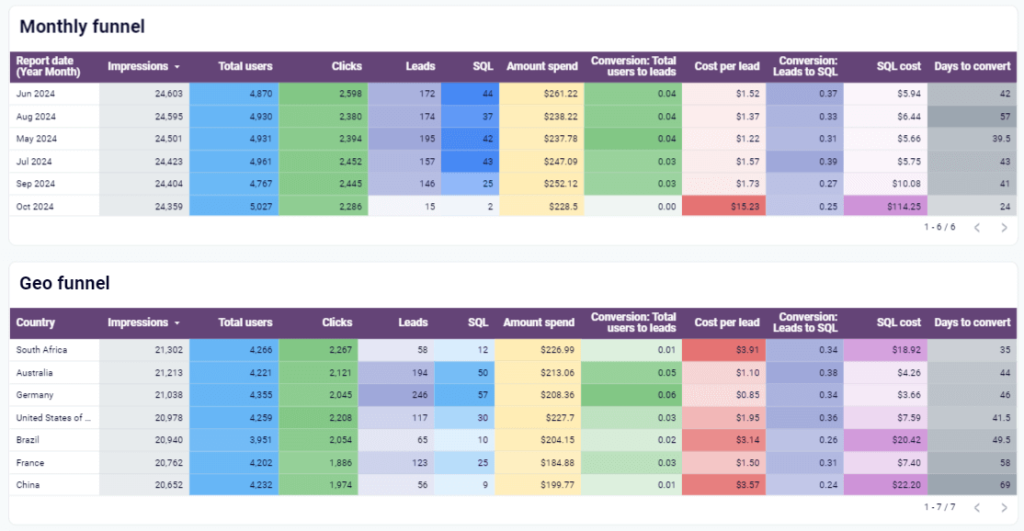
The tables also show a comparison of the total ad spent, cost per lead, and days to convert. Analyzing these figures allows you to adjust your budget to get improved results and faster conversions.
How to use the dashboard template
Find the setup instructions for this lead generation dashboard on the Readme page. After connecting your Ads, GA4, and Salesforce data, you can adjust the report period (set for the last 6 months by default).
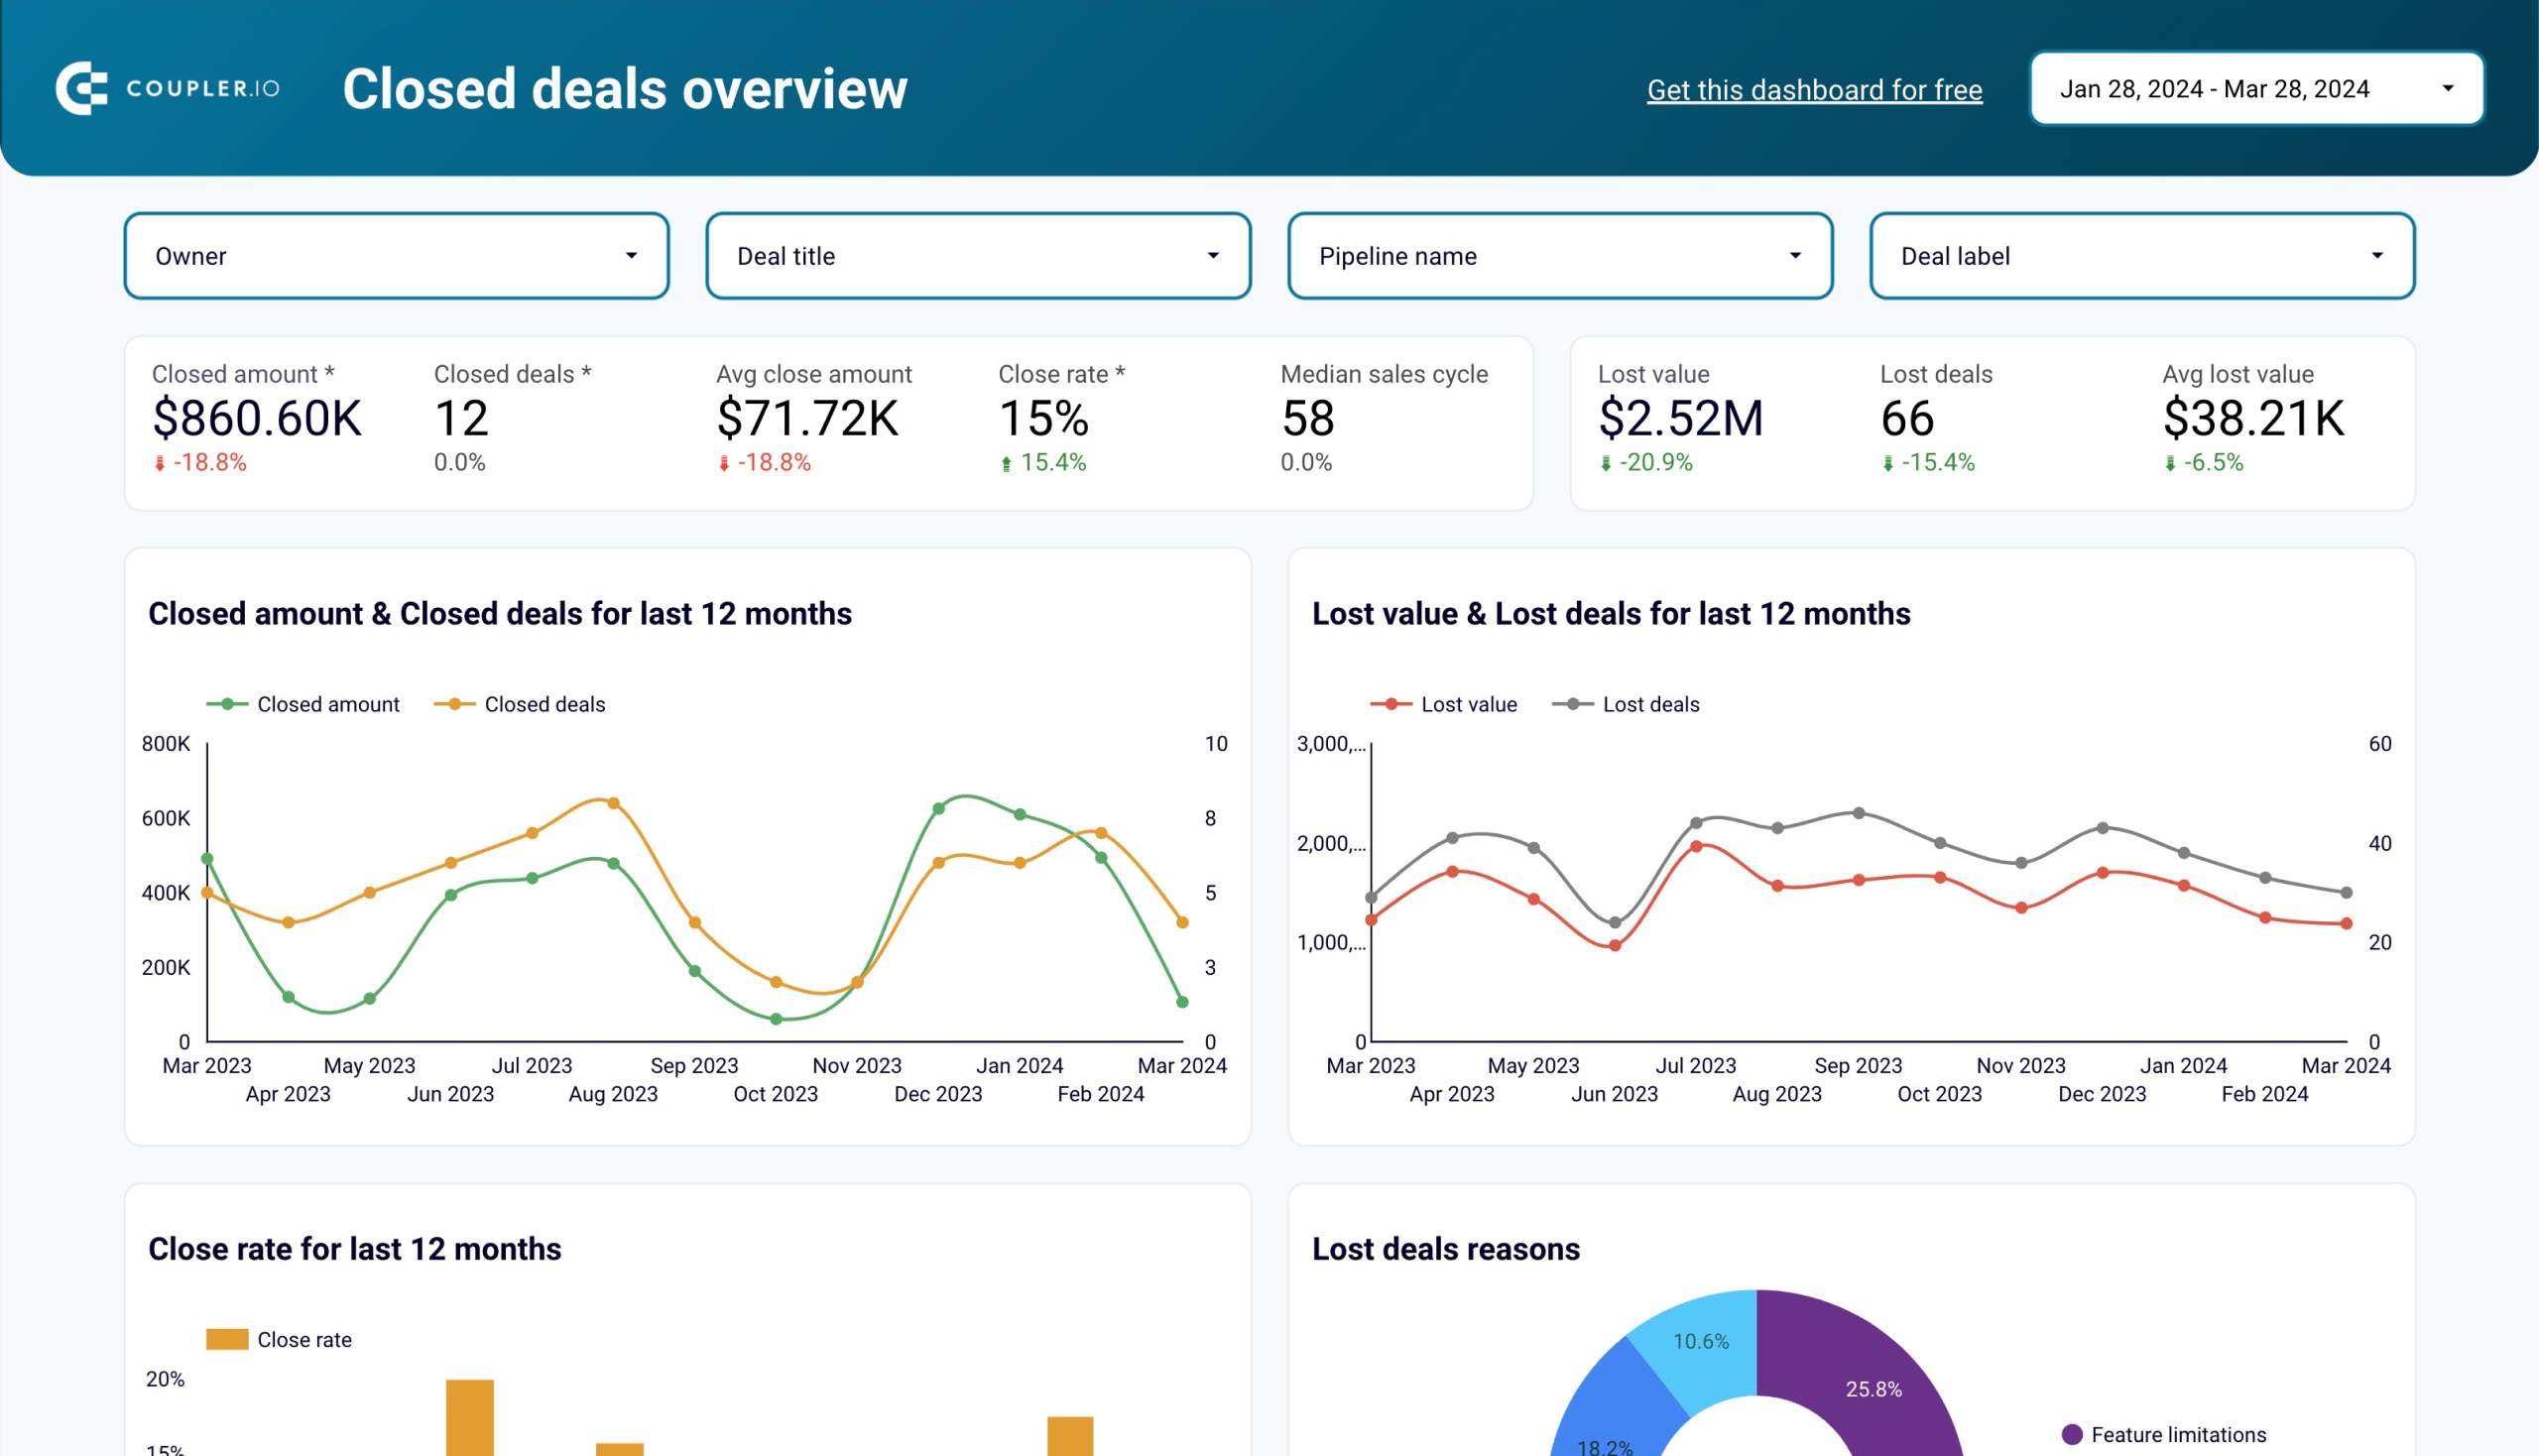
4: Sales KPI dashboard for Pipedrive/HubSpot
This sales dashboard provides a clear view of your sales performance, enabling you to make strategic decisions. It is crafted in Looker Studio and uses data from Pipedrive or HubSpot.

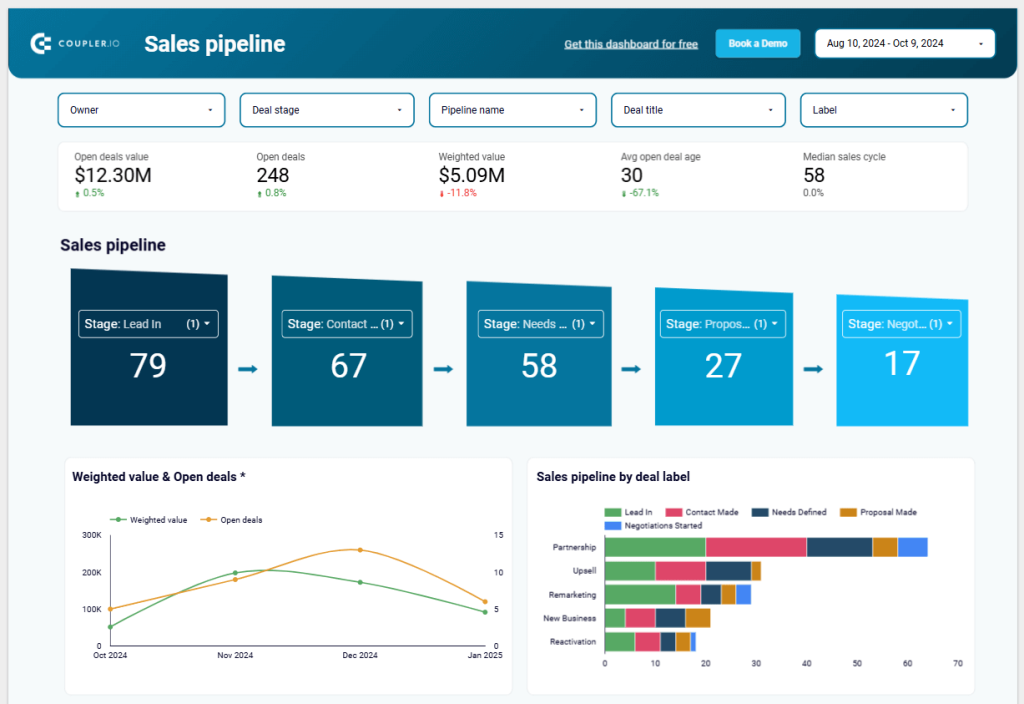
Insights you can get
Sales pipeline: This visualization is customizable. You can set up to five stages relevant to your process. Additionally, you can filter the funnel by owner, deal stage, pipeline name, deal title, and label.

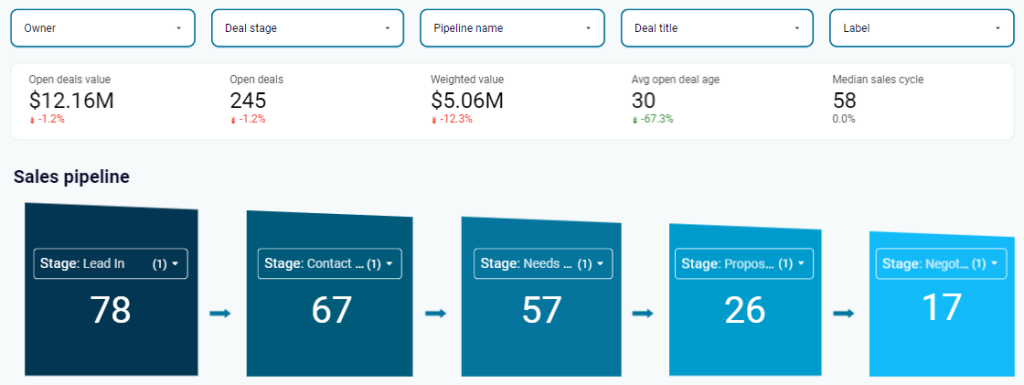
This dashboard is great for helping you identify where major drops occur in your sales process to optimize sales activities. For example, if deals are stuck too long in a specific stage, it might be a signal to review your process or provide your team additional support to help move them forward.
Sales pipeline by owners: Allows you to compare team achievements.
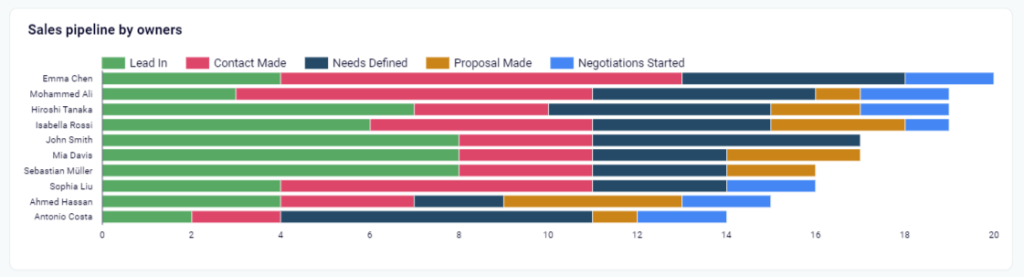
To understand why some salespeople are doing better than others, you can look at the kinds of deals they’re handling or the pipelines they’re working in. For instance, one salesperson might close deals faster because they deal with smaller, quicker transactions. Another might be good at managing bigger, more complicated deals that take more time. By spotting these patterns, you can understand their strengths and use this knowledge to boost your entire sales approach.
How to use the dashboard template
It’s easy to start. Open the dashboard’s Readme page. Follow the instructions to connect your Pipedrive or HubSpot account and populate your Looker Studio dashboard with data.

Sales KPI dashboard for HubSpot
Get an overview of the HubSpot sales metrics and KPIs to derive insights into pipeline health using our sales KPI dashboard.
Sales KPI dashboard for Pipedrive
Analyze the critical sales metrics and key performance indicators from Pipedrive to make smart strategic decisions.
What is a sales funnel?
Customers need to take several steps before they buy your product or service.
They might click an Instagram ad, check out posts and reels, visit your website, read online reviews, and finally make a purchase. They might also be dealing with automated emails and follow-up actions.
A funnel, or sales funnel, is simply a way to represent the customer journey as they move towards purchasing your product or service.
Picture it as an upside-down cone. The top is the widest part, the middle narrows down, and the bottom is the narrowest.

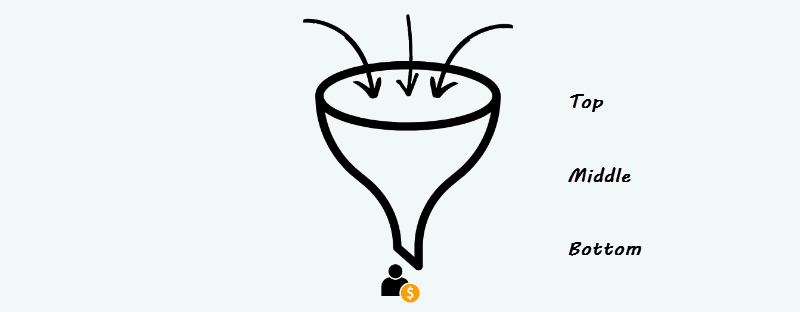
The top is wide, as you are trying to reach as many people as possible. This is where your marketing efforts raise awareness of your product or service to a broad audience.
As potential customers show interest, they progress to the middle of the funnel. At this stage, the focus is on nurturing their interest by providing additional information and addressing any concerns they might have.
Eventually, only a few will progress down to the bottom of the funnel—those who are ready to buy. This shows that while many begin the journey, only a small percentage convert into customers.
Bulletproof funnel framework
In reality, modeling human behavior with a simple funnel image is difficult. Each customer journey is unique, and each company is different—it sells different products/services and has different sales models.
The good news is there’s a proven way to create effective sales funnels: the AIDA framework.
AIDA stands for Awareness, Interest, Desire, and Action, which represent the basic steps a typical customer experiences when making a purchase. This marketing model emphasizes understanding the customer journey to optimize conversions.
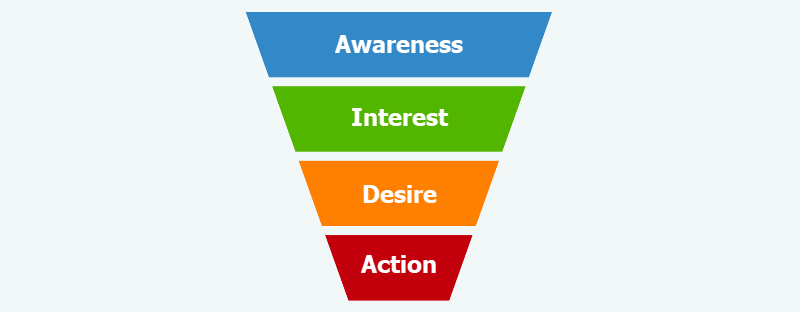
Let’s break down each AIDA stage:
- Awareness: At this stage, people are not yet aware of your product or service. Your goal is to introduce them to your product and pique their interest in learning more. You can invest in a blog/website optimized for SEO and share content on social media to create awareness. Additionally, consider running paid ads or partnering with influencers if you have the budget.
- Interest: Now, the prospect is curious about your product or service and wants to see how it solves their problem. Keep them engaged by showing them what makes your product or service special. You can achieve this by writing insightful blog posts and offering lead magnets like free e-books or webinars. Creating a landing page with all the essential product/service details is another effective way to make a strong impression and collect email addresses.
- Desire (also known as Consideration): At this stage, the prospect considers buying but needs more information before making the final decision. They might be reaching out with questions. Convince them by sharing client testimonials and case studies. You can also provide comparison guides and product demos if necessary.
- Action (also known as Conversion): This final stage is where customers make decisions. They may continue with their purchase or not. Several factors, like price, influence their decision. Provide clear CTAs, offer free trial promotions, sign-up discounts, limited-time offers, etc.
AIDA serves as the foundation funnel. Many businesses have expanded this model to include Loyalty (or Advocacy or Referral) as the fifth segment to capture a stage when a customer becomes loyal and refers the product to others. You’ll also find that many simply reference the stages as “Awareness – Consideration – Conversion”.
It does not matter how many stages you use or what you call them. The funnel is just a tool. The true priority is gaining a deep understanding of your customer’s journey.
How do you create a sales funnel?
Let’s explore the essential steps needed to build an effective sales funnel:
Step 1: Identify the target audience
Don’t try to sell to everyone—focus on your ideal customer instead.
Many small business owners make the mistake of aiming their products at “everyone,” but this approach can dilute your message and confuse potential customers. To get to know the person you’re selling to, focus on profiling your ideal customer through a detailed customer avatar. This involves understanding two crucial aspects of your audience:
- Demographics (like age, gender, and income)
- Psychographics (like values, interests, and spending habits)
Write everything in your copy—emails, social media posts, and ads—to speak directly to your target audience. This approach boosts conversion chances and builds stronger customer loyalty.
Step 2: Create content for each stage
Ensure you craft engaging and valuable content that speaks to your audience at each stage of their journey.
Here is some example content in different stages:
| Awareness | Interest | Desire | Action |
| – Blog posts that provide informative articles. – Social media content to reach a broader audience. – Infographics to present key information visually. – Podcasts discussing industry trends. – Guest articles on popular websites. – Engaging videos to capture attention quickly. | – Landing pages. – Free e-books. – Low-priced courses. – Opt-in pages. – Thank you pages. – Email series to nurture interest. – Newsletters packed with useful insights. – Webinars for interactive learning opportunities. – White papers with in-depth research. | – Testimonials from satisfied customers. – Success case studies highlighting transformations. – Comparison charts outlining advantages over competitors. – Detailed FAQ sections to address common queries. – Product demos to show features in action. | – Clear calls-to-action guiding next steps. – Free trial promotions. – Sign-up discounts. – Limited time offers. – Reminders that the offer will expire soon. – Follow-up content for retargeting customers. You can nudge them with ads, emails, or text messages to come back and finish the checkout process. |
Step 3: Set up automation
With today’s technology, the following actions in your sales process can be automated:
- Create welcome sequences to make new subscribers feel appreciated and informed.
- Implement a nurture series to engage your email list with valuable content.
- Schedule appointments automatically to reduce manual phone calls.
- Send abandoned-cart reminders to recover sales from interested customers.
- Set up post-purchase sequences to enhance customer satisfaction and encourage repeat business.
- Use retargeting ads to bring back potential buyers who have shown interest.
- Automate proposal reminders to keep potential deals moving forward.
- Send appointment reminders to reduce no-shows and ensure timely attendance.
- Integrate direct mail campaigns to add a personal touch to your marketing.
- Use webinar reminders to ensure high attendance and engagement.
- Send thank-you messages with upsell to boost sales.
Many SaaS tools, such as HubSpot and Klaviyo, provide features for creating automated workflows. These tools are designed to integrate smoothly into your existing processes, making automation accessible even if you’re not an IT expert. However, you can still hire a professional to set everything up for you.
Step 4: Set up automated data tracking
Track important metrics to better understand your audience. You can use this data to optimize each stage of your funnel and improve customer experiences.
Here are some examples of data tracking that are useful for your funnel’s success:
Tracking email subscribers
- Why it’s important: Your email list is a direct line to your audience and is unaffected by social media algorithms or platform changes. It allows you to build relationships, turning cold leads into warm ones, which are easier to convert into sales.
- How to set it up: Use email marketing platforms like Mailchimp to automatically track subscribers and gather insights on open rates, click-through rates, and more.
Tracking conversion channels with UTM parameters
- Why it’s important: Knowing which channels bring in conversions helps you focus your marketing efforts where they work best.
- How to set it up: Use UTM parameters in your URLs to track the source of your traffic. Google Analytics can track these for you with detailed reports on which channels are performing well.
Tracking specific data with pixels
- Why it’s important: Pixels help you track specific actions on your website, such as sign-ups, purchases, and cart abandonment. This data will be useful to monitor user actions, segment audiences, and optimize ads.
- How to set it up: Implement pixel codes using tools like Facebook Pixel or Google Tag Manager.
Tools and software for building sales funnels
Having the right tools provides a great foundation for an effective sales funnel and analytics process. Below, we provide some examples and categorize them into three broad categories:
1: Data sources of the analytics process
Any sales funnel is built on understanding your customers and their journeys. This is why you need a solid foundation of data. Key tools to capture customer interactions and insights include:
- CRM systems: Pipedrive, HubSpot CRM, Zoho CRM, Microsoft Dynamics 365, etc.
- Outreach tools: Mailchimp, HubSpot Email Marketing, etc.
- Web analytics tools: Google Analytics, Adobe Analytics, Amplitude, etc.
- Ad platforms: Facebook Ads, Bing Ads, Google Ads, Tiktok Ads, X (Twitter) Ads, LinkedIn Ads, etc.
- Social media: Instagram, YouTube, Facebook, etc.
2: Data automation tools
Data automation tools allow you to collect and transform data from multiple sources into one single destination, like a BI tool, for easy reporting and analysis.
Coupler.io is one such tool. It supports 60+ data sources, allowing you to get data from your CRM, Google Analytics, ad platforms, etc., for visualizing your sales funnels. With Coupler.io, you can easily create custom reports and dashboards from scratch and benefit from ready-to-use templates like the ones above.
Create sales funnel reports with Coupler.io
Get started for free3: BI and data visualization tools
Finally, visualizing and analyzing your sales funnel makes it easier to gain insights.
Spreadsheet apps like Excel and Google Sheets can handle basic tasks.
BI tools such as Looker Studio, Power BI, and Tableau are essential for more complex needs. These tools excel in managing multiple data sources, large datasets, and complex calculations, providing advanced features for deeper analysis and advanced visualizations.
Common sales funnel mistakes to avoid
So far, we’ve covered how to create sales funnels, understand the tools, and see how templates can help. Mistakes can happen and they are sometimes inevitable. However, recognizing them early can make a significant difference. Let’s explore some mistakes that can happen:
Mistake 1: Not paying attention to email deliverability
If your emails do not reach inboxes, your marketing strategy will suffer, and consequently, sales will be affected. Therefore, email deliverability is critical for a successful sales funnel.
Imagine a user can’t reset their password because your email didn’t arrive in their inbox. Or, a new feature launch goes unnoticed because it landed in spam.
How to avoid: Regularly check delivery rates to maintain strong customer engagement and keep your sales funnel effective. These steps can prevent potential conversions from being lost and ensure your message reaches your audience.
Check out this comprehensive guide on email deliverability to improve delivery rates.
Mistake 2: Ignoring analytics and data
Imagine a company launches a new marketing campaign without tracking its performance metrics. Months pass, and they realize sales haven’t improved, but it’s too late to pinpoint what went wrong.
Ignoring analytics can lead to missed opportunities and ineffective strategies, ultimately lowering conversion rates and monthly recurring revenue (MRR).
How to avoid: Regularly review key performance metrics and utilize data analytics tools to track customer interactions. This will help you spot trends and make informed adjustments to your sales strategies.
Mistake 3: Overwhelming prospects with touchpoints and content
It is important to stay in touch with prospects but overwhelming them with excessive touchpoints and content can backfire. Bombarding prospects with too many emails, notifications, or content marketing pieces can lead to disinterest. This can negatively affect open rates, click-through rates, and overall engagement metrics. As a result, conversion rates and customer retention go down.
How to avoid: Strike a balance and provide value without overwhelming your audience. Focus on delivering relevant and valuable content at a pace that maintains interest without causing frustration or withdrawal.
Mistake 4: Not gathering qualitative information from prospects
An e-commerce business experienced high cart abandonment rates but failed to gather qualitative data to uncover the reasons. They overlooked that customers found the checkout process confusing.
Ignoring qualitative insights can lead to decreased customer satisfaction, higher churn rates, and a drop in MRR—as unhappy customers seek better alternatives.
How to avoid: Actively engage with customers using surveys, interviews, and feedback forms. Be attentive to verbal and non-verbal cues during calls, the tone in email responses, and direct feedback. This proactive approach helps identify and address customer pain points, improving satisfaction and retention.
Optimize your sales strategy with Coupler.io’s dashboard templates
Creating an effective sales funnel requires understanding the customer journey and the right tools to succeed. By optimizing each stage of the funnel, you can significantly improve conversion rates and overall sales performance.
While funnel analysis can be complex, Coupler.io simplifies it with powerful funnel templates that provide clear visualizations and display other key metrics for your sales operation. Explore our free sales funnel templates designed to streamline the building and optimization of your sales funnels. Dive in now and significantly enhance your sales strategy with ease!