Sales pipelines and sales funnels are often used interchangeably, but they serve distinct purposes in the sales process. A sales pipeline tracks the stages a salesperson goes through to close a deal, while a sales funnel is about the customer’s journey from awareness to purchase. Therefore, understanding the differences between these two terms is useful for developing effective sales strategies. In this article, we’ll see what sales pipelines and funnels are, highlight their differences, and look at tips on how to optimize each.

Sales funnel vs. sales pipeline: A comparison table
Let’s start by looking at the key differences between a sales funnel and a sales pipeline.
| Sales Funnel | Sales Pipeline | |
| Definition | Tracks the buyer’s journey from awareness to purchase | Tracks the salesperson’s steps from lead to closed deal |
| Focus | Customer’s buying process | Sales activities and stages in the sales process |
| Stages | Awareness, Interest, Evaluation, Engagement, Purchase, and Retention | Prospecting, Qualification, Proposal, Commitment, and Closing |
| Perspective | Customer-centric | Sales team-centric |
| Key metrics | Conversion rates, engagement levels, drop-off points | Number of leads, deal size, close rates, sales cycle length |
| Tools | Marketing automation tools, CRM, analytics software | CRM, sales management software, lead scoring tools |
| Visualization | Often represented as an inverted pyramid or funnel diagram | Often represented as a linear flowchart or list |
What is a sales pipeline?
A sales pipeline describes the steps a salesperson takes to convert a lead into a customer. It is a detailed map of individual deals or prospects moving through the sales process. The pipeline focuses on tracking the status and progress of each potential sale. It helps the sales team members manage and adjust their sales activities to move the deals forward.
Key stages of the sales pipeline
Now, let’s define and outline the activities involved in the sales pipeline stages. To better understand, we’ll use the example of a sales pipeline for a software company selling a project management tool wherever necessary.
1. Prospecting
Prospecting is the process of identifying potential customers (prospects) who may be interested in your product or service. It involves finding and reaching out to these individuals or organizations to start a sales conversation. This stage is critical as it sets the foundation for the entire sales process.
Activities involved:
- Create an Ideal Customer Profile (ICP) by understanding the characteristics of your ideal customers based on industry, company size, location, job title, and pain points. For a software company selling a project management tool, the ICP can be mid-sized tech companies in urban tech hubs, targeting project managers with collaboration and deadline challenges.
- Compile a list of potential prospects using databases, online directories, LinkedIn, industry reports, and other sources. The sales team might use LinkedIn Sales Navigator to find project managers in tech companies fitting their ICP.
Tools used:
- CRM software like Salesforce and HubSpot to track and manage the prospect list and the overall sales pipeline.
- Sales intelligence tools like LinkedIn Sales Navigator, Clearbit, ZoomInfo, or ZoomInfo alternatives to find and gather data on potential prospects.
2. Qualification
With the prospect list in hand, you’ll be tempted to pitch your products/ services to each one. However, before you do that, you need to qualify your prospects first. This involves determining whether the leads generated during the prospecting stage are a good fit for your product or service. By doing this, you’ll ensure that your sales team focuses on leads with the highest potential to convert into paying customers.
Activities involved:
- Gather information about prospects using different lead qualification frameworks, such as BANT, CHAMP, and GPCTBA/C&I. For example, the sales rep uses BANT and asks the project manager about their current project management needs, budget, decision-makers, and purchase timeline.
- Use lead scoring systems to score leads based on their potential value and readiness to buy. Prioritize leads with higher scores for further engagement.
- Next, you can schedule a meeting to discuss their challenges in detail and suggest relevant solutions.
Tools involved:
- Lead scoring tools like Marketo, and LeadSquared for automating lead scoring based on predefined criteria.
- Outreach tools like Outreach.io and Salesloft for effective follow-up and engagement.
- Meeting scheduling tools like Calendly, and Doodle for scheduling follow-up meetings or product demos efficiently.
3. Proposal
In the proposal stage, you present a tailored solution to your qualified lead, addressing their specific needs and challenges. It involves creating a detailed and compelling proposal about how your product or service will benefit the lead, including pricing, terms, and other details. The goal is to demonstrate value and persuade the lead to move forward with the purchase.
Activities involved:
- Conduct thorough discussions to fully understand the lead’s pain points, goals, and requirements.
- Develop a proposal that specifically addresses the lead’s needs and highlights the benefits of your product.
- The proposal document should include an executive summary, a detailed description of the solution, pricing, implementation plan, timeline, terms and conditions, and any relevant case studies or testimonials.
- Arrange a meeting to present the proposal to the lead and any other stakeholders. Walk them through each section of the proposal, emphasizing how it meets their specific needs.
- Be prepared to answer any questions or objections the lead may have about the proposal.
Tools involved:
- Proposal software like PandaDoc, Proposify, or Qwilr for creating, sending, and tracking professional proposals.
- Presentation tools like PowerPoint, and Google Slides for creating engaging presentations to accompany the proposal.
4. Commitment
The commitment stage is where the prospect agrees to move forward with your proposal, leading to a formal agreement or contract. It involves finalizing the details, addressing any last-minute concerns, and securing the prospect’s commitment to purchase. The goal is to convert the prospect into a customer through a signed contract or agreement.
Activities involved:
- Ensure that both parties agree on all terms and conditions, including pricing, implementation schedule, and support.
- Based on the prospect’s feedback, make any final adjustments to the proposal.
- Ensure that the contract meets legal and compliance standards for both parties. Get necessary internal approvals from legal or compliance teams.
- Use digital tools to facilitate quick and easy signing of the contract. Follow up with the prospect to ensure the contract is signed promptly.
Tools involved:
- Document signing tools like DocuSign, and HelloSign for electronic signatures on contracts and agreements.
5. Closing
Finalizing the deal officially makes the prospect a customer. The closing stage includes sealing the deal, handling all closing activities, and transitioning the account to the post-sale phase for ongoing account management. The goal is to ensure a smooth and successful handover from the sales team to the customer success or account management team.
Activities involved:
- Secure the final signatures on the contract and any other necessary documents.
- Send the final invoice to the customer as per the agreed terms. Make sure the payment is processed and confirmed.
- Coordinate with the customer success or account management team to brief them on the customer’s requirements and expectations. Prepare a handover document that includes the customer’s needs, key contacts, and the agreed implementation plan.
- The customer success team develops a detailed onboarding plan and schedules training sessions so that the customer is set up for success with the product.
- Finally, conduct regular meets to check if the customer is satisfied. Gather customer feedback and pass it on to relevant teams internally to improve the product and service.
Tools involved:
- Invoicing tools like QuickBooks and Stripe for handling invoicing and payment processing.
- Project management tools like Asana, and Trello for planning and coordinating the onboarding process and tracking post-sale activities.
- Customer Success platforms like Gainsight, and Totango for managing customer onboarding, tracking customer health, and ensuring ongoing satisfaction.
Key metrics to track a sales pipeline
To understand the effectiveness of a sales pipeline, you must track a few metrics. They help you identify areas for improvement in the sales process and optimize sales strategies to boost conversion rates, shorten sales cycles, and increase revenue.
Let’s look at the key sales pipeline metrics and how they can help you.
- Lead Conversion Rate: Measures the percentage of leads that progress through the pipeline and convert into paying customers. It shows how well your sales process works and helps you find stages where leads drop off, so you can make improvements.
- Sales Cycle Length: Tracks the average time it takes to move a lead from initial contact to a closed deal. By understanding the duration of your sales process, you can identify and shorten lengthy stages, speeding up your sales process.
- Deal Size (Average Deal Value): Calculates the average revenue generated per closed deal. This metric lets you make strategic decisions by forecasting revenue and targeting higher-value deals to maximize profitability.
- Win Rate: Shows the percentage of deals closed successfully out of the total deals in the pipeline. A high win rate reflects effective sales techniques, while a low win rate highlights areas for improvement in the sales process.
- Lead Response Time: Measures the average time taken to respond to new leads. Faster response times improve lead engagement and increase conversion chances.
- Activity Volume: Tracks the total number of sales activities (calls, emails, meetings) performed by the sales team. High activity volume indicates a proactive sales approach, while low activity may highlight the need for increased sales efforts.
- Lost Deals: This metric counts the number or percentage of deals that were not successfully closed. By identifying common reasons for deal losses, this metric helps identify potential weaknesses in the sales process.
How to optimize a sales pipeline?
Now that you know the different metrics to track, let’s see how you can use these metrics and other strategies to optimize your sales pipeline for maximum efficiency, complete with examples.
1. Define Clear Stages in Your Sales Pipeline: Clearly defining each stage of the pipeline helps track progress and identify bottlenecks. For instance, a software company might define stages such as Lead Generation, Lead Qualification, Proposal, Commitment, and Closing.
Example: By tracking the Sales Cycle Length, a company realizes that the Proposal stage takes too long. They streamline this stage by standardizing proposal templates reducing cycle time.
2. Leverage CRM Tools: Utilize CRM tools like Salesforce or HubSpot to manage and analyze your sales pipeline. CRM tools help track Activity Volume, Lead Response Time, and Win Rate, providing insights that can streamline processes and enhance decision-making.
Example: A company uses HubSpot CRM to track and visualize its sales activities. It notices that Activity Volume is low on follow-up calls, prompting it to set automated reminders for the sales team, which results in an increase in follow-up calls.
3. Focus on Lead Qualification: Prioritize high-quality leads to make sure your sales team spends time on the most promising prospects. Use the Lead Conversion Rate to identify the effectiveness of your qualification process and make adjustments to improve lead quality.
Example: By analyzing Lead Conversion Rate, a company discovers that leads from webinars convert at a higher rate than those from social media ads. They shift more resources to webinars, increasing overall conversion rates.
4. Improve Communication and Follow-Ups: Consistent and timely follow-ups are crucial. Use Lead Response Time to ensure quick engagement with new leads and Activity Volume to track the number of follow-up interactions, ensuring no leads fall through the cracks.
Example: A company notices its Lead Response Time is over 24 hours. It implements an auto-response system to acknowledge inquiries immediately and sets a goal for the sales team to respond within 4 hours, reducing response time and increasing lead satisfaction.
5. Utilize A/B Testing to Refine the Sales Pipeline: Experiment with different sales approaches and strategies to see what works best. A/B testing can refine the stages of your sales pipeline, optimize communication strategies, and improve your Win Rate by identifying the most effective methods.
Example: A software company tests two different email follow-up sequences. Sequence A focuses on product features, while Sequence B focuses on customer success stories. They find that Sequence B increases their Win Rate, leading them to adopt it as their standard approach.
6. Implement Automation Where Possible: Automate repetitive tasks like follow-up emails, lead scoring, and data entry to free up your sales team for more strategic activities. Sales automation helps maintain high Activity Volume and quick Lead Response Time.
Example: Using automation tools, a company sets up automated email sequences for nurturing leads and automatic lead scoring based on interactions. This reduces manual work and ensures consistent engagement, leading to an increase in Activity Volume.
When should you use a sales pipeline?
A sales pipeline should be used when you need to manage and optimize your sales process effectively. Tracking the progress of leads through various stages is especially useful, as it makes sure that no opportunities are missed and that each one is handled perfectly.
You should also use a sales pipeline when you need accurate sales forecasting and planning, as it provides a clear view of potential revenue. It is useful for identifying bottlenecks in the sales process, prioritizing leads, measuring performance metrics, and improving team communication. Additionally, use a sales pipeline to allocate resources effectively so that your sales team focuses on the most promising opportunities.
Visualize your sales pipeline with CRM Dashboards
We’ve discussed important metrics and how to use them to optimize your sales pipeline in the previous sections. However, understanding raw data can be tough. So, by using a CRM dashboard, you can enable sales reporting and visualize all the metrics stored in your CRM tool.
If you lack the expertise and time to create a dashboard from scratch, Coupler.io dashboard templates are for you. With these, you can make a CRM Dashboard with your own data. Here, we are presenting you the dashboards for the most commonly used CRM platforms.
CRM dashboard for HubSpot
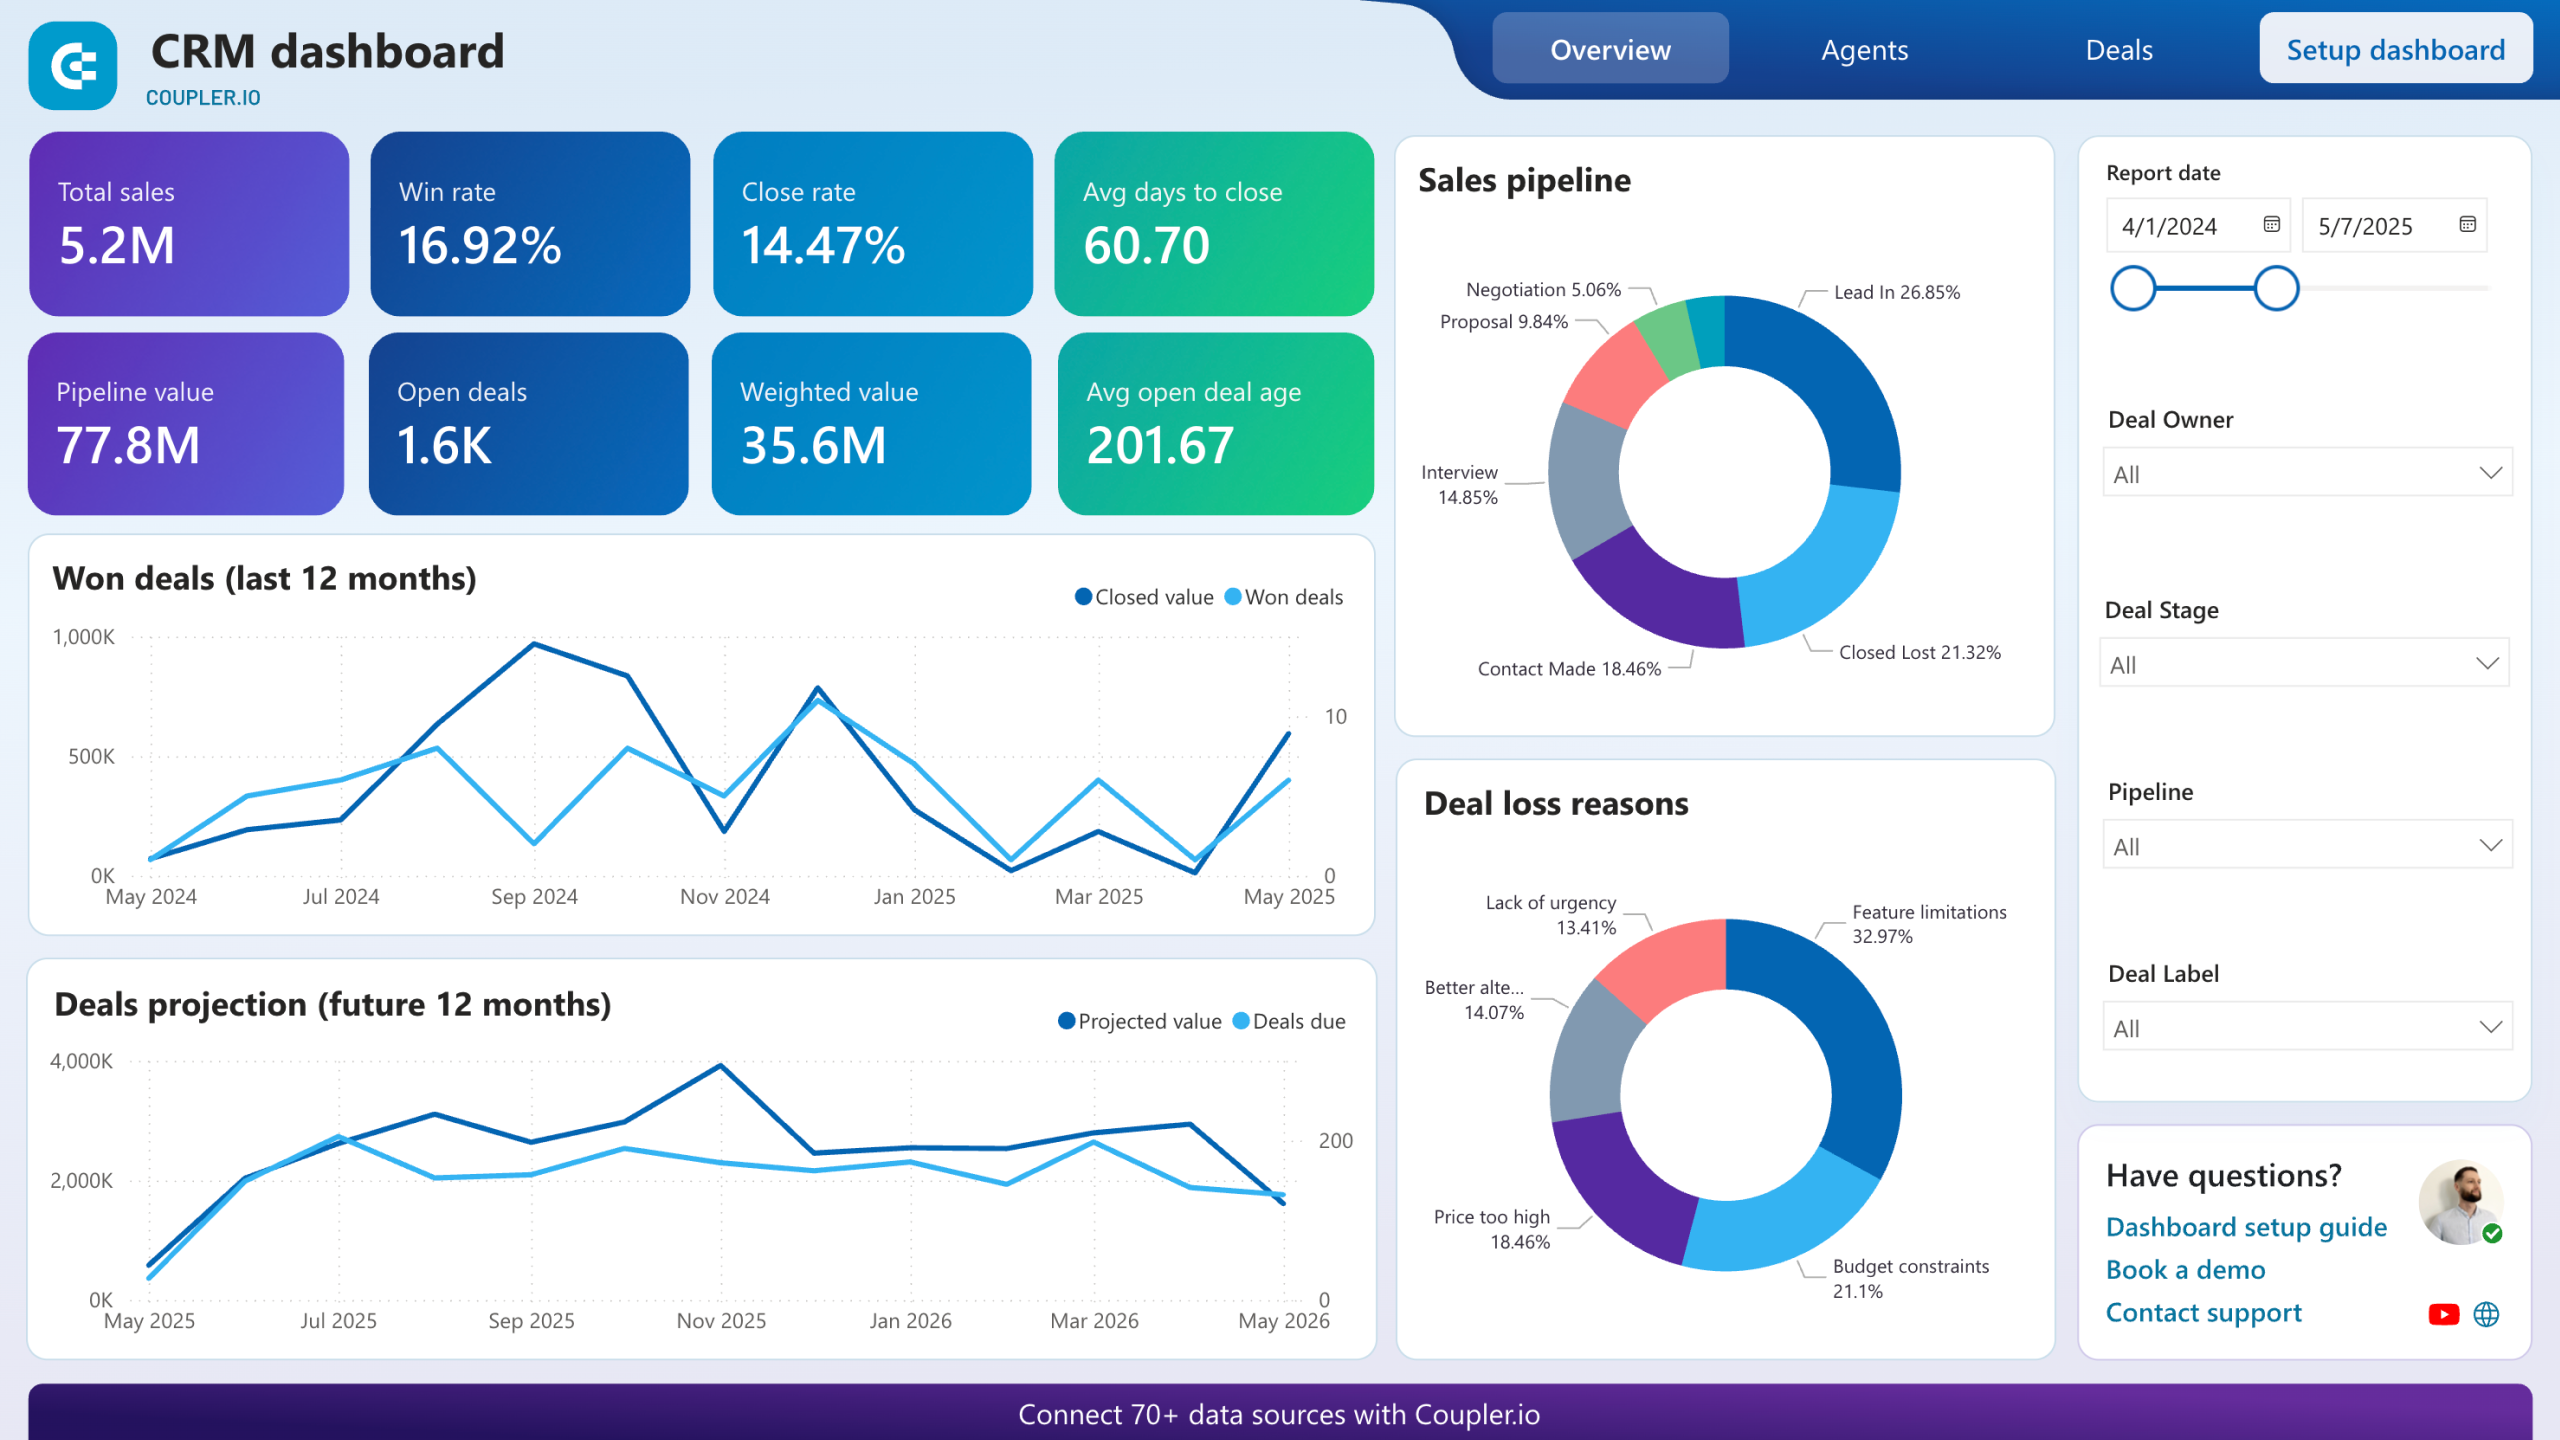
The HubSpot CRM dashboard provides a clear overview of the sales pipeline, highlighting overall performance, sales trends, and individual agent performance. By visualizing deal progress and identifying bottlenecks, you can address issues and improve efficiency.

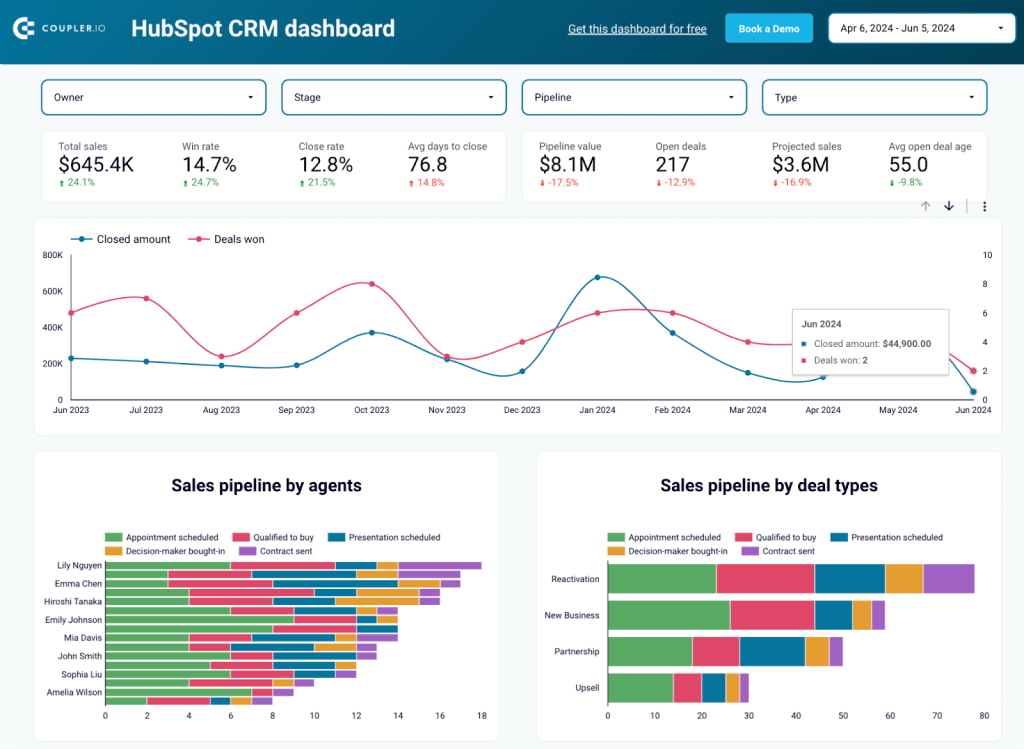
The dashboard also shows which lead sources and deal types are most profitable, helping you focus your efforts. Additionally, understanding the reasons for won and lost deals allows you to refine your sales strategies. Using these insights, you can make data-driven decisions to optimize your sales pipeline and boost revenue.
To get this dashboard, click on the Readme Tab and follow the instructions.
CRM dashboard for Salesforce
Similar to the HubSpot dashboard, the Salesforce CRM dashboard also focuses on key metrics like total sales, win rates, and revenue by lead source. By visualizing sales trends over time and comparing agent performance, you can identify successful strategies and areas needing improvement.

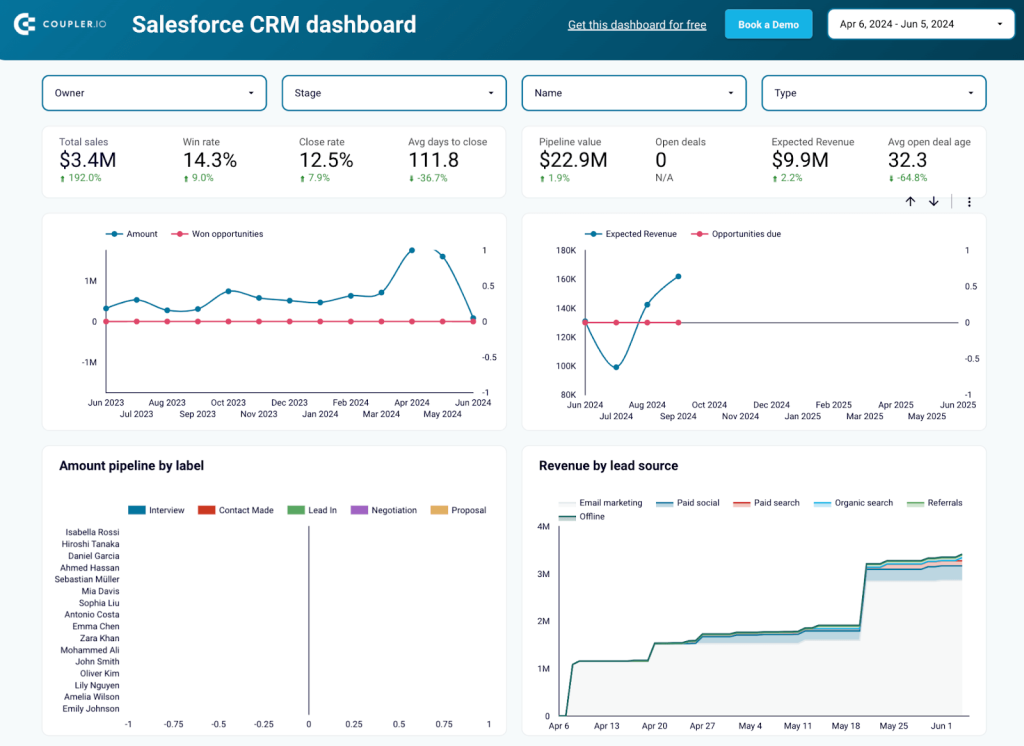
The dashboard also breaks down deals by stages to spot bottlenecks and gives valuable insights into top industries and geographic trends. Using these insights, you can optimize your sales pipeline, allocate resources effectively, and boost overall sales performance.
To make this dashboard with your own real-time data, follow the instructions in the Readme tab.
CRM dashboard for Pipedrive
The Pipedrive CRM dashboard clearly shows your sales pipeline with key metrics like total sales, win rates, and average closing time. You can visualize sales trends and forecast future performance to plan and allocate resources more effectively.

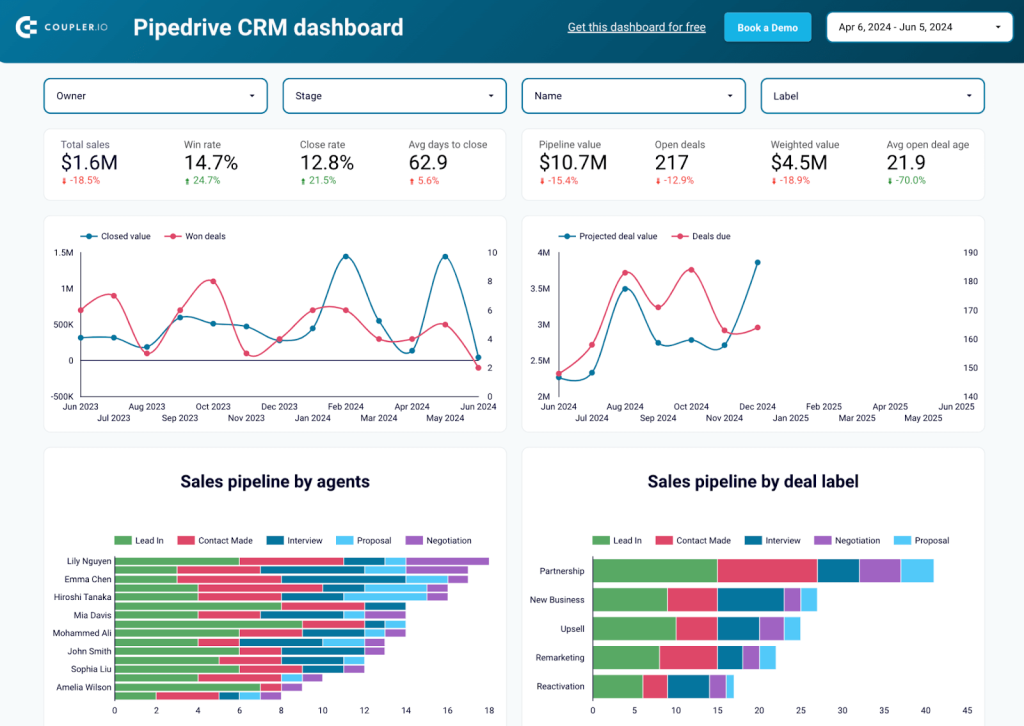
The dashboard highlights the performance of individual agents and the progress of different deal types to identify both top performers and areas needing improvement. Additionally, it shows where deals are stalling and provides reasons for lost deals, allowing you to refine strategies and improve overall sales effectiveness.
This Pipedrive CRM dashboard is available as a template in Looker Studio and Power BI, both equipped with the Pipedrive connector by Coupler.io. Go to the Readme tab and follow the instructions to set up the version you like most.

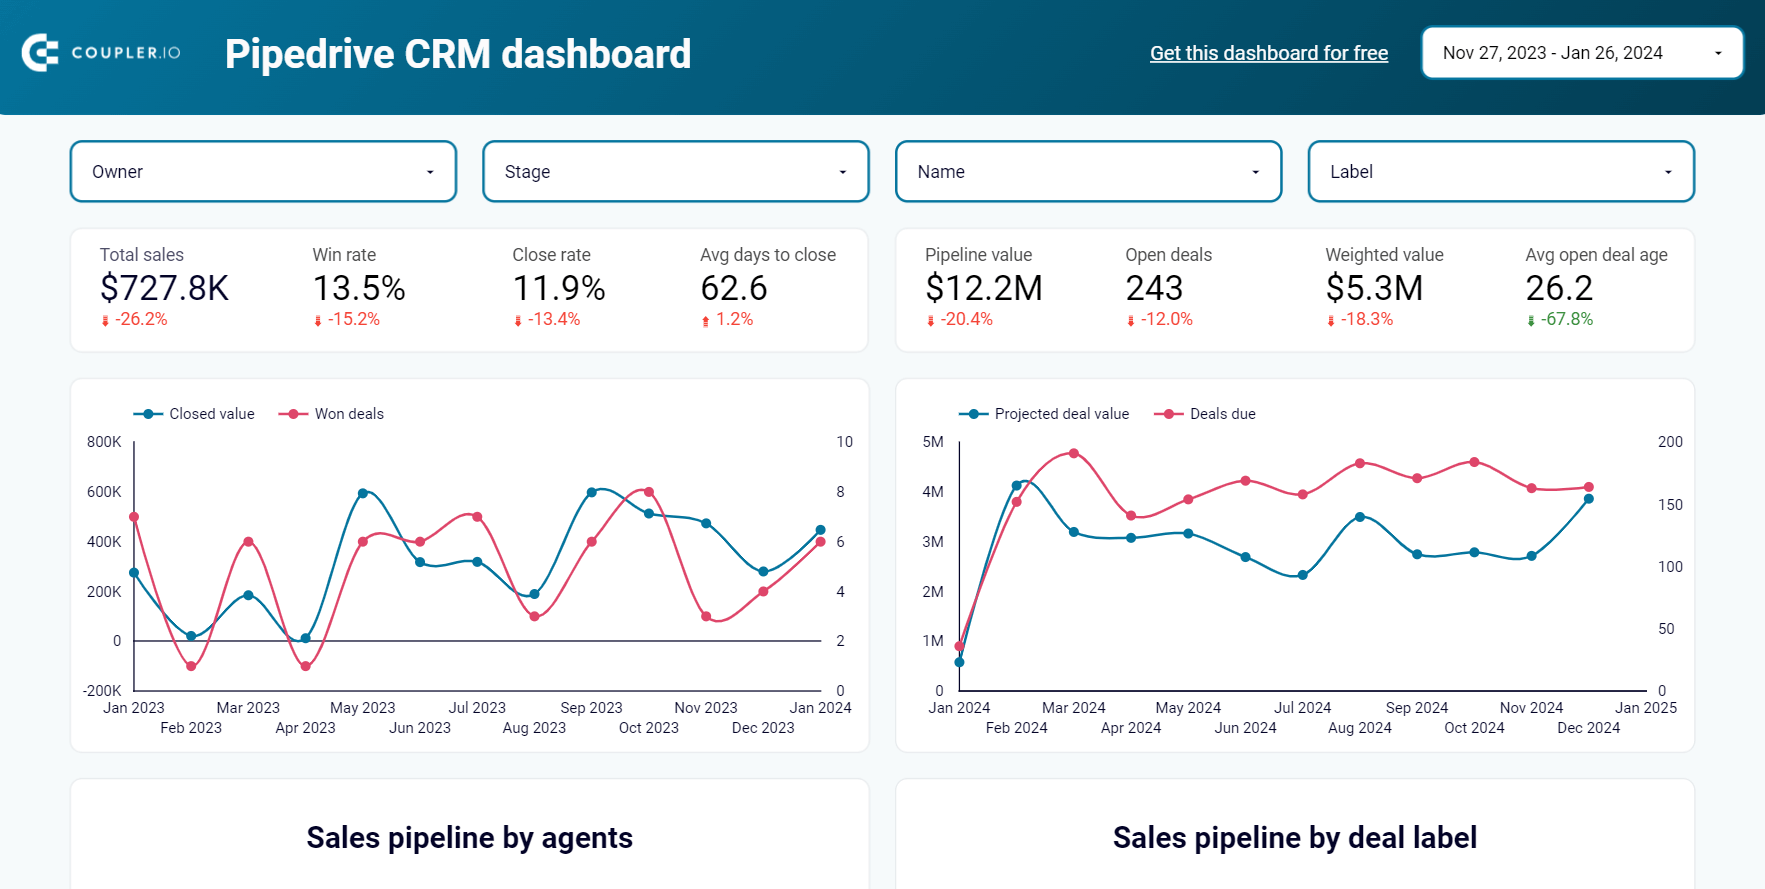
CRM dashboard for Pipedrive in Looker Studio
Stay on top of your Pipedrive sales using our CRM dashboard which allows you to analyze your sales department’s performance.


CRM dashboard for Pipedrive in Power BI
Track sales opportunities, monitor deal stages, and evaluate team performance with interactive visualizations that help identify bottlenecks and optimize your sales process.

What is a sales funnel?
A sales funnel represents the journey of potential customers from the top (awareness) to the bottom (purchase and retention). It shows the number of prospects at each stage and helps identify where you might lose potential customers. The funnel shape shows how the number of potential customers gets smaller at each stage. The most interested prospects move towards the bottom of the funnel, and the team can easily focus on those most likely to buy.
Key stages of the sales funnel
In this section, we’ll explain in detail the different stages of a sales funnel, the activities involved, and the tools used in each stage. In some instances, we’ll also use examples to help you understand the sales funnel stages better.
1. Awareness
Awareness is the first stage in a sales funnel where you make potential customers aware of your products or services. You capture the attention of a broad audience and introduce them to your brand. You can use different activities to create visibility and spark initial interest.
Activities involved:
- Creating and distributing valuable content such as blog posts, articles, videos, infographics, and ebooks to educate and engage your target audience.
- Using social media platforms to share content, engage with followers, and run paid advertisements to reach a wider audience.
- Optimizing your website and content to rank higher in search engine results, makes it easier for potential customers to find you.
- Running pay-per-click (PPC) campaigns, display ads, and sponsored content to drive traffic to your website.
- Sending out newsletters and promotional emails to a targeted list of potential customers.
- Gaining media coverage and getting featured in industry publications to increase brand visibility.
Tools used:
- WordPress and Medium for blogging, and YouTube or Vimeo for video content.
- Engage with audiences on social media platforms like Facebook, Twitter, LinkedIn, Instagram, and TikTok.
- Run paid ads through Google Ads, Facebook Ads, and LinkedIn Ads.
- Optimize your content with SEO tools like Ahrefs, SEMrush, and Google Search Console.
- Distribute press releases using PRWeb and Cision.
- Send emails via Mailchimp, Constant Contact, or Sendinblue.
2. Interest
The next stage is the Interest stage where you engage potential customers who have shown awareness of your product or service. You aim to deepen their interest and move them closer to the evaluation stage by providing valuable and engaging content.
Activities involved:
- Offering lead magnets like ebooks, whitepapers, checklists, templates, and more in exchange for contact information.
- Sending targeted email campaigns to nurture leads and keep them engaged with your brand. This can include newsletters, drip campaigns, and personalized content.
- Hosting live or recorded webinars to provide in-depth information about your product, share industry insights, and answer potential customer questions.
- Engaging leads with interactive content such as quizzes, surveys, calculators, and assessments.
Tools used:
- Landing page builders like Unbounce or Leadpages.
- Email marketing platforms like Mailchimp, HubSpot, and ActiveCampaign
- Webinar platforms like Zoom, GoToWebinar, and WebEx.
- Interactive content tools like Interact, Outgrow, and SurveyMonkey.
- Content creation tools like Canva, Adobe Spark, and testimonial platforms like Trustpilot.
3. Evaluation
Evaluation is the third stage where prospects actively compare different solutions and offers to find the best one for them. The goal is to provide compelling reasons and clear evidence to convince prospects to choose your offering.
Activities involved:
- Sharing detailed success stories that highlight how your product or service has helped other customers achieve their goals.
- Conducting live or recorded demonstrations of your product to show its features and benefits in action.
- Creating detailed comparison charts and articles that compare your product with competitors, highlighting the unique advantages and differentiators.
- Offering prospects to try your product or service for a limited time to experience the value firsthand.
Tools used:
- Content creation tools like Canva, Lucidchart and Adobe Spark.
- Review platforms like Trustpilot and G2.
- Document creation tools like Microsoft Word and Google Docs.
4. Purchase
Purchase is a critical stage in the sales funnel where prospects decide to buy and complete their transaction. It involves finalizing the sale, ensuring a smooth transaction, and turning the prospect into a paying customer. The objective here is to close the deal and establish the groundwork for a positive ongoing customer relationship.
Activities involved:
- Completing all necessary paperwork, contracts, and agreements. This step includes confirming the terms of the sale, payment details, and delivery or implementation schedules.
- Handling payment transactions securely and efficiently. This includes invoicing, processing payments, and confirming receipt of payment.
- Ensuring the product or service is delivered to the customer as promised. For physical products, this involves shipping and tracking. When selling digital products or services, this includes providing access or starting the implementation process.
- Introducing the customer to your product or service, providing necessary training, and ensuring they are comfortable using it. This step is crucial for setting the stage for long-term satisfaction and retention.
Tools used:
- Electronic signature tools like DocuSign or HelloSign for signing contracts.
- CRM systems like Salesforce or HubSpot for managing customer information.
- Payment processing platforms like Stripe or PayPal.
- Invoicing software like QuickBooks or Refrens.
- Order management systems like ShipStation for physical products or digital delivery platforms like SendOwl for digital goods.
5. Retention
Retention focuses on keeping customers satisfied and engaged after their initial purchase. The goal is to build long-term relationships, encourage repeat business, and turn customers into loyal advocates for your brand. This stage is crucial for maximizing the lifetime value of your customers and sustained business growth.
Activities involved:
- Providing excellent customer service to address any issues or questions promptly and effectively. Offer multiple support channels such as phone, email, live chat, and self-service resources.
- Proactively engaging with customers to achieve their desired outcomes with your product or service. This includes regular check-ins, personalized recommendations, and success plans.
- Offering ongoing training and educational resources to help customers fully utilize your product or service.
- Implementing loyalty programs like discounts, special offers, and exclusive access to new features that reward repeat purchases and long-term commitment.
- Regularly collecting customer feedback to understand their needs and improve your product or service.
Tools used:
- Customer support software like Zendesk, Freshdesk, and live chat tools like Intercom.
- Customer success platforms like Gainsight, Totango, and ChurnZero.
- Learning management systems (LMS) like Moodle, and TalentLMS.
- Feedback platforms like UserVoice.
Key metrics to track a sales funnel
Let’s check some of the important sales funnel metrics and how they can help to understand the effectiveness of your funnel.
- Impressions: Measure the visibility of your content or ads. This shows how often your brand is seen by potential customers. Naturally, high impressions means good visibility which in turn means you are doing everything right in terms of ad placements and brand awareness campaigns.
- Reach: Tracks the total number of unique users who see your content or ads. It helps to determine the size of your audience and the success of your efforts in broadening market reach.
- CTR (Click-Through Rate): Measures the percentage of users who click on your content or ads. This indicates how compelling your content or ads are and helps to optimize creatives and call-to-action elements to drive more traffic.
- Engagement Rate: Tracks the percentage of users who interact with your content through likes, comments, shares, etc. This reflects the level of audience interaction and interest.
- Bounce Rate: Measures the percentage of visitors who leave your website after viewing only one page. High bounce rates may indicate issues with landing page relevance or user experience, prompting improvements in content, design, or targeting.
- Session Duration: Tracks the average time users spend on your website during a single visit. Longer session durations suggest engaging content and a positive user experience.
- Conversion Rate: Measures the percentage of visitors who complete a desired action, such as filling out a form or making a purchase. This shows the effectiveness of your sales funnel in converting leads. It also helps you identify areas for improvement in the user journey.
- Cost per Acquisition (CPA): Calculates the average cost of acquiring a new customer. It guides budget allocation and optimization of campaigns to reduce acquisition costs.
- Close Rate: Tracks the percentage of leads that convert into paying customers and can be a performance metric for the sales team in closing deals. It helps identify training needs and optimize sales strategies.
- Customer Lifetime Value (CLV): Estimates the total revenue a business can expect from a single customer over their entire relationship. It guides marketing investments and customer retention strategies by focusing on long-term customer value rather than short-term gains.
How to optimize a sales funnel?
A sales funnel is never perfect. Tracking and refining it based on trends and metrics is a continuous process. Let’s look at a few ways to optimize your sales funnel.
1. Identify and Understand Your Target Audience: Define your Ideal Customer Profile (ICP) and segment your audience with tools like SurveyMonkey and Segment. Metrics like Reach and Engagement Rate help you adjust your targeting.
Example: A software company identified project managers in mid-sized tech firms as their ICP. By focusing their marketing efforts on this segment, they saw increased engagement and higher-quality leads entering the funnel.
2. Attract the Right Leads: Use content marketing, SEO, advertising, and outbound activities with tools like WordPress, Ahrefs, Google Ads, and LinkedIn Sales Navigator. Impressions and CTR show the impact of your marketing efforts.
Example: By optimizing blog content for SEO and running targeted Google Ads, a company attracted more relevant traffic. This resulted in a significant increase in lead quality and conversions.
3. Improve Lead Qualification: Implement lead scoring and automate the process using CRM systems like HubSpot and LeadSquared. Metrics like Conversion Rate and Close Rate measure the effectiveness of lead qualification.
Example: After implementing lead scoring, a company found that their sales team could focus more on high-potential leads. This increased their conversion rate as sales reps engaged more effectively with qualified prospects.
4. Enhance Lead Nurturing: Develop personalized email campaigns and follow-up strategies with tools like Mailchimp and Canva. Engagement Rate and Session Duration provide insights into nurturing effectiveness.
Example: TA company enhanced its lead nurturing with personalized email campaigns. As a result, they saw longer session durations on their website and higher engagement rates, leading to more conversions.
5. Optimize Each Stage of the Funnel: Regularly review and refine each stage using Funnelytics and CRM systems. Bounce Rate and Conversion Rate help identify stages where leads drop off.
Example: By analyzing their funnel, a company discovered a high drop-off rate during the demo scheduling stage. They streamlined the scheduling process, which significantly reduced bounce rates and improved conversions.
6. Analyze and Optimize Performance: Track key metrics, conduct A/B testing, and establish a feedback loop with tools like Google Analytics, Optimizely, and other sales analytics software. CTR, Conversion Rate, and CPA provide actionable data.
Example: A company used A/B testing to compare different landing page designs. The test results helped them choose the most effective design, leading to a notable increase in their conversion rate.
7. Align Sales and Marketing Teams: Foster regular communication and set joint goals using Slack and Trello. Close Rate and Customer Lifetime Value (CLV) show the success of aligned efforts.
Example: A company conducted weekly alignment meetings between sales and marketing teams. They saw an improvement in collaboration which resulted in more consistent messaging and a higher close rate.
When should you use a sales funnel?
A sales funnel should be used when you want to systematically guide potential customers through the buying process. It is particularly useful for understanding and optimizing how prospects move from initial awareness to making a purchase.
Sales funnels are essential when launching new products, running marketing campaigns, or improving sales strategies. By using a sales funnel, you can identify bottlenecks, improve lead nurturing, and ultimately increase conversion rates. It helps to make informed decisions based on data while making sure that your marketing and sales efforts are up to the mark.
Dashboards to visualize your sales funnel
We have seen how different metrics can be used to optimize a sales funnel. However, understanding raw data can be challenging. Sales funnel metrics are stored in various tools. For instance, awareness stage data is on websites and social media platforms, interest stage data is in marketing analytics platforms, and evaluation, and purchase stage data is in CRM platforms. This means you need different dashboards to visualize data from each stage effectively.
<!– wp:heading {“level”:3} –>
<h3 class=”wp-block-heading”>When should you use a sales pipeline?</h3>
<!– /wp:heading –>
<!– wp:paragraph –>
<p>A sales pipeline should be used when you need to manage and optimize your sales process effectively. Tracking the progress of leads through various stages is especially useful, as it makes sure that no opportunities are missed and that each one is handled perfectly. </p>
<!– /wp:paragraph –>
<!– wp:paragraph –>
<p>You should also use a sales pipeline when you need accurate sales forecasting and planning, as it provides a clear view of potential revenue. It is useful for identifying bottlenecks in the sales process, prioritizing leads, measuring performance metrics, and improving team communication. Additionally, use a sales pipeline to allocate resources effectively so that your sales team focuses on the most promising opportunities.</p>
<!– /wp:paragraph –>
Take a look at these examples of sales funnel templates.
To simplify this, we have curated the most commonly used and needed dashboards. These marketing dashboard templates from Coupler.io will help you easily set up your own dashboards with your data, turning extensive data into actionable insights.
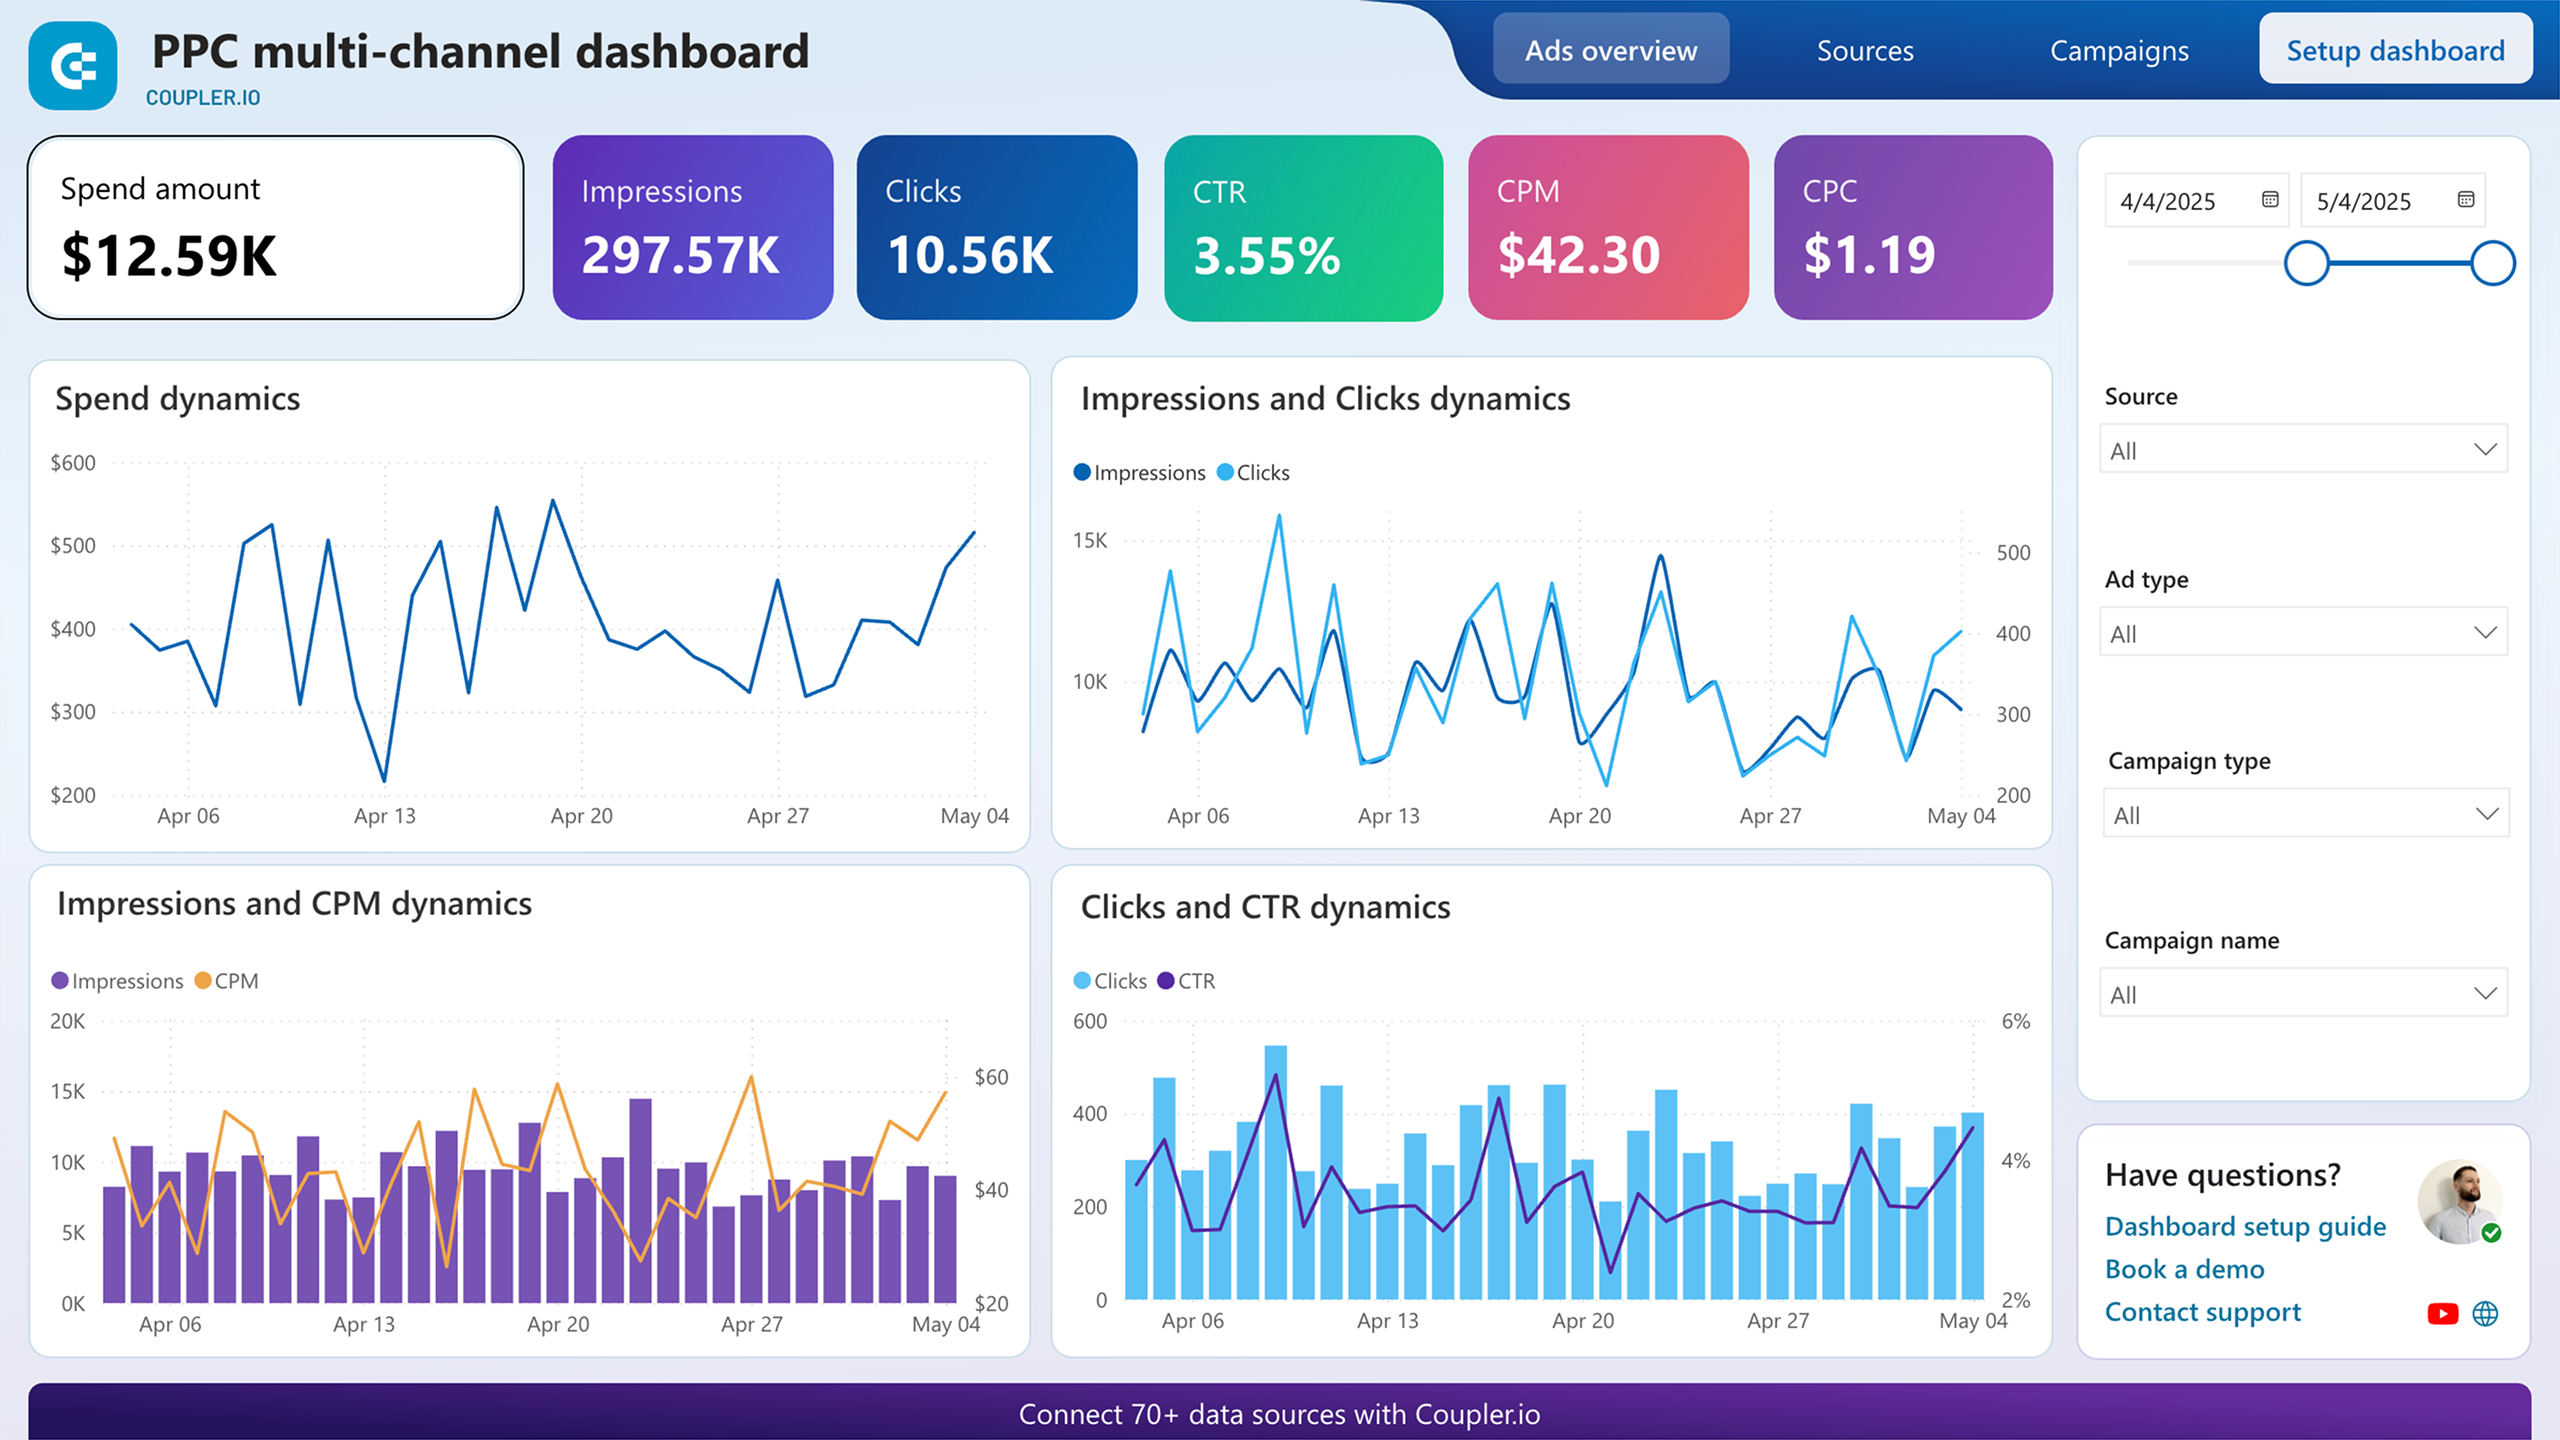
PPC multi-channel dashboard
The PPC multi-channel dashboard provides a detailed view of the advertising performance across various platforms (Facebook Ads, Google Ads, LinkedIn Ads, Twitter Ads, and more). It shows key metrics like spending, impressions, clicks, CTR, and CPC, helping you identify which campaigns deliver the best ROI.

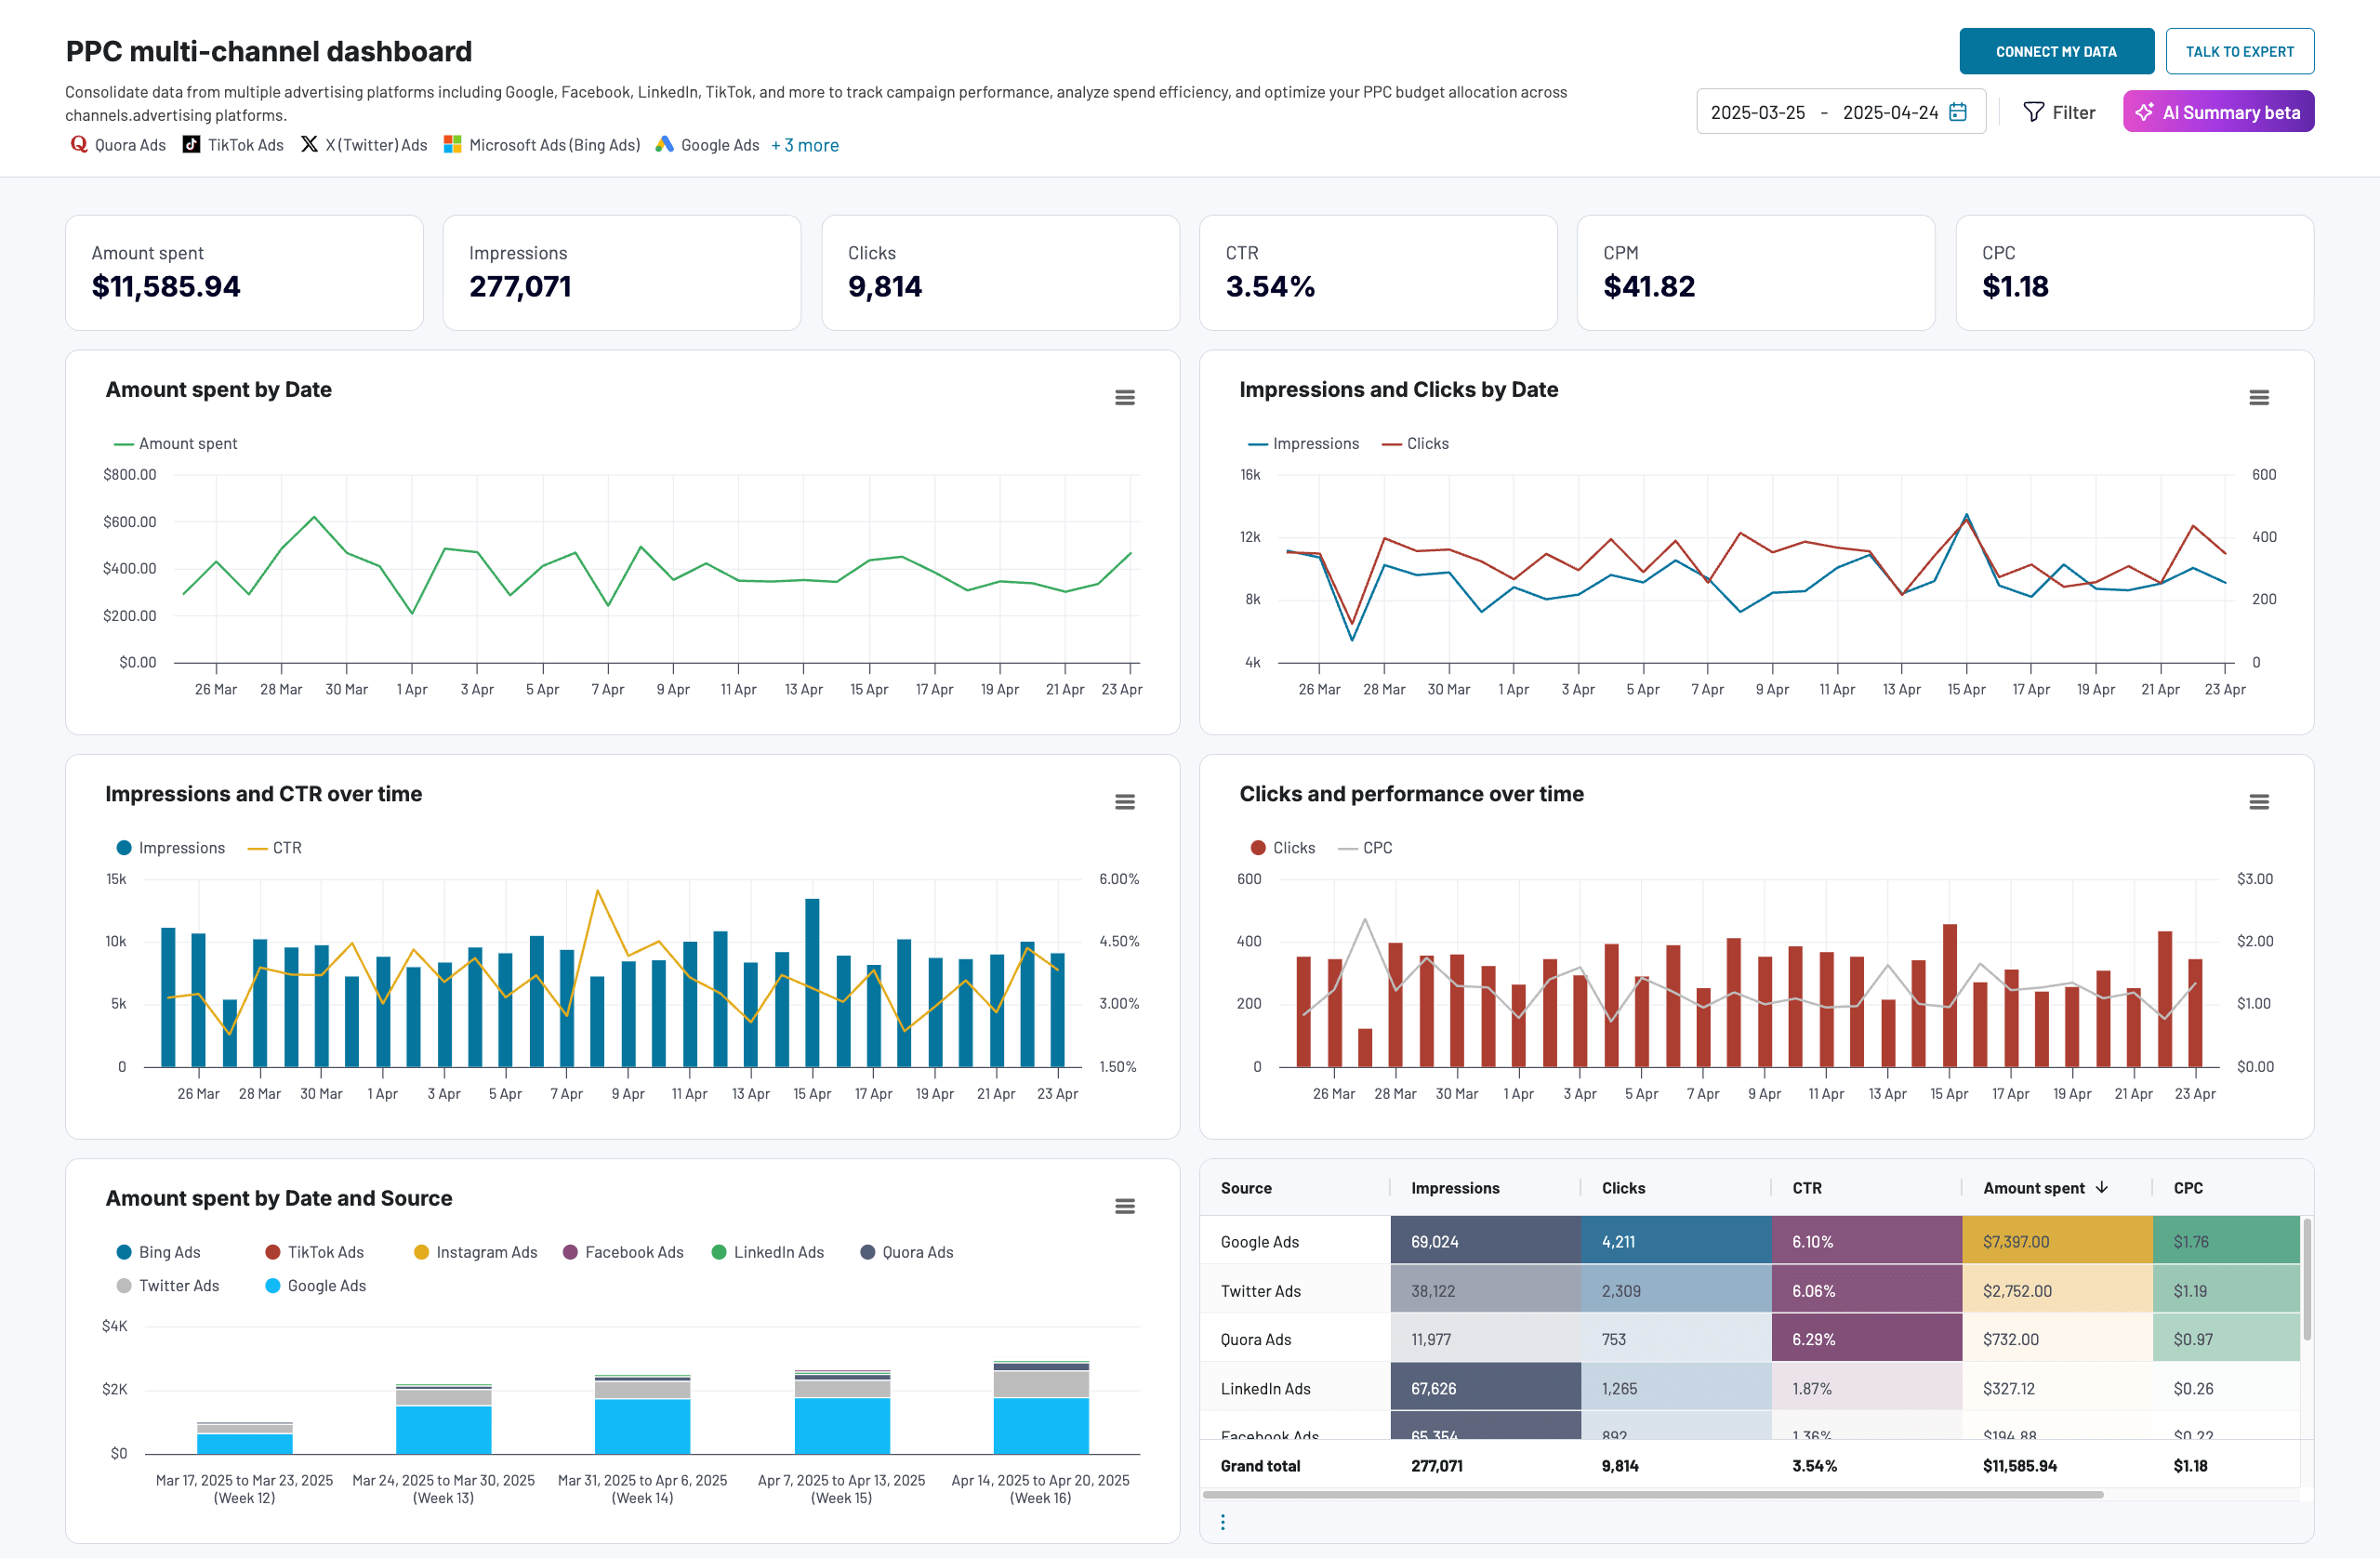
By comparing the performance of different sources and campaign types, you can focus on the most effective channels and optimize your budget allocation. By breaking down each campaign in detail, you can conduct in-depth analysis and improve your advertising efforts.
By the way, although this PPC report is called multi-channel, you can actually use it for a single channel. At the same time, Coupler.io designed this template for different destinations, including Google Sheets, Looker Studio, Power BI, and Tableau.


PPC multichannel dashboard in Google Sheets
Use a PPC dashboard designed for Google Sheets to track the performance of your campaigns across multiple advertising platforms.


PPC multichannel dashboard in Looker Studio
Get a comprehensive PPC reporting tool to track the performance of your campaigns launched at multiple advertising platforms.
PPC multichannel dashboard in Power BI
Use a Power BI PPC dashboard for tracking and analyzing your advertising campaigns across multiple platforms.


PPC multichannel dashboard in Tableau
Track and analyze the performance of your advertising campaigns across various platforms using a one-stop PPC dashboard in Tableau
Web analytics dashboard
The web analytics dashboard uses Google Analytics data to present your website’s performance and user behavior. It shows metrics like total users, new users, sessions, and conversions, giving an overview of activity and engagement. Daily and monthly traffic trends help you identify peak times and long-term patterns.

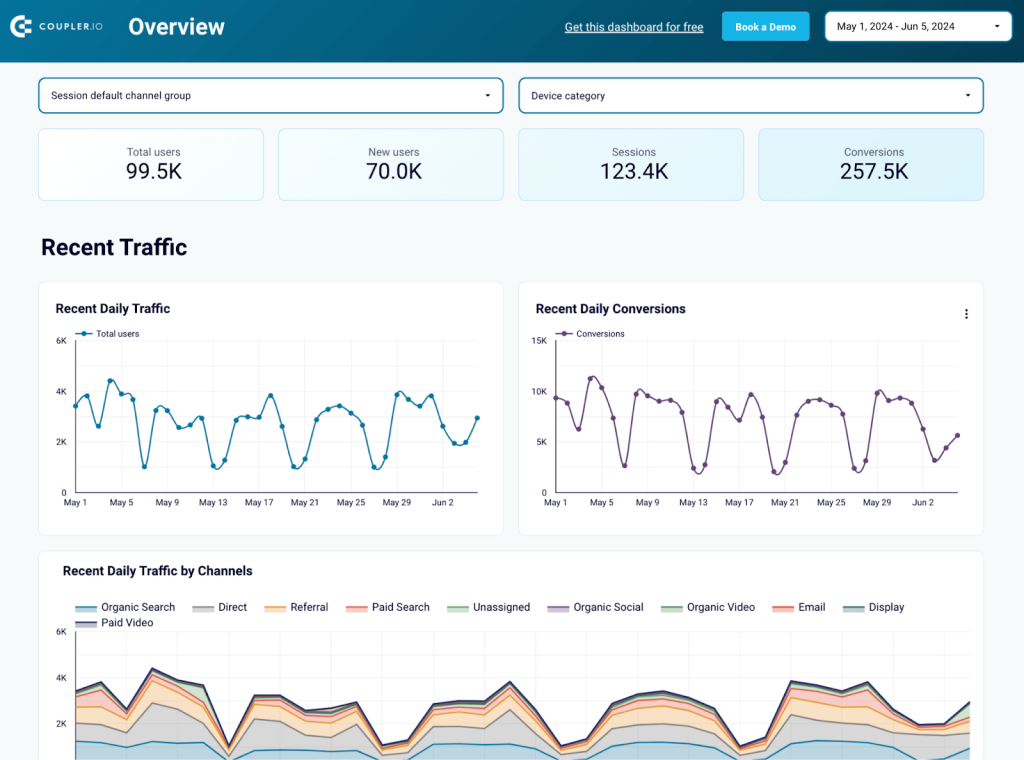
Google Analytics tracks user data from different channels. By breaking down traffic by channels, you can see which sources drive the most visits and optimize your marketing strategies accordingly. These insights help you make data-driven decisions to improve user engagement and boost conversions.
To get this dashboard, click on the Readme Tab and follow the instructions.
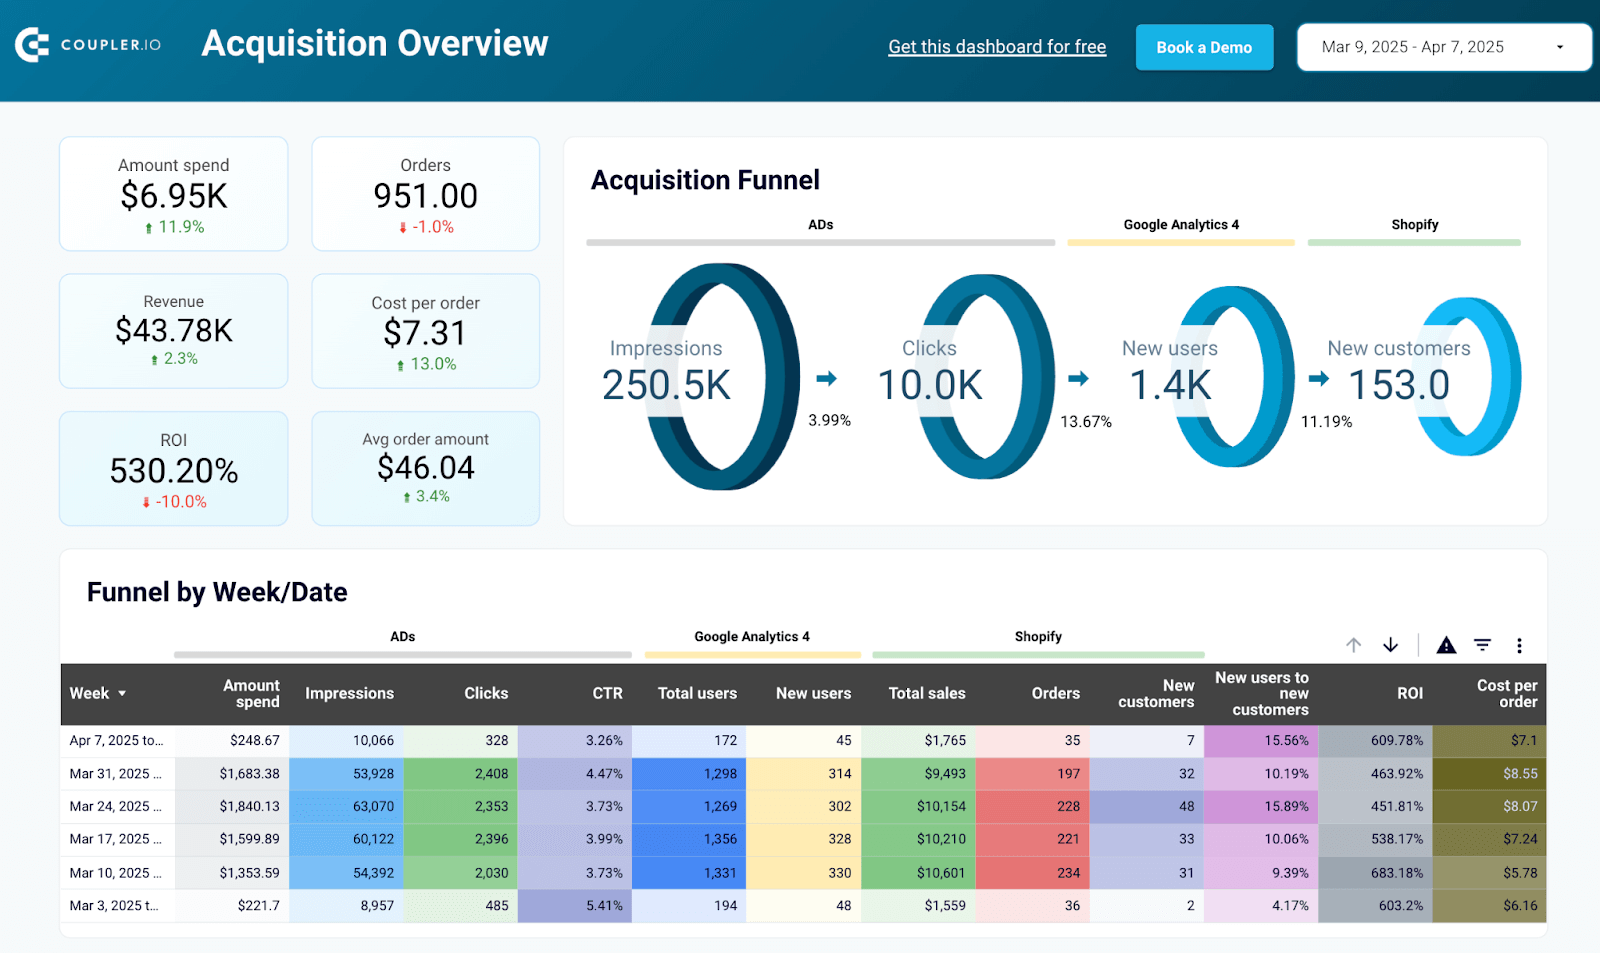
Shopify marketing funnel dashboard
If you sell your products or services through Shopify, then this dashboard can be a one-stop destination to get a quick glance of your funnel performance. The Shopify marketing funnel dashboard gives a clear view of your customer acquisition and conversion processes. It shows metrics like spend, orders, and revenue, helping you track cost-effectiveness and identify areas for improvement.

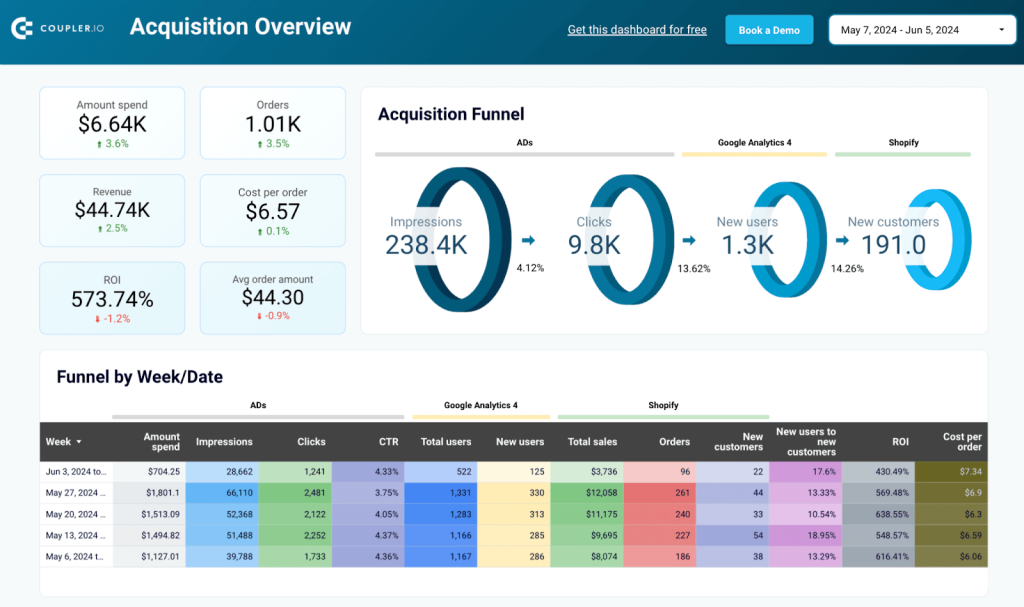
By understanding conversion rates at each stage of the sales funnel report, you can pinpoint where potential customers drop off and make necessary adjustments. Monitoring trends in impressions, clicks, and costs allows for better budget management and more precise marketing strategies. This helps refine your efforts, leading to higher engagement and increased conversions.
To get this Shopify marketing funnel dashboard, go to the Readme tab and follow the instructions. It’s available as a template in Looker Studio and Power BI

Shopify marketing funnel dashboard in Looker Studio
Analyze the performance of the traffic to your Shopify store using data from advertising platforms and Google Analytics 4, all consolidated on a single dashboard.

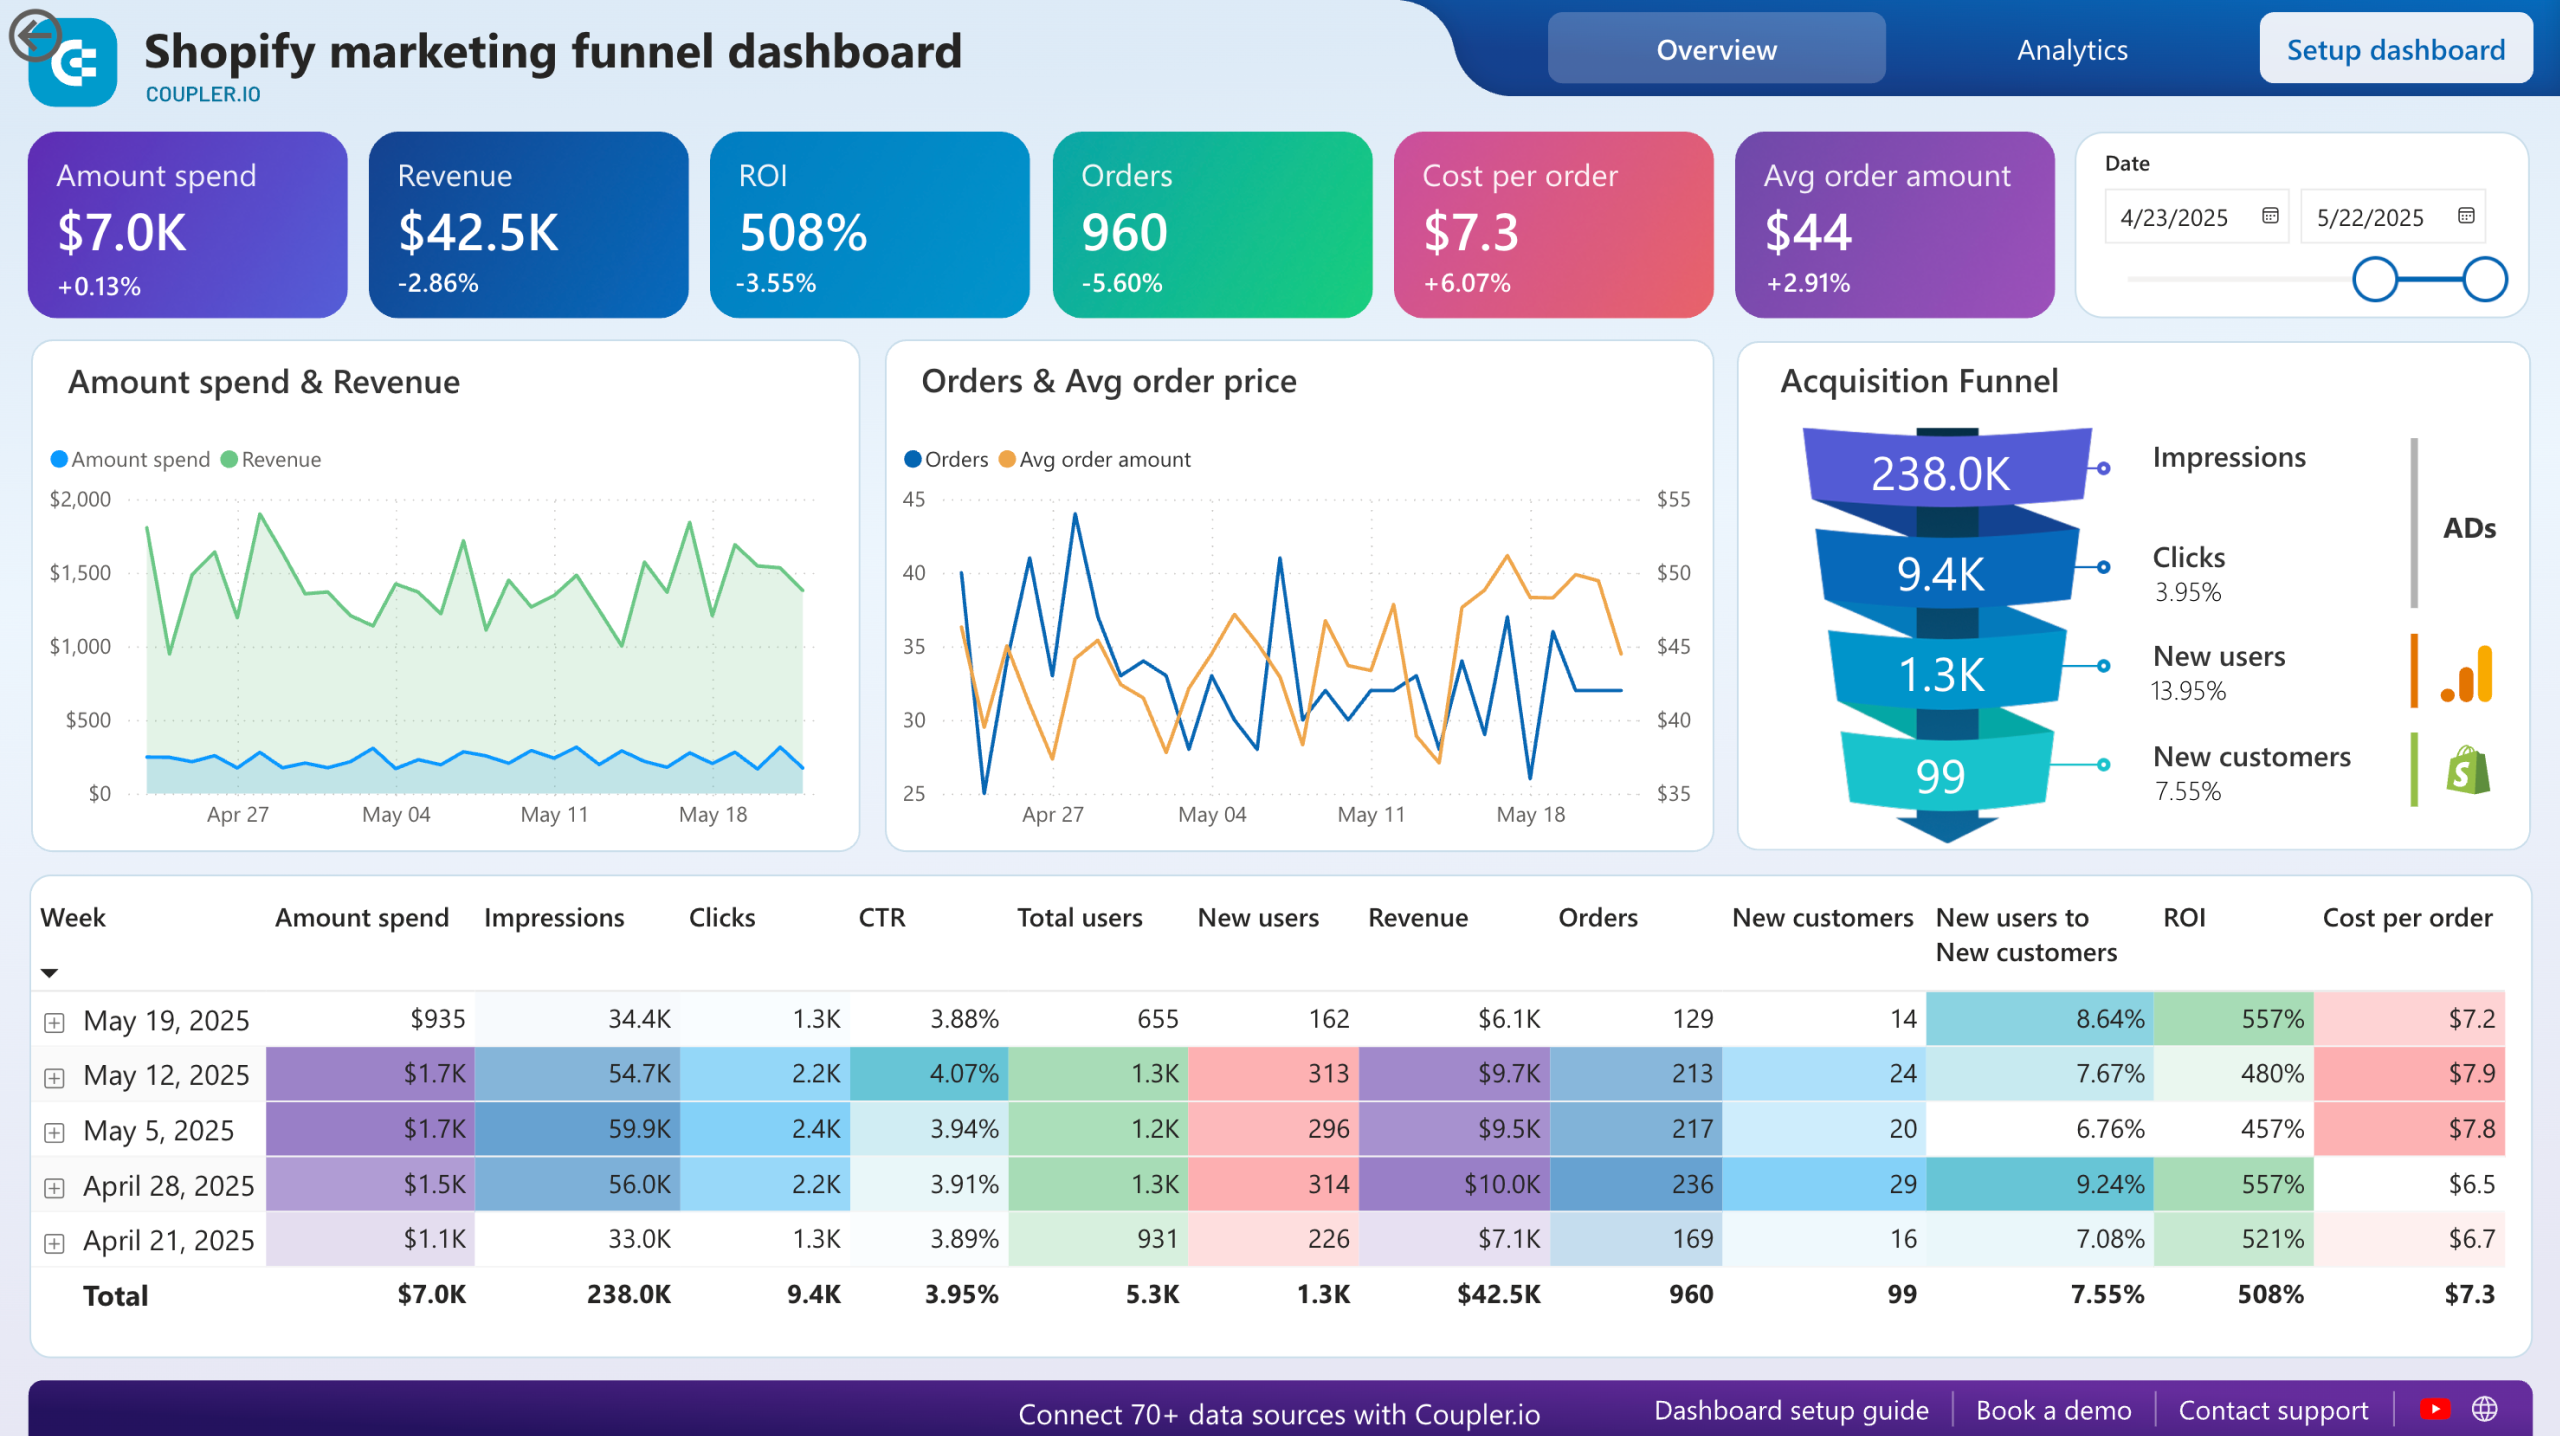
Shopify marketing funnel dashboard in Power BI
Examine the customer journey from advertising exposure to purchase completion with integrated data from your Shopify store, advertising platforms, and analytics tools.
Sales pipeline vs. funnel: common misconceptions and mistakes
By now, you should understand the difference between a sales pipeline and a sales funnel. However, many marketers and sales professionals still mix up these terms. In this section, we will address some of the common misconceptions about these two concepts and highlight the frequent mistakes made when creating a sales pipeline and a sales funnel.
- Sales Pipeline and Sales Funnel Are the Same: A common misconception is that sales pipelines and sales funnels are the same. A sales funnel visualizes the customer journey from awareness to purchase, while a sales pipeline tracks individual sales opportunities. Confusing these two can lead to misaligned strategies, resulting in gaps in nurturing leads and closing deals.
- Only the Sales Team Should Be Involved in Managing the Pipeline: Successful sales pipelines require collaboration between sales and marketing teams. Marketing drives awareness and generates leads, while sales convert them. Without collaboration, leads may not be properly nurtured, resulting in lost opportunities and lower conversion rates.
- More Leads in the Funnel Always Equals More Sales: Many believe that more leads automatically result in more sales, but quality is more important than quantity. Filling the funnel with unqualified leads can overwhelm the sales team and dilute efforts, reducing overall conversion rates.
- The Sales Funnel Ends at the Purchase Stage: Some assume the sales funnel ends once a purchase is made, but the customer journey continues with stages like onboarding, retention, and advocacy. Ignoring post-purchase stages can lead to poor customer retention and missed opportunities for upselling and referrals.
- Ignoring the Customer’s Perspective: Designing the sales pipeline or funnel solely from the company’s perspective without considering the customer’s experience is a common mistake. This can result in a disconnect, leading to lost sales. Aligning with the customer’s perspective improves engagement and conversions.
- Overcomplicating the Process: Overcomplicating the sales pipeline or funnel with too many stages and complex processes can hinder progress. This slows down the sales cycle and creates confusion. Simplifying stages and processes ensures clarity and efficiency.
- Failure to Adapt and Improve: Sticking to a static sales pipeline or funnel without regularly adapting to changes can be detrimental. Failing to adapt can lead to outdated practices and missed opportunities. Continuous improvement ensures effectiveness and competitiveness.
Sales funnel vs. pipeline: What is best for you?
Depending on your needs, you can choose between a sales funnel and a sales pipeline. A sales funnel helps you understand the overall customer journey, while a sales pipeline manages individual sales opportunities. No matter which you choose, tracking your data is essential.
Coupler.io dashboard templates are great for visualizing your key sales and marketing metrics data, helping you make better decisions. Make your own dashboard, track metrics, and optimize your sales processes to improve customer engagement and drive growth.
Visualize your sales and marketing data with Coupler.io
Get started for free