Sales reports help make decisions based on data and offer insights into customer behavior, market trends, sales performance, and other relevant information.
However, creating sales reports from scratch can be a daunting task. This is where sales report templates can be an ideal solution. These templates come with pre-designed tables, charts, and graphs to help analyze data.
We will go through 23 sales report templates for your specific needs, ranging from daily sales reports to the Salesforce dashboard sales report. Let’s dive right in!
CRM report templates
These CRM dashboards allow you to seamlessly manage all stages of your sales pipeline, understand the impact of won or lost deals, and identify your sales team’s best assets.
1. CRM report for Pipedrive
This reporting template is designed by Coupler.io and visualizes sales data from your Pipedrive CRM. It’s useful for keeping track of in-progress deals and for analyzing your sales pipeline by owner, stage, and deal type.
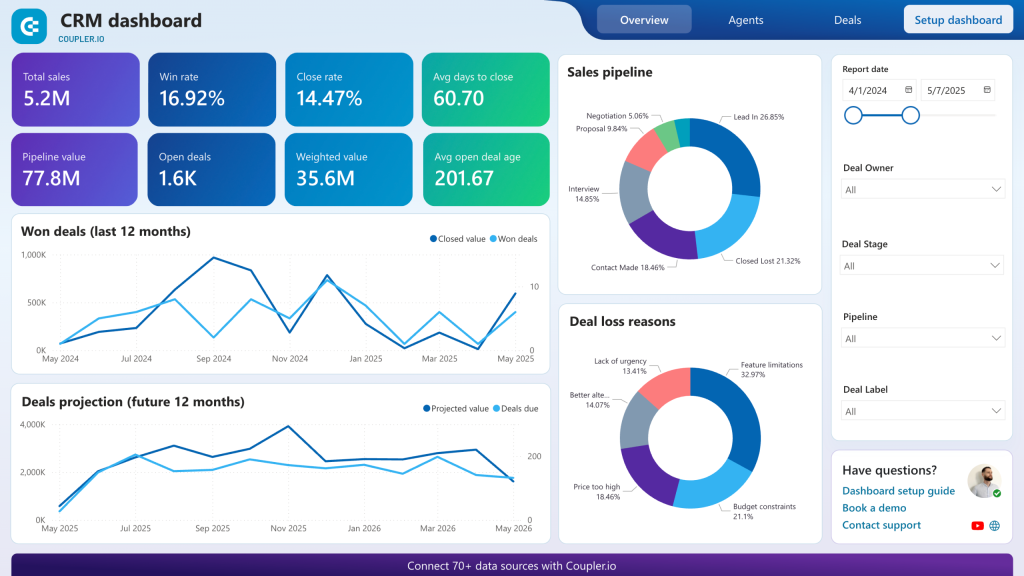
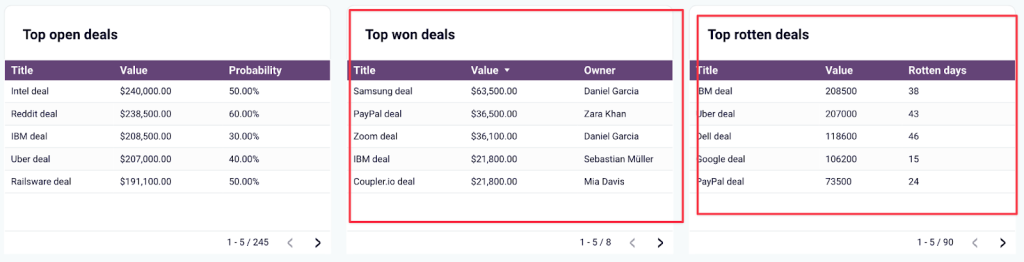
The template provides insight into top and worst-performing agents by deals closed. Identify your best-performing sales reps and allocate them more opportunities to improve close rates. You can also analyze your top won/lost deals to understand which types of opportunities bring the most revenue and how quickly your team should close a deal.
It’s quick and easy to set up this template with Coupler.io. Simply sign up for a free account and get started with either Power BI or Looker Studio CRM dashboard in minutes.
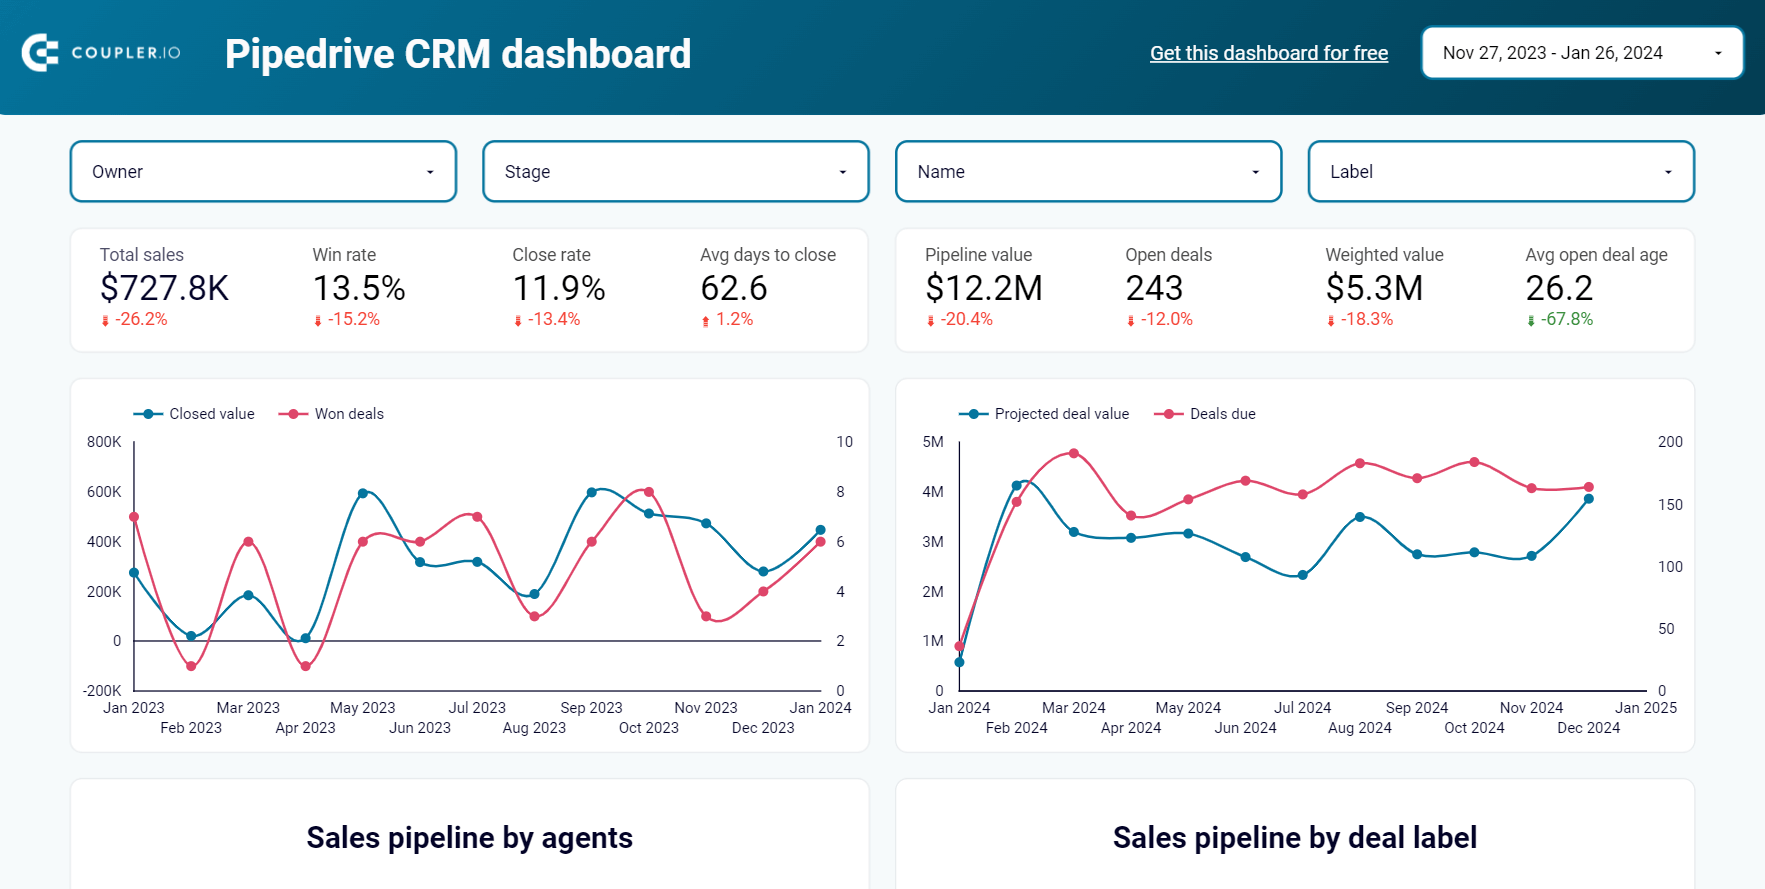
CRM dashboard for Pipedrive in Looker Studio
Stay on top of your Pipedrive sales using our CRM dashboard which allows you to analyze your sales department’s performance.


CRM dashboard for Pipedrive in Power BI
Track sales opportunities, monitor deal stages, and evaluate team performance with interactive visualizations that help identify bottlenecks and optimize your sales process.

List of metrics:
- Total sales
- Win rate
- Close rate
- Average days to close
- Pipeline value
- Open deals
- Sales pipelines
- Deal stages
- Top and worst agents
- Agents comparison
- Lost deal reasons
- Top lost, won, rotten deals
Template rating
| Usability | ????? |
| Design | ????? |
| Customization | ???? |
| Accuracy | ????? |
| Integration | ????? |
| Availability | Free |
2. CRM report template for HubSpot in Looker Studio
If you use HubSpot as your main sales CRM, this template is a great tool for visualizing and managing your sales pipeline. It’s equipped with Coupler.io’s built-in connector, which pulls deals data from your HubSpot account and loads it to an auto-updating Looker Studio dashboard.
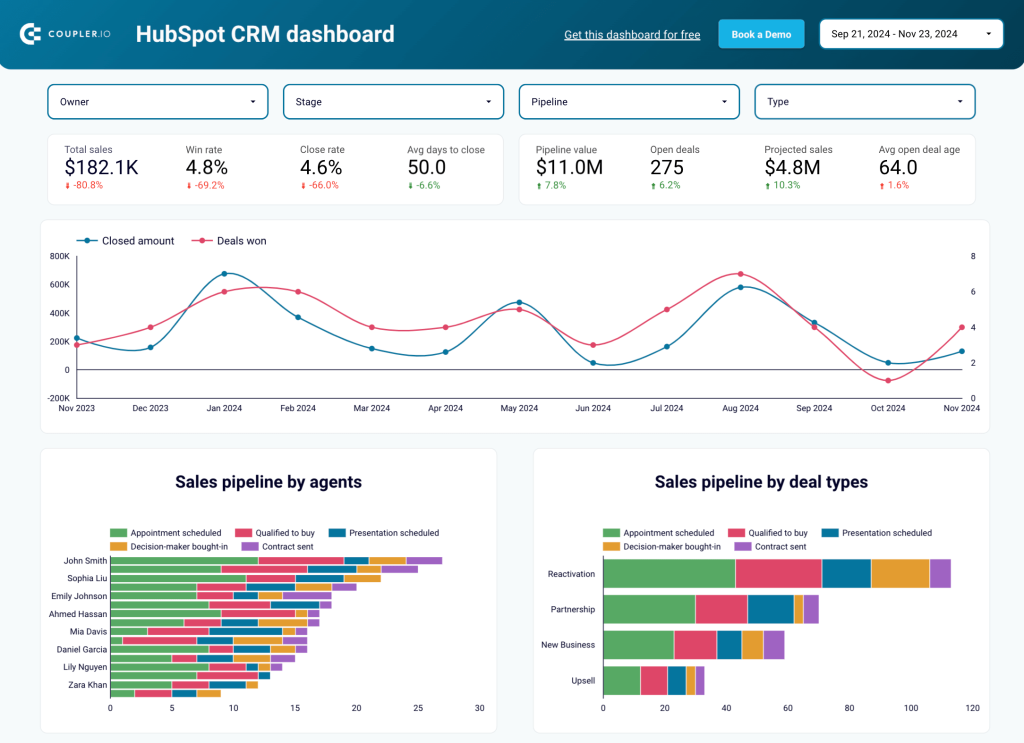
With this template, you can examine different aspects of your sales pipeline (deal types, agents, etc.) and uncover which opportunities or team members deliver the best return on investment.
You can also track the progression of open deals in a comprehensive table. Analyzing deal amount by source and comparing agent performance allows you to adjust sales strategy and improve resource allocation.
This CRM dashboard is available in Looker Studio with a Coupler.io account. It takes less than five minutes to get started with the template and set up automated data refresh (daily, weekly, or up to every 15 minutes).
List of metrics:
- Win rate
- Close rate
- Average days to close
- Deal amount
- Pipeline value
- Open deals
- Total sales
- Sales pipelines
- Deal stages
- Top and worst agents
- Agents comparison
- Lost deal reasons
- Top lost, won, rotten deals
Template rating
| Usability | ????? |
| Design | ????? |
| Customization | ???? |
| Accuracy | ????? |
| Integration | ????? |
| Availability | Free |
3. CRM report template for Salesforce
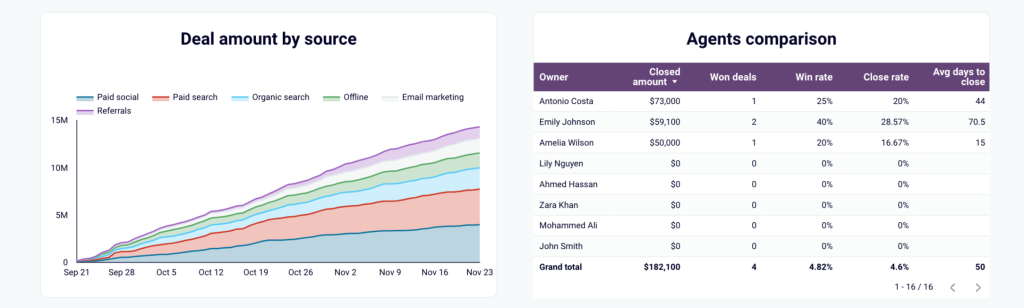
This CRM template looks similar to the first Pipedrive dashboard. However, it is tailored for Salesforce users and has a dedicated page for analyzing open and won opportunities. It also includes metrics such as campaign overview and revenue by lead source to help improve sales outcomes.
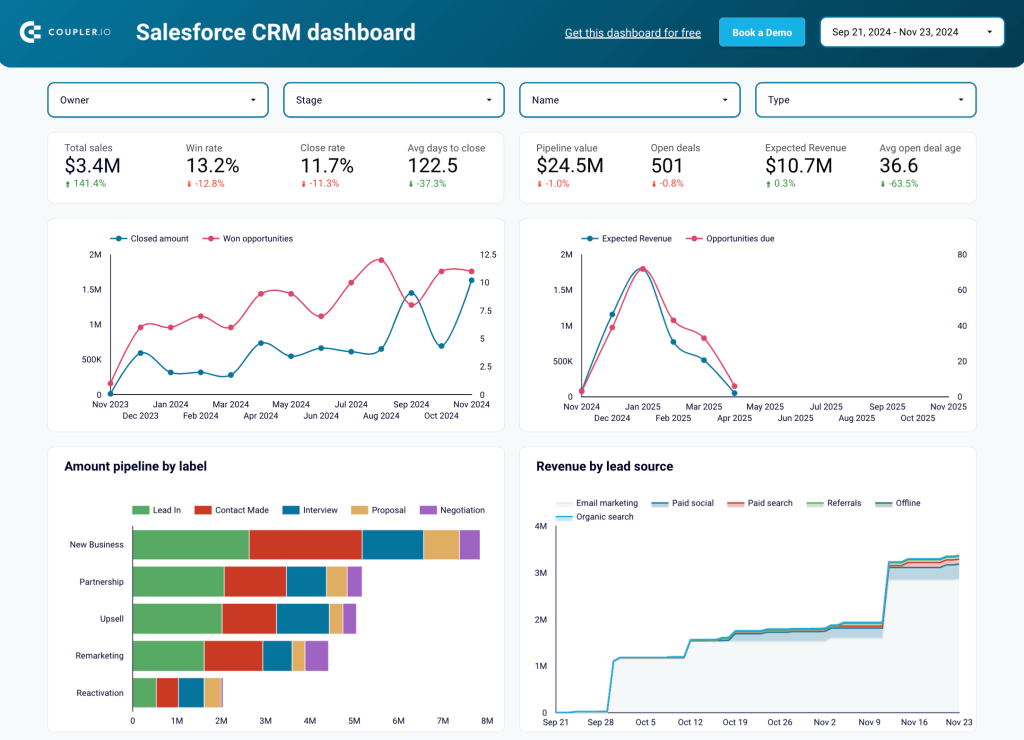
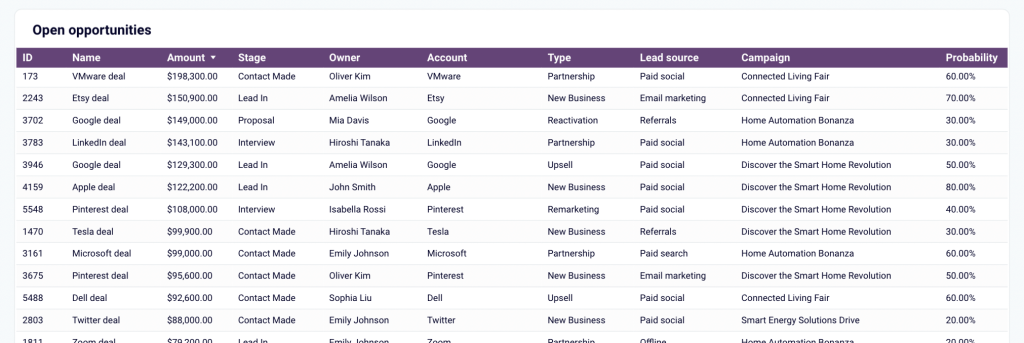
For instance, the revenue by lead source metric helps identify which marketing/outreach sources generate the most sales revenue. You can use this information to optimize budget allocation and refine leads targeting. The second page of the template focuses on opportunities data. It has several tables and graphs such as this table for tracking your open deals in detail.
The template is available in either Looker Studio or Google Sheets. To get a copy of your Salesforce data, simply create a free Coupler.io account and follow the instructions to set up the dashboard and configure automated data refreshes:
List of metrics
- Total sales
- Win rate
- Close rate
- Average days to close
- Pipeline value
- Open deals
- Expected sales revenue
- Sales pipelines by agents and label
- Top and worst agents by closed deal
- Agents comparison
- Revenue by lead source
- Top open, won, and stalled opportunities
- Accounts and campaign overview
- Amount closed by country, industry, and ownership type
Template rating
| Usability | ????? |
| Design | ????? |
| Customization | ???? |
| Accuracy | ????? |
| Integration | ????? |
| Availability | Free |
Sales analytics dashboards
This selection of sales analytics dashboards focuses on sales metrics for Pipedrive or HubSpot. You can dive deep into key performance indicators and analyze your team’s results from several angles.
4. Sales KPI report template for Pipedrive in Looker Studio
This sales report template highlights key Pipedrive KPIs such as revenue, close rate, and lost value. It goes further than the CRM template by offering 3 pages of insights: sales overview, sales pipeline, and team performance. You can monitor the overall health of your sales strategy while tracking team efficiency.
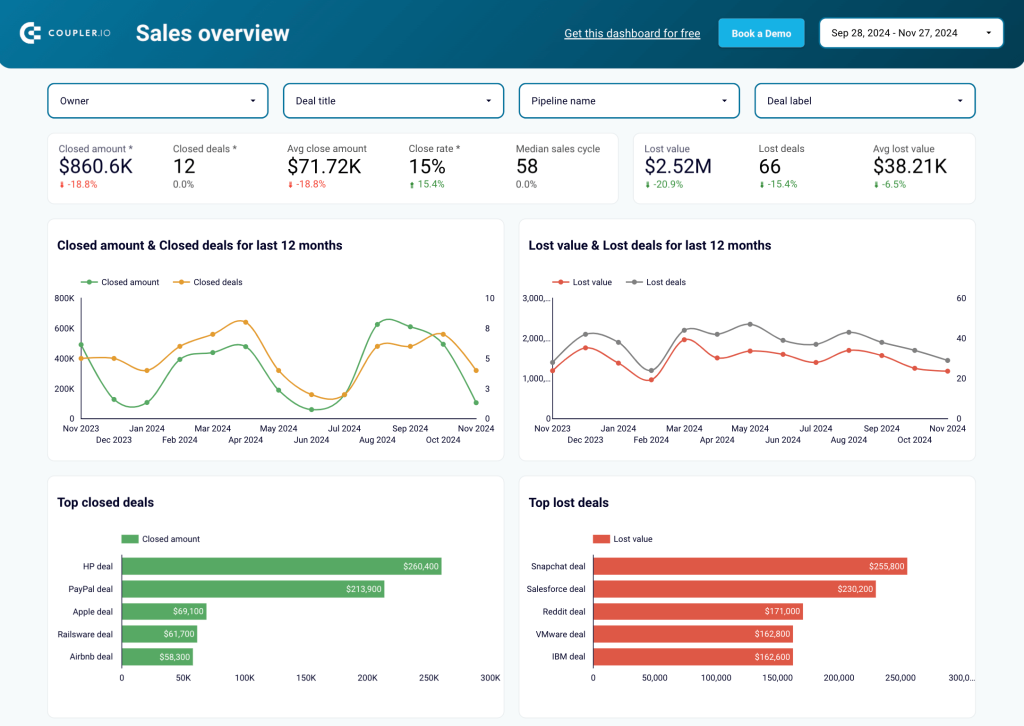
There are several charts and graphs for evaluating the reasons for lost deals and the best owners. You can also assess closed/lost deals by month to identify seasonal patterns and boost close rates. A customizable sales pipeline visualization is helpful for quickly spotting bottlenecks and ensuring your process runs smoothly.
On the last page of the report, you can compare and analyze individual sales team performance using metrics such as sales revenue, won deals, and won/lost ratio. This can help you identify stages with higher conversion rates and plan future sales strategies.
This reporting template has an integrated Pipedrive connector by Coupler.io, allowing you to automate data collection on a schedule. You can choose an update interval of monthly, daily, or even every 15 minutes!
List of metrics:
- Revenue
- Won deals
- Lost revenue
- Lost reason
- Lost deals
- Close amount
- Lost value
- Avg. days to close
- Won/Lost ratio
- Open deals
- Best/worst owners
- Top open/rotten deals
Template rating
| Usability | ????? |
| Design | ????? |
| Customization | ???? |
| Accuracy | ????? |
| Integration | ????? |
| Availability | Free |
5. Sales KPI report template for HubSpot in Looker Studio
This template for HubSpot is almost identical to the previous example. It has 4 pages in total, and focuses on main sales KPIs such as closed amounts, revenue, and won deals. However, unlike the version above, this template is built specifically for integration with your HubSpot CRM.
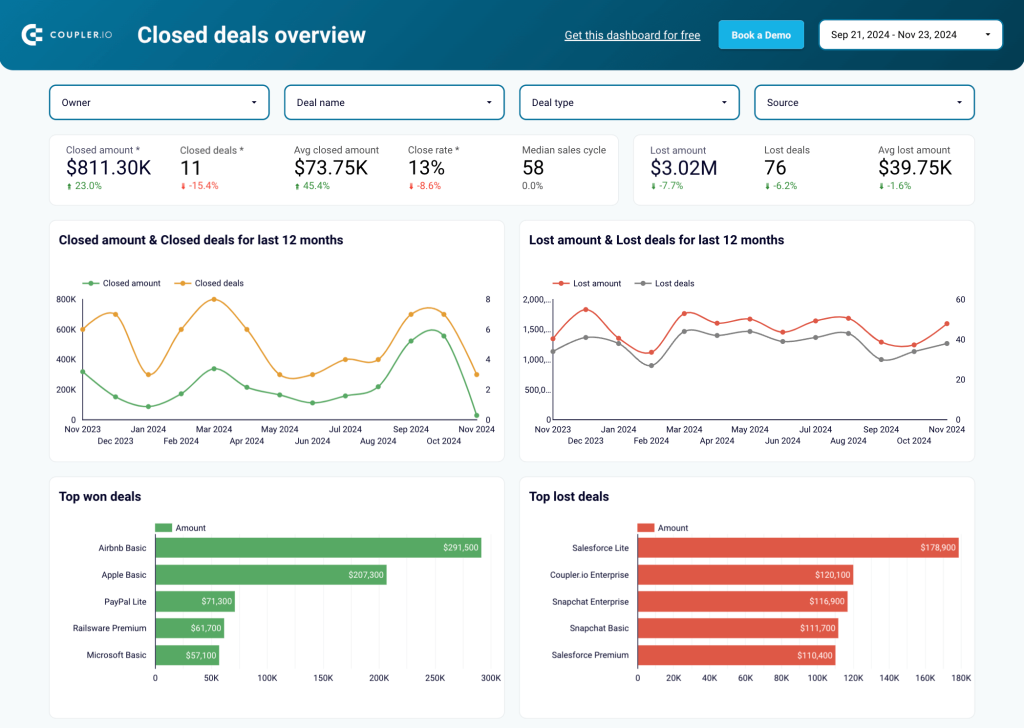
Again, it has a handful of charts and graphs that provide insight into the reasons for lost deals and your team’s lowest performers. The template also has a customizable, 5-stage pipeline for visualizing the sales journey, and tables for comparing the efficiency of sales reps.
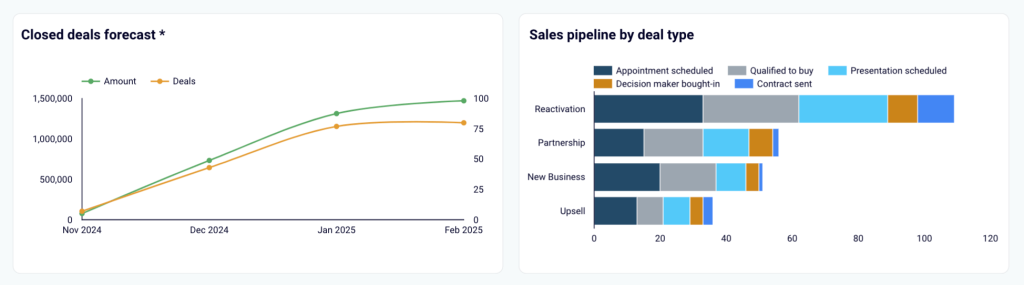
One of the standout features is a closed deals forecast chart, which shows the predicted deal revenue for the next couple of months based on open deal amounts. You can also examine the pipeline by deal type to see which ones bring the best results.
To get a copy of this template in Looker Studio and connect your HubSpot data, create a free Coupler.io account. Don’t forget: you can turn on automatic updates to ensure you always have the freshest sales data on hand.
List of metrics:
- Revenue
- Won deals
- Lost revenue
- Lost reason
- Lost deals
- Close amount
- Lost value
- Avg. days to close
- Won/Lost ratio
- Open deals
- Best/worst owners
- Top open/rotten deals
Template rating
| Usability | ????? |
| Design | ????? |
| Customization | ???? |
| Accuracy | ????? |
| Integration | ????? |
| Availability | Free |
Report templates for Salesforce
Here are a few dashboard templates specific to Salesforce CRMs. With the help of Coupler.io, you can easily connect your Salesforce account and populate the template in Looker Studio.
6. Salesforce report template in Looker Studio
This Salesforce dashboard template comes equipped with essential metrics for tracking and analyzing sales revenue and opportunities, such as revenue by stage, period, and source. It includes a general overview and separate pages for analyzing open, won, and lost opportunities.
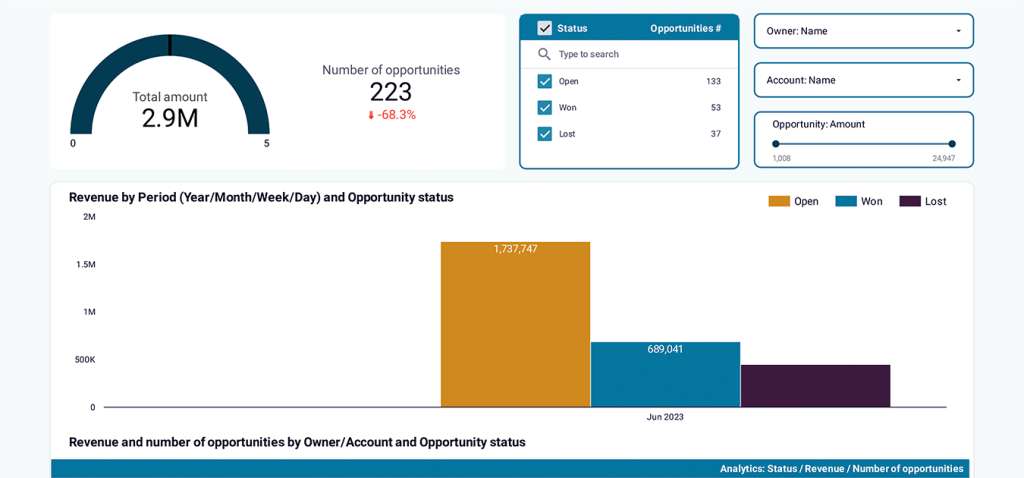
With this template, you get an immediate overview of your sales performance. The main page helps you keep track of your open opportunities and the revenue they generate, so you can make timely adjustments to your sales strategy.
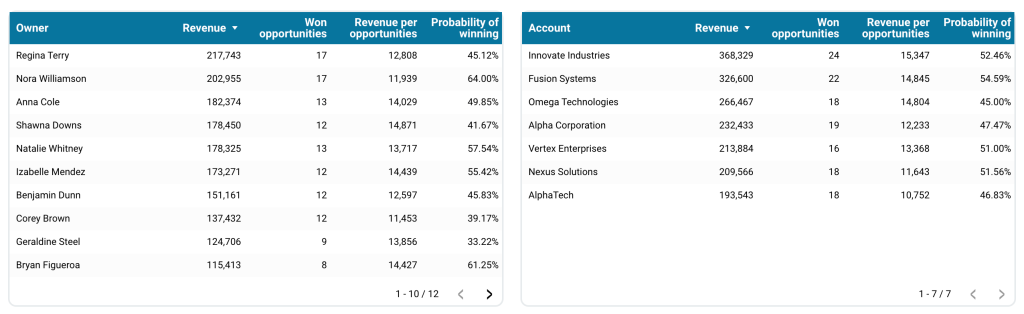
The other pages let you examine the key drivers of success or causes of failure. Filter open, won, or lost data by type, stage, lead source, and other parameters to uncover trends and underlying issues. Or, compare results by account or owner to determine win probability.
Get a free copy of this template designed by Coupler.io by following the instructions in the Looker Studio dashboard preview:
List of metrics:
- Total sales amount
- Open opportunities
- Won opportunities
- Lost opportunities
- Number of opportunities
- Revenue by period and opportunity status
- Revenue and number of opportunities by owner, account, and status
- Revenue by source
- Revenue by stage name
- Probability of winning
Template rating
| Usability | ????? |
| Design | ????? |
| Customization | ???? |
| Accuracy | ????? |
| Integration | ????? |
| Availability | Free |
7. Sales team performance report template in Looker Studio
This dashboard template provides an overview of your sales team’s performance. It helps you pinpoint your team’s top performers and track the efficiency of sales reps as they guide leads through each pipeline stage.
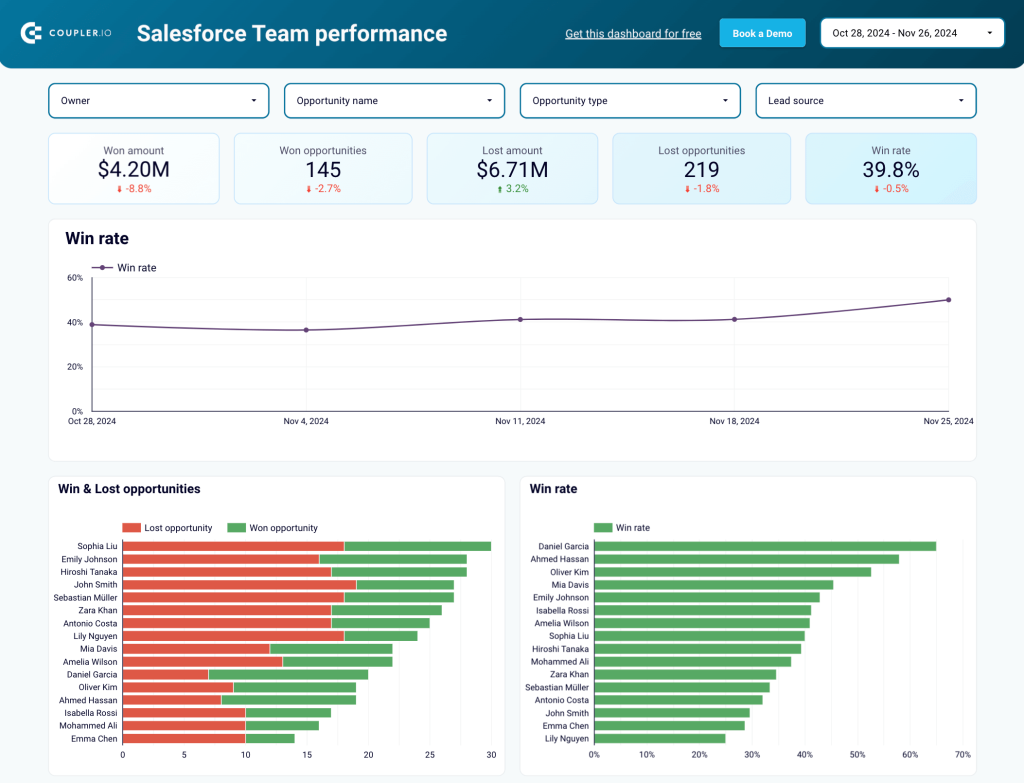
The template is a great tool for evaluating and comparing the individual performance of each team member. For example, you can compare results based on the number of deals or revenue generated. This will help you assign the best sales reps to opportunities with the highest revenue potential.
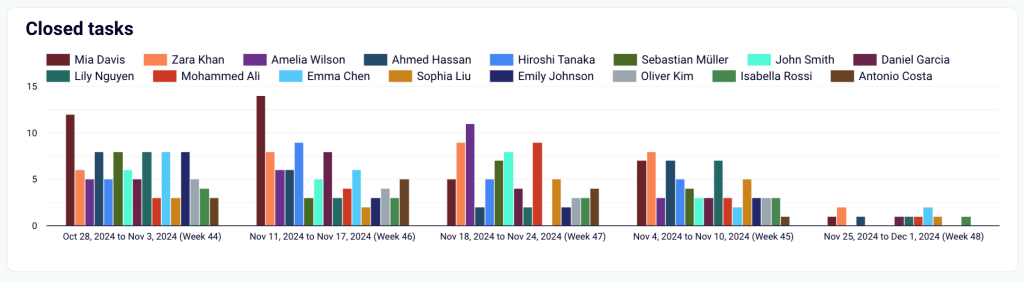
For deeper analysis, compare performance by won/lost amounts, opportunity size, and individual pipeline efficiency. On the second page of this report, you can also measure the productivity of sales reps by task status.
It only takes a few minutes to create a copy of this template with your Salesforce data and start tracking the performance of your team in near real time. Find it in Looker Studio:
List of metrics:
- Won/lost amount
- Won/lost opportunities
- Win rate
- Close rate
- Open opportunities
- Won opportunities
- Open opportunities age
- Sales cycle length
- Closed tasks
- Open tasks
Template rating
| Usability | ????? |
| Design | ????? |
| Customization | ???? |
| Accuracy | ????? |
| Integration | ????? |
| Availability | Free |
8. Salesforce win/loss analysis report template in Looker Studio
This report template for Salesforce lets you perform an in-depth analysis of your win/loss data. You can easily compare won and lost opportunities by amount, industry, country, lead source, and other business-critical dimensions.
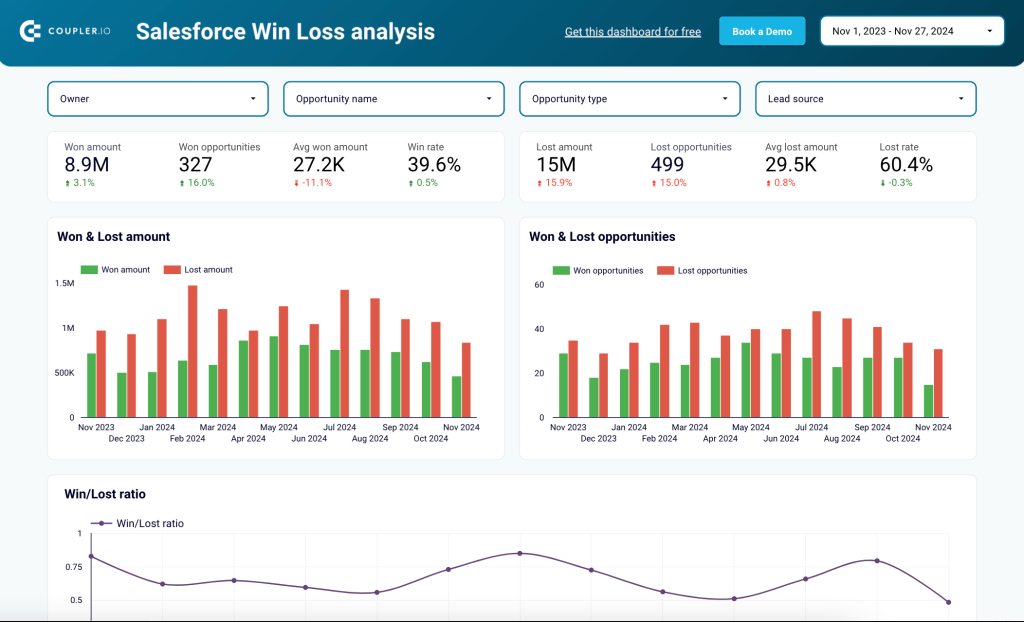
To get more out of the report, you can filter by owner, lead source, and opportunity. For example, if your team focuses heavily on upsells, you can filter data by Upsell deals to see if they generate the expected revenue. Explore several bar charts and tables to understand the reasons for lost opportunities and make strategic improvements.
To start using this dashboard template, simply sign up for a free Coupler.io account and connect your Salesforce data in minutes. Remember, you can also set up automatic data refreshes with a few clicks.
List of metrics:
- Won/lost amount
- Won/lost opportunities
- Win/lost ratio
- Avg won/lost amounts
- Win/lost rate
Template rating
| Usability | ????? |
| Design | ????? |
| Customization | ???? |
| Accuracy | ????? |
| Integration | ????? |
| Availability | Free |
Financial analytics sales dashboards
This set of financial analytics sales dashboards allow you to monitor the profitability and cost-efficiency of your sales pipeline.
9. Revenue report template for QuickBooks
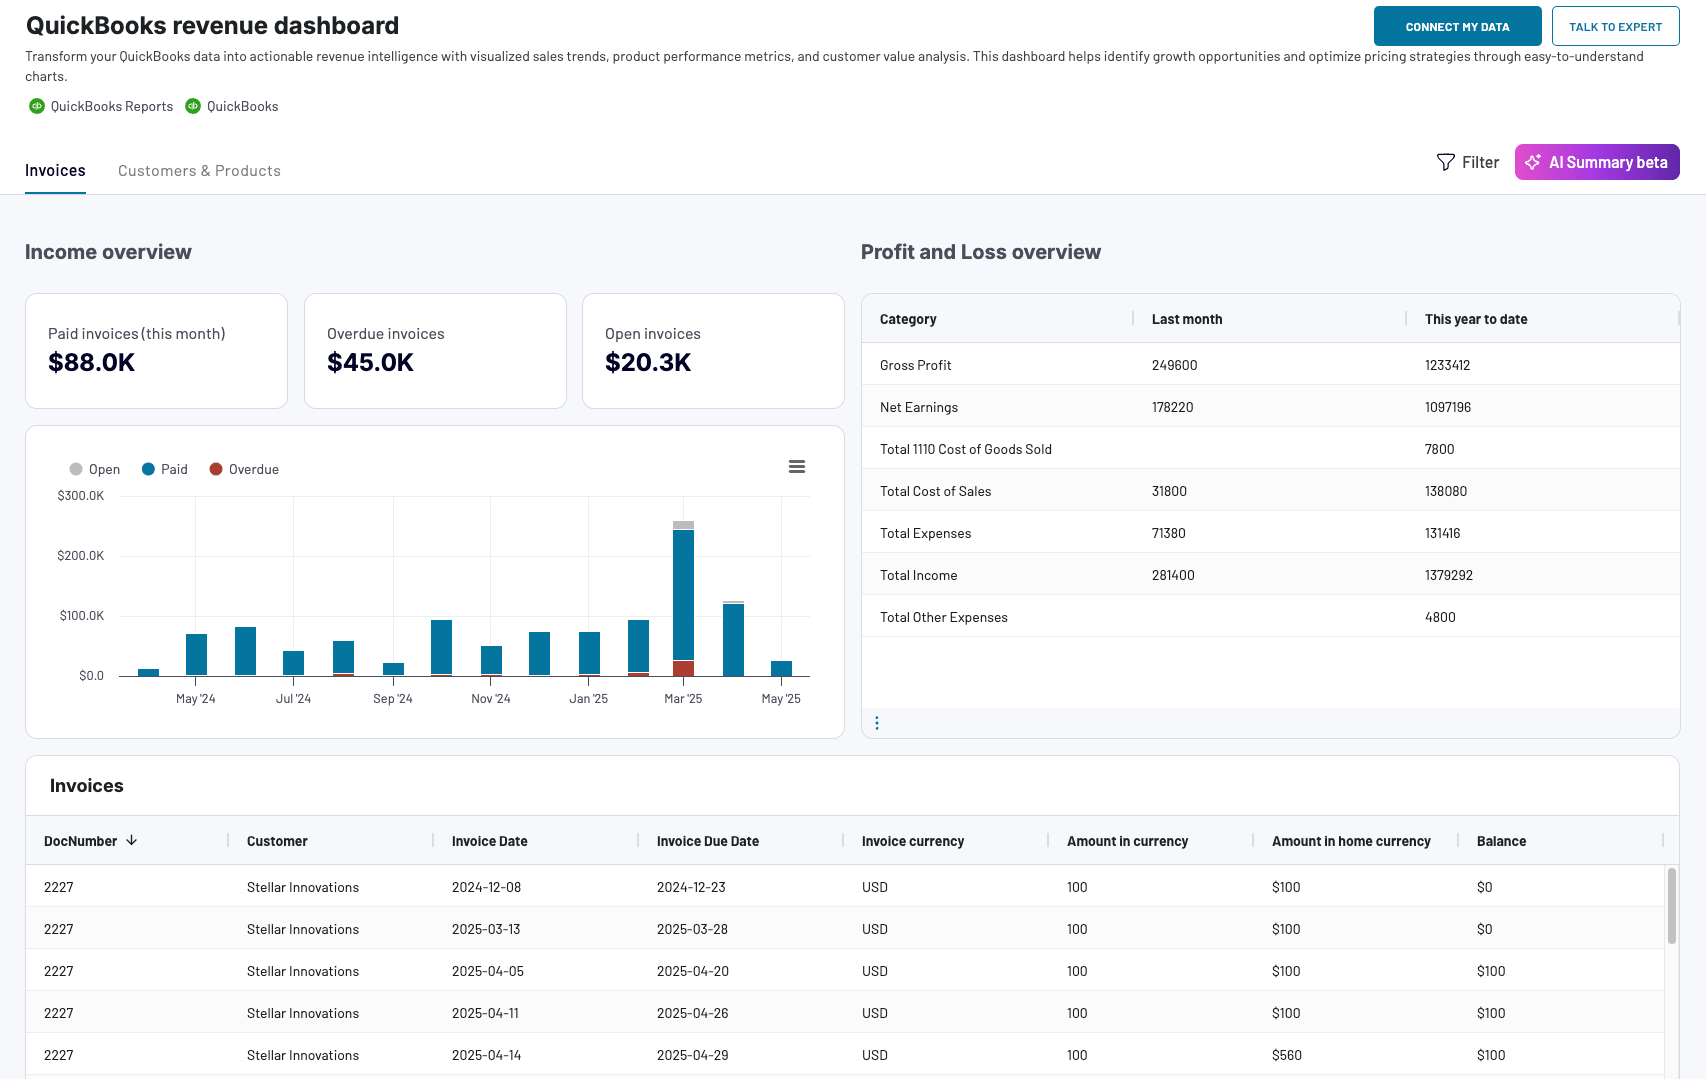
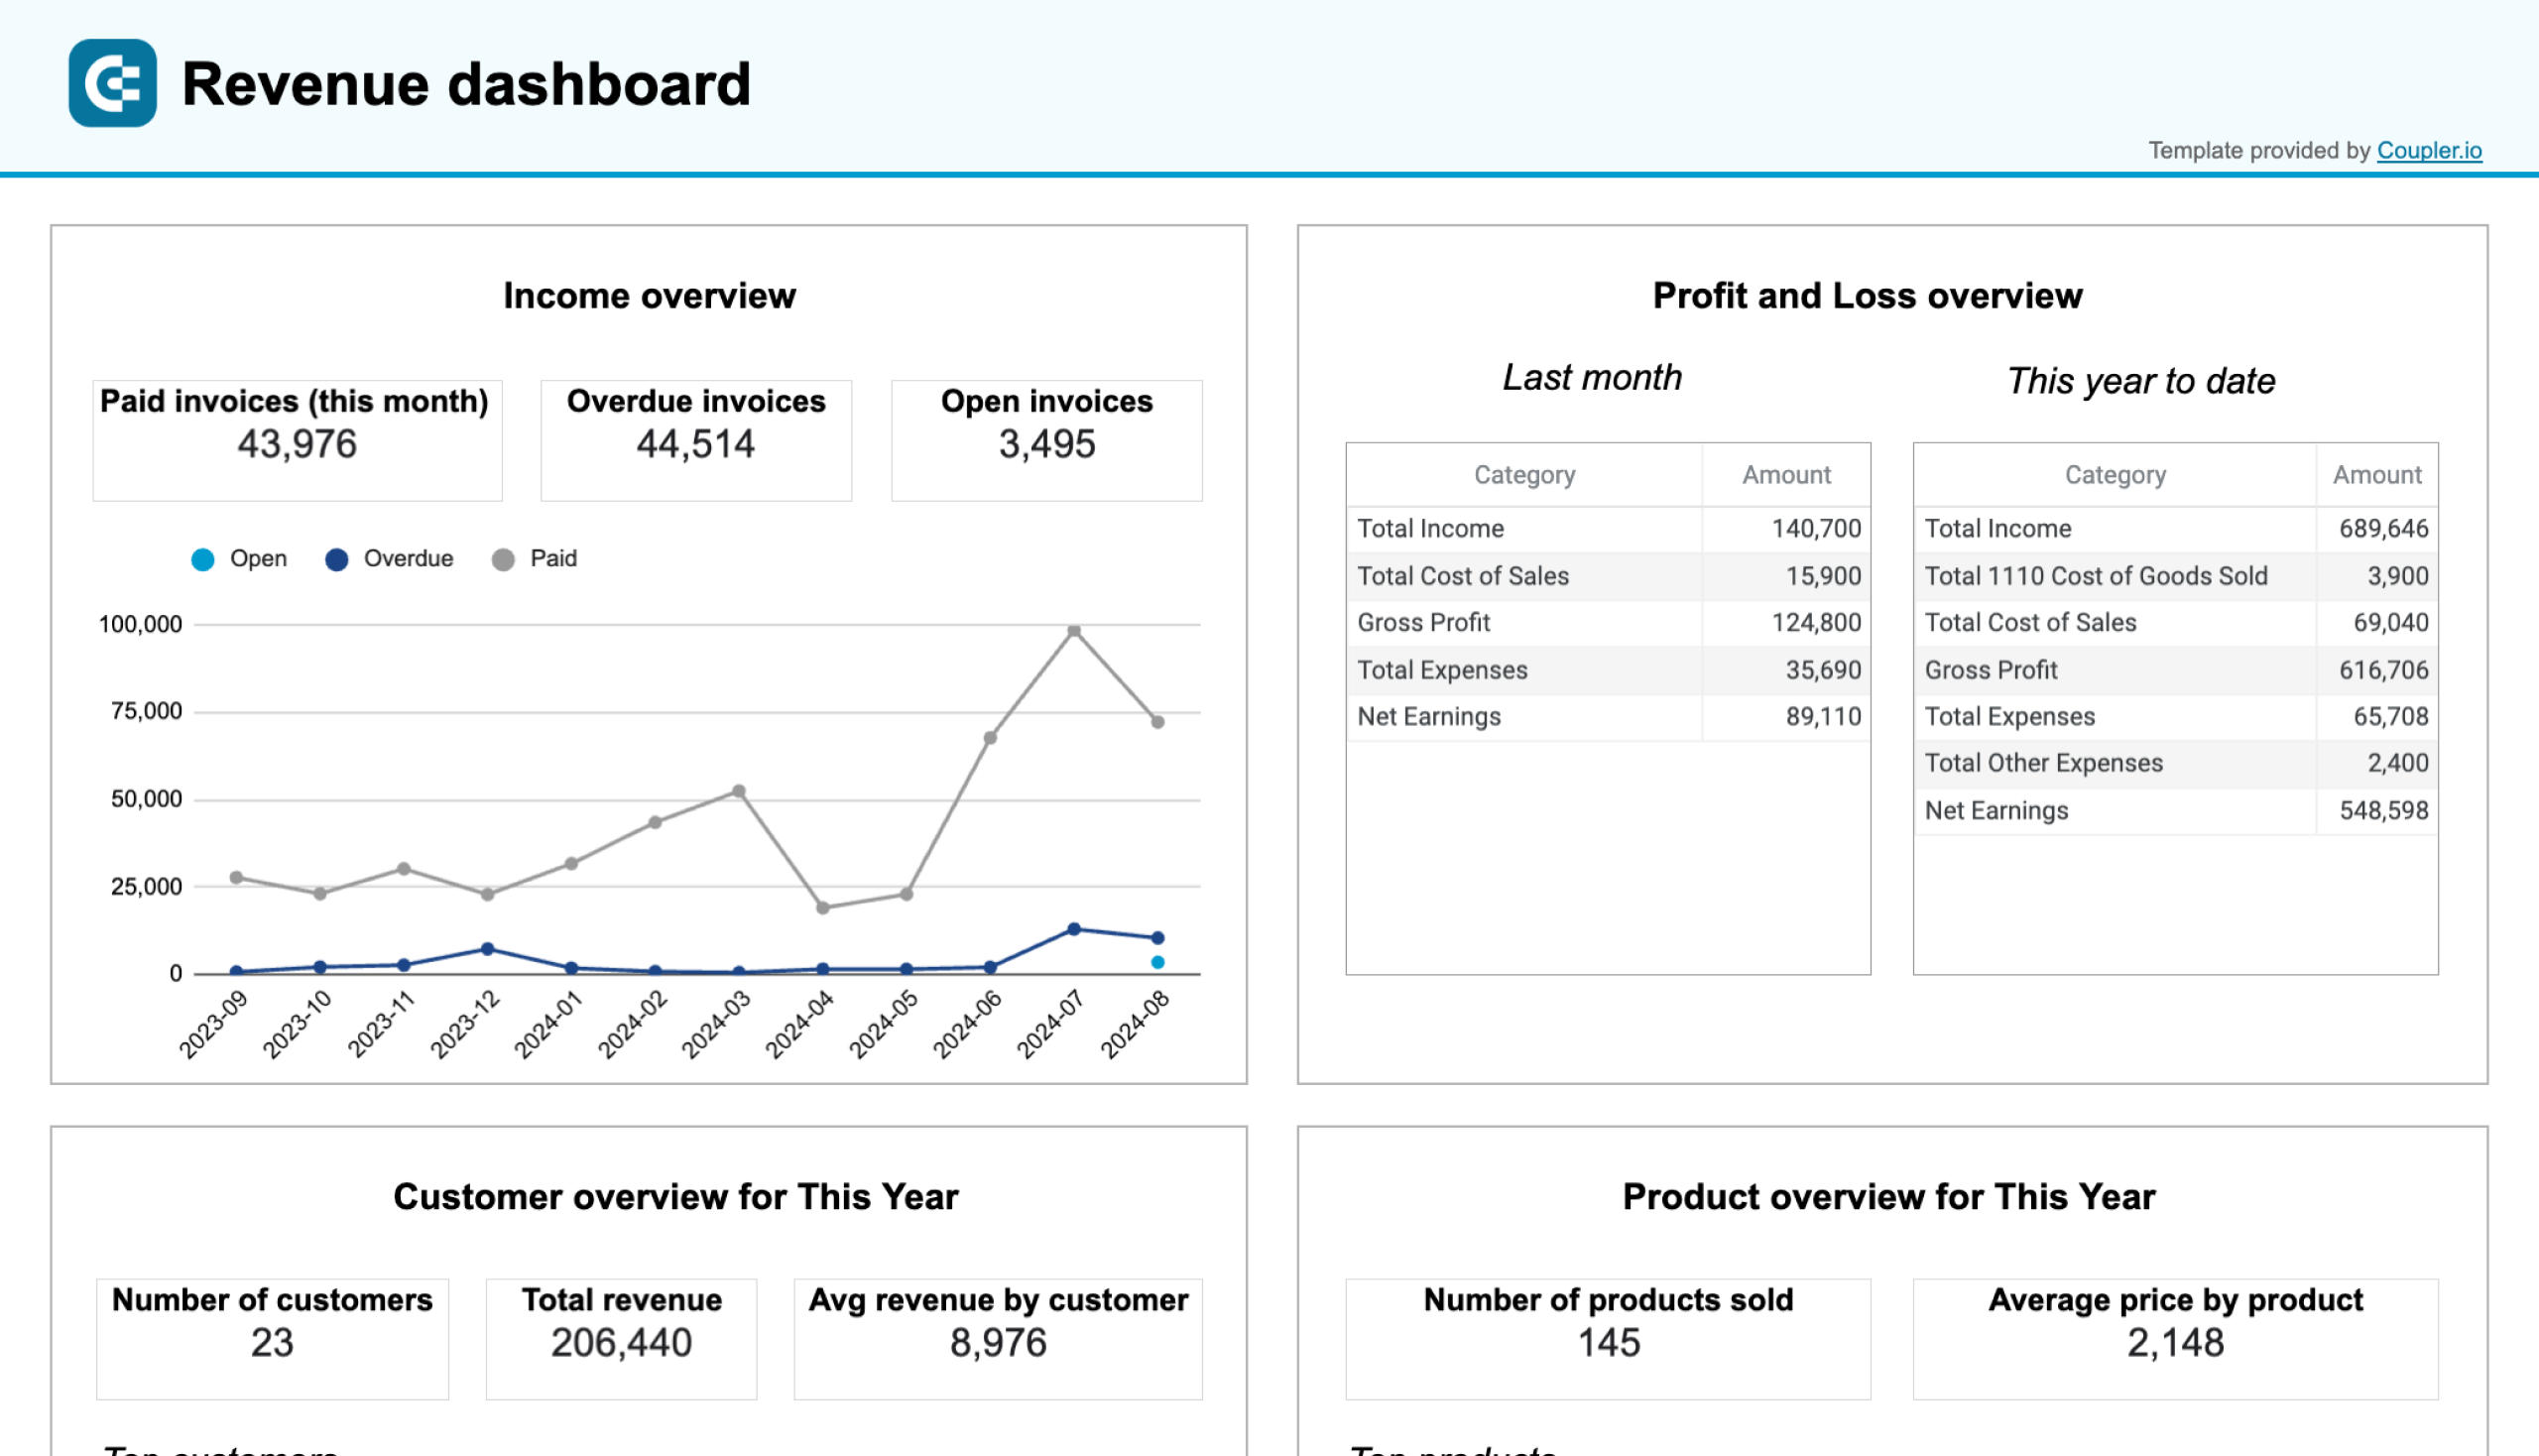
The revenue report template provides a complete overview of essential financial metrics such as income, profit, and loss overview. It offers insight into your revenue streams, financial performance, and business profitability.
QuickBooks revenue dashboard + AI insights
 Preview dashboard
QuickBooks revenue dashboard + AI insights
Preview dashboardThe dashboard allows you to track overall revenue trends for the last 12 months. Your sales team can leverage it to identify seasonal fluctuations in sales, peak revenue periods, and any unexpected dips. Metrics like average price, total sales, and top-selling products by quantity help you identify profitable products and create a decision-driven sales strategy.
This reporting template by Coupler.io is easy to use and available for free. You can use the native dashboard or a template for Google Sheets, Looker Studio, and Power BI. It takes less than 5 minutes to set up an account and start using this template in either of the following BI tools.
QuickBooks revenue dashboard
Transform your QuickBooks data into actionable revenue intelligence with visualized sales trends, product performance metrics, and customer value analysis. This dashboard helps identify growth opportunities and optimize pricing strategies through easy-to-understand charts.


QuickBooks revenue dashboard in Google Sheets
Analyze your revenue through a set of reports collected from QuickBooks Online on a single dashboard.

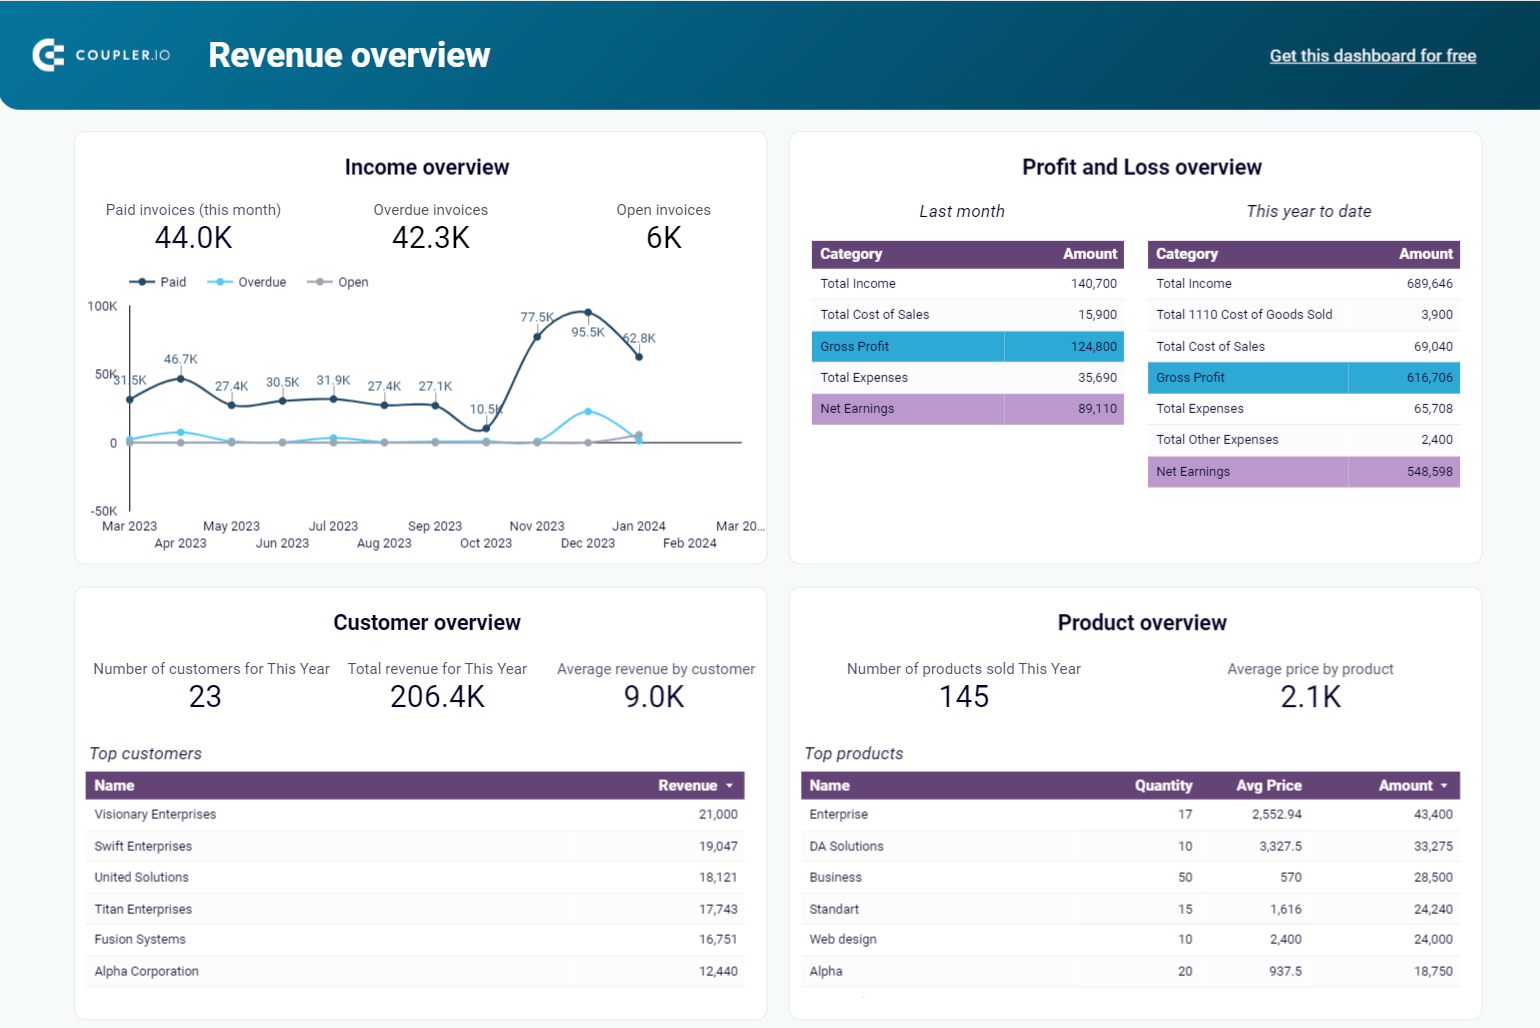
QuickBooks revenue dashboard in Looker Studio
Get an overview of your revenue based on the data from QuickBooks and unlock in-depth insights to drive informed business decisions.
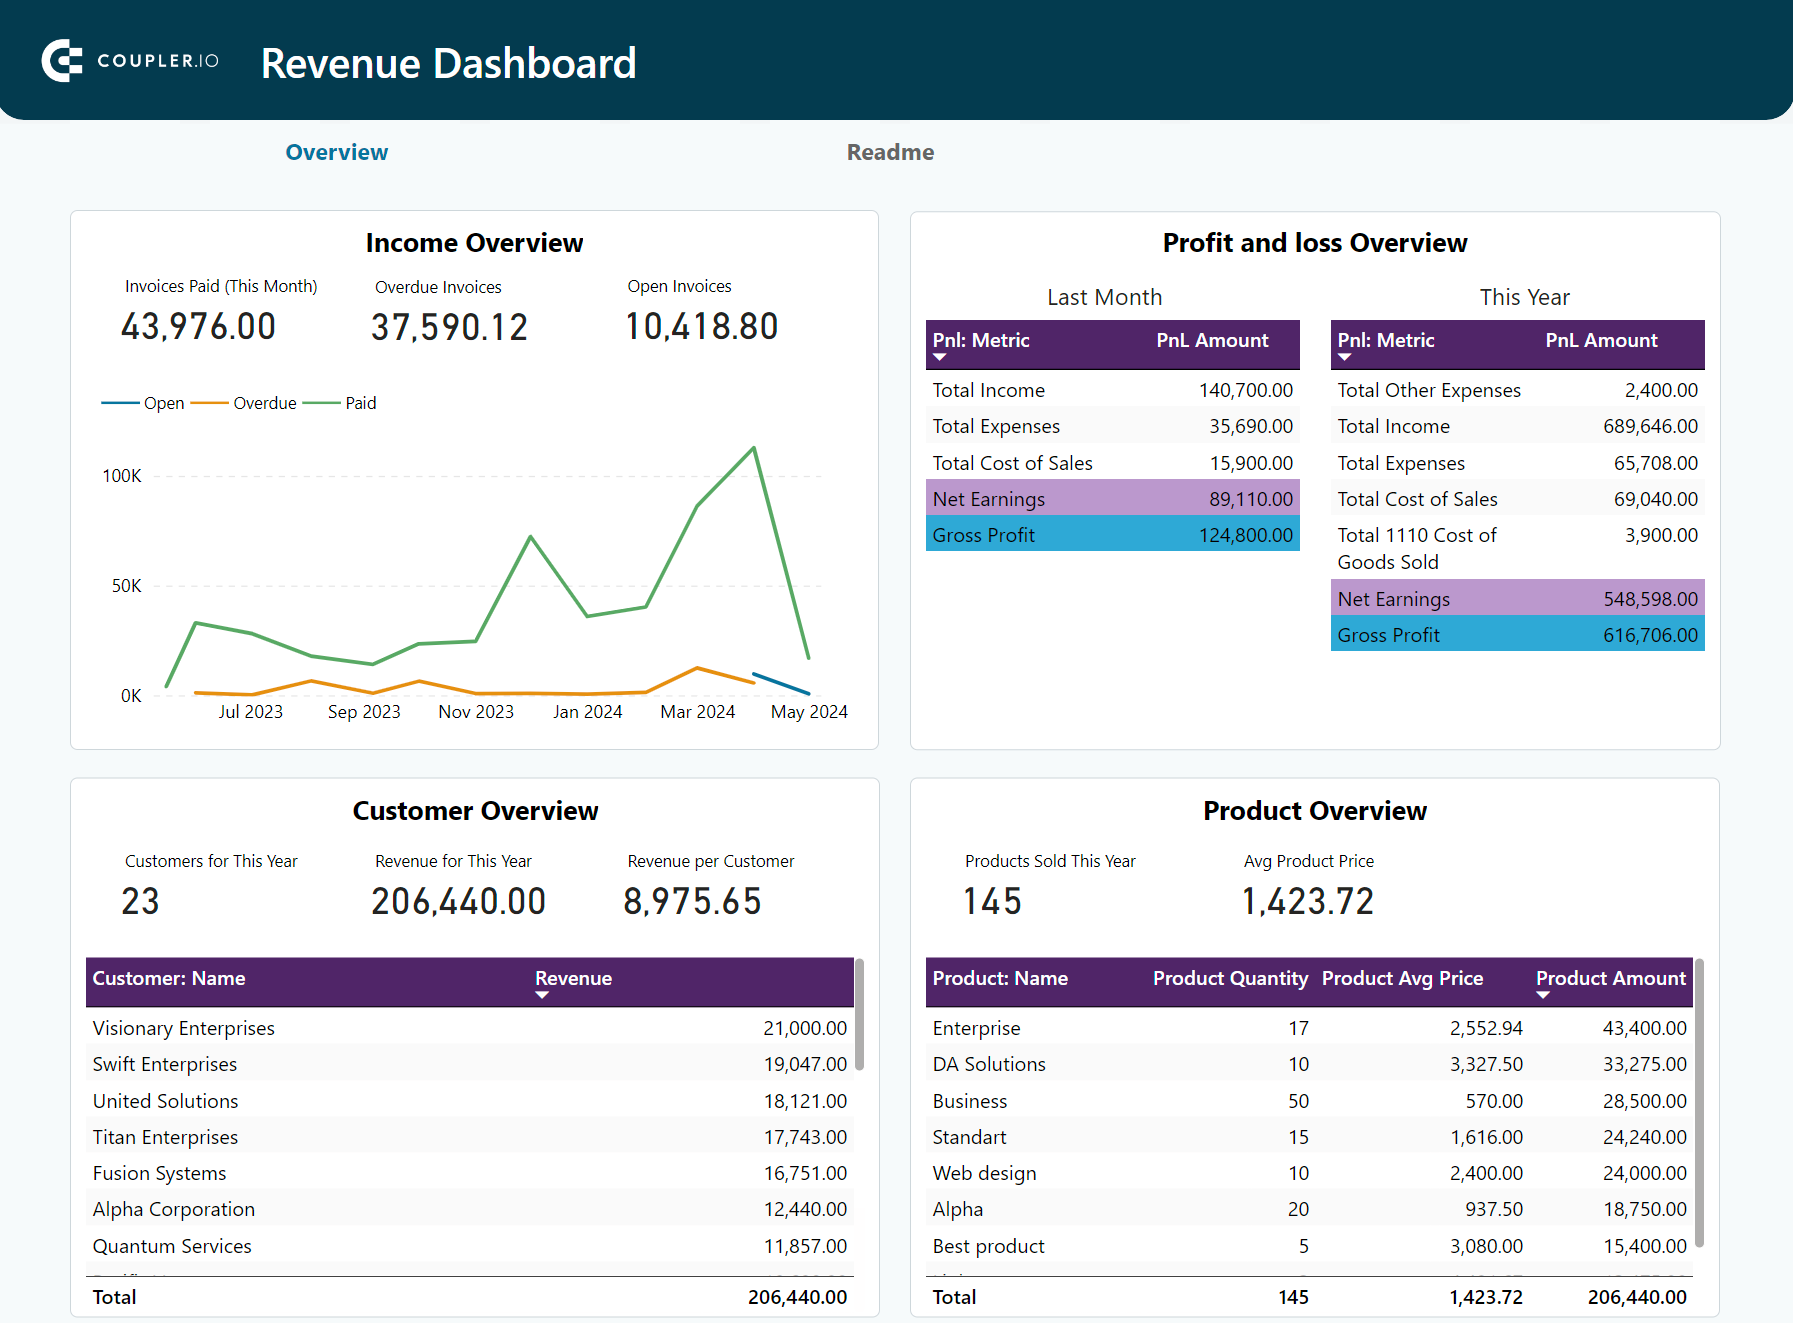
QuickBooks revenue dashboard in Power BI
Monitor your income and expenses on an all-in-one revenue dashboard connected to your QuickBooks Online account.
List of metrics:
- Paid invoices
- Overdue invoices
- Open invoices
- Total revenue
- Avg. revenue by customer
- Avg. product price
- Number of products sold
- Number of customers
Template rating
| Usability | ????? |
| Design | ????? |
| Customization | ???? |
| Accuracy | ????? |
| Integration | ????? |
| Availability | Free |
10. QuickBooks financial report template
Here’s another financial report template that can help your sales team understand the profitability and liquidity of the overall business. Like the previous example, it pulls data from your business’s QuickBooks account with Coupler.io’s built-in connector.
With this template, you can analyze the bar charts and tables, segmented by financial statement type: P&L, balance sheet, and cash flow. This will allow you to prioritize new opportunities in line with cash flow trends. It also helps you align the overall sales strategy with the company’s financial health.
This dashboard is designed in Coupler.io with AI insights available. Also, you can use it as a Looker Studio and Google Sheets template. To make it serve your reporting needs, go to the template’s Readme tab to set it up.
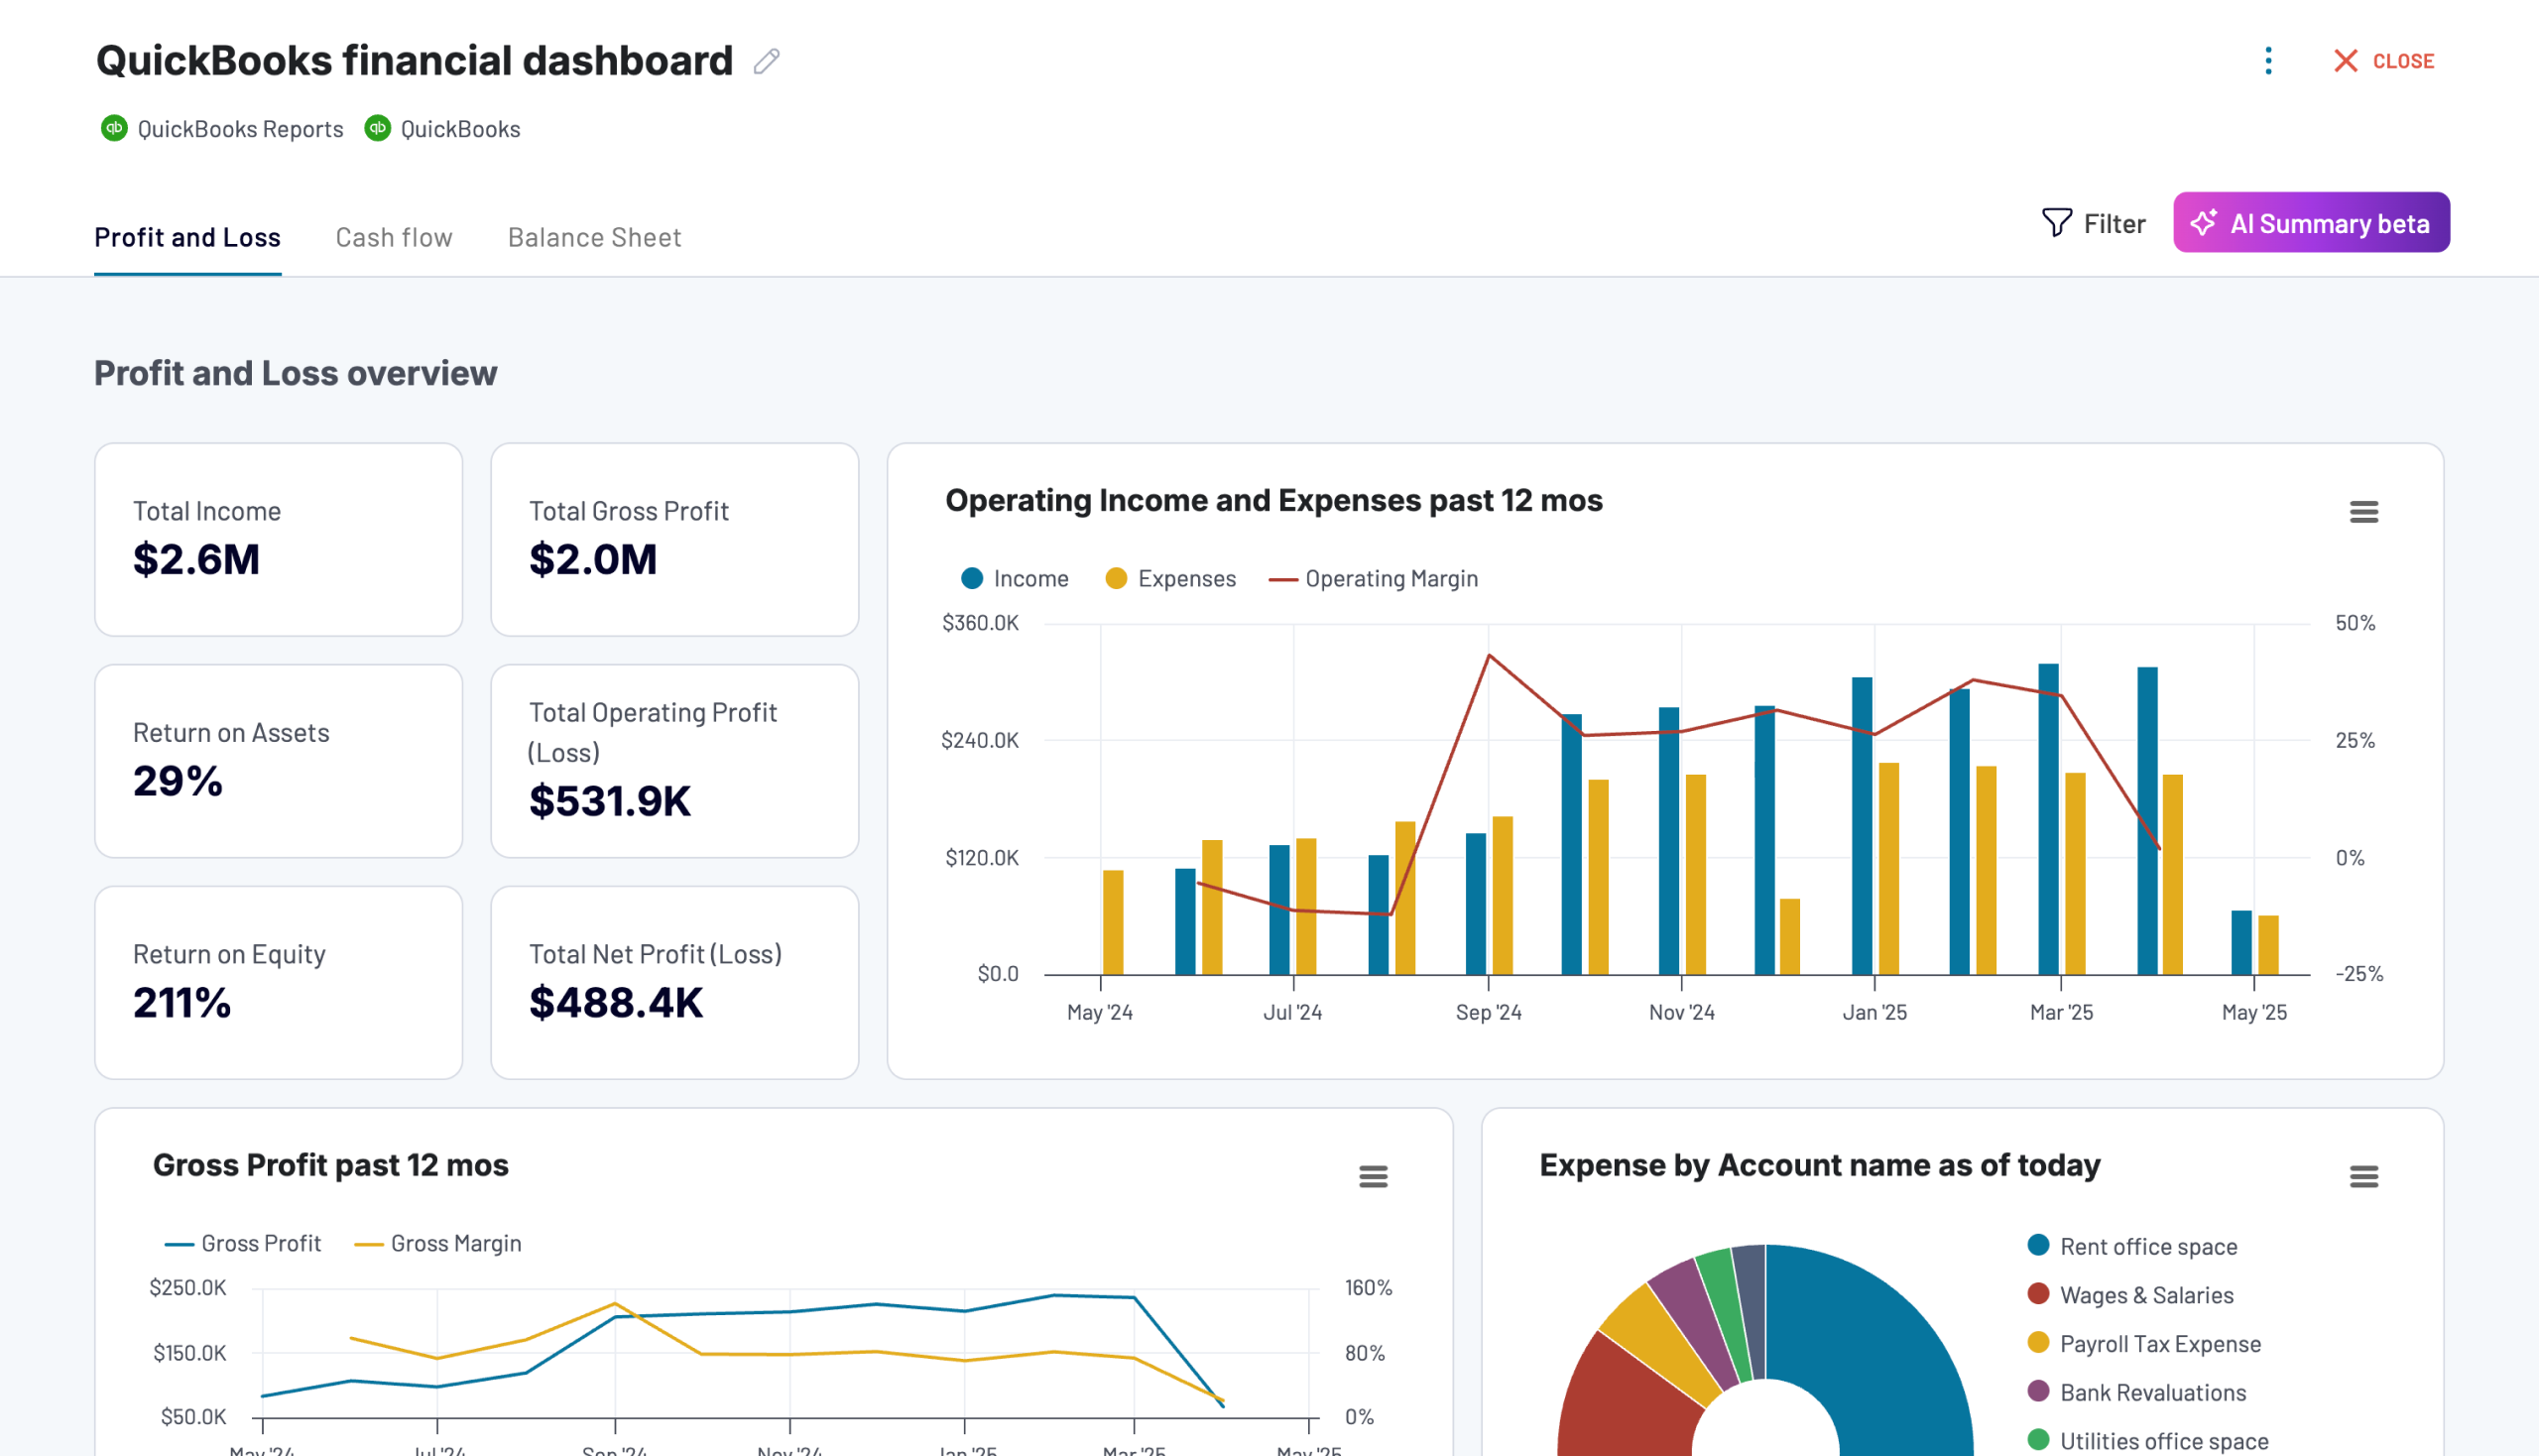
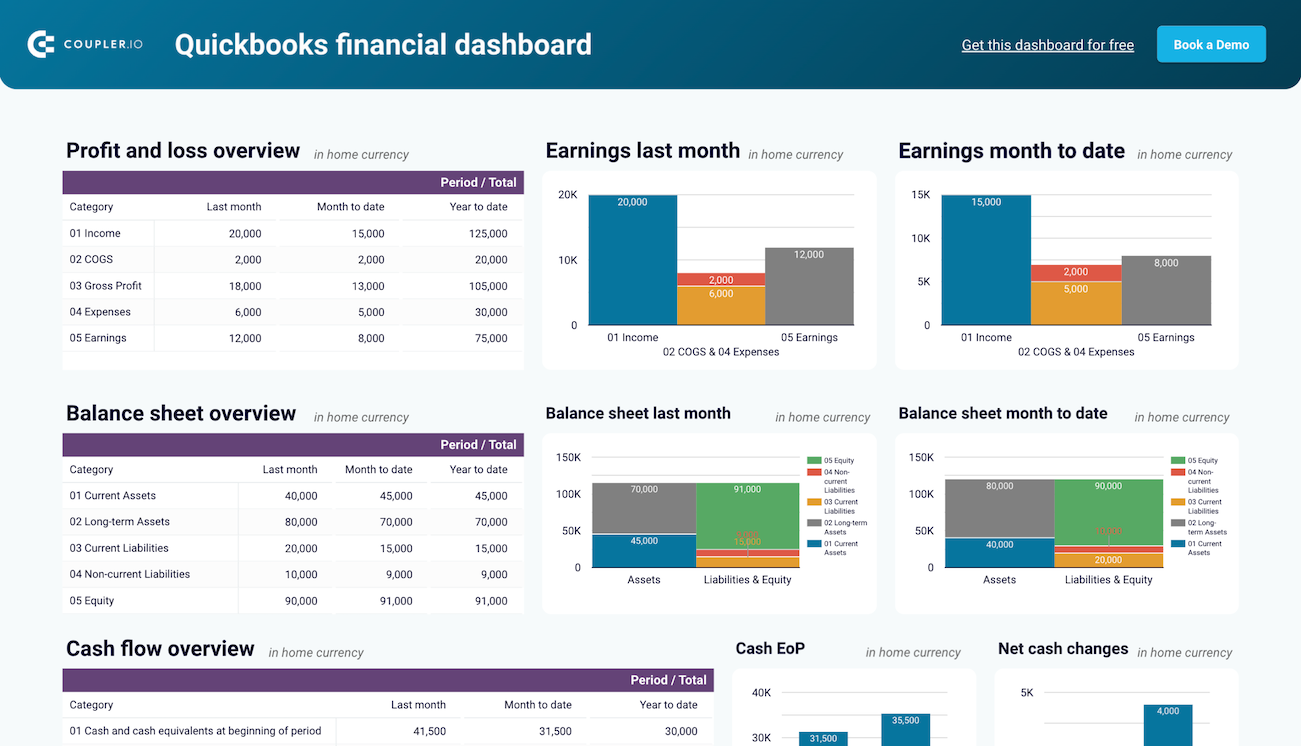
QuickBooks financial dashboard
Tracks earnings, monitor cash flow, and analyze balance sheet changes with a dedicated dashboard that provides a clear picture of your business finances.
QuickBooks financial dashboard in Looker Studio
Monitor and analyze your business’s financial health with real-time insights into profit and loss, balance sheet, cash flow, and bank & cash accounts.
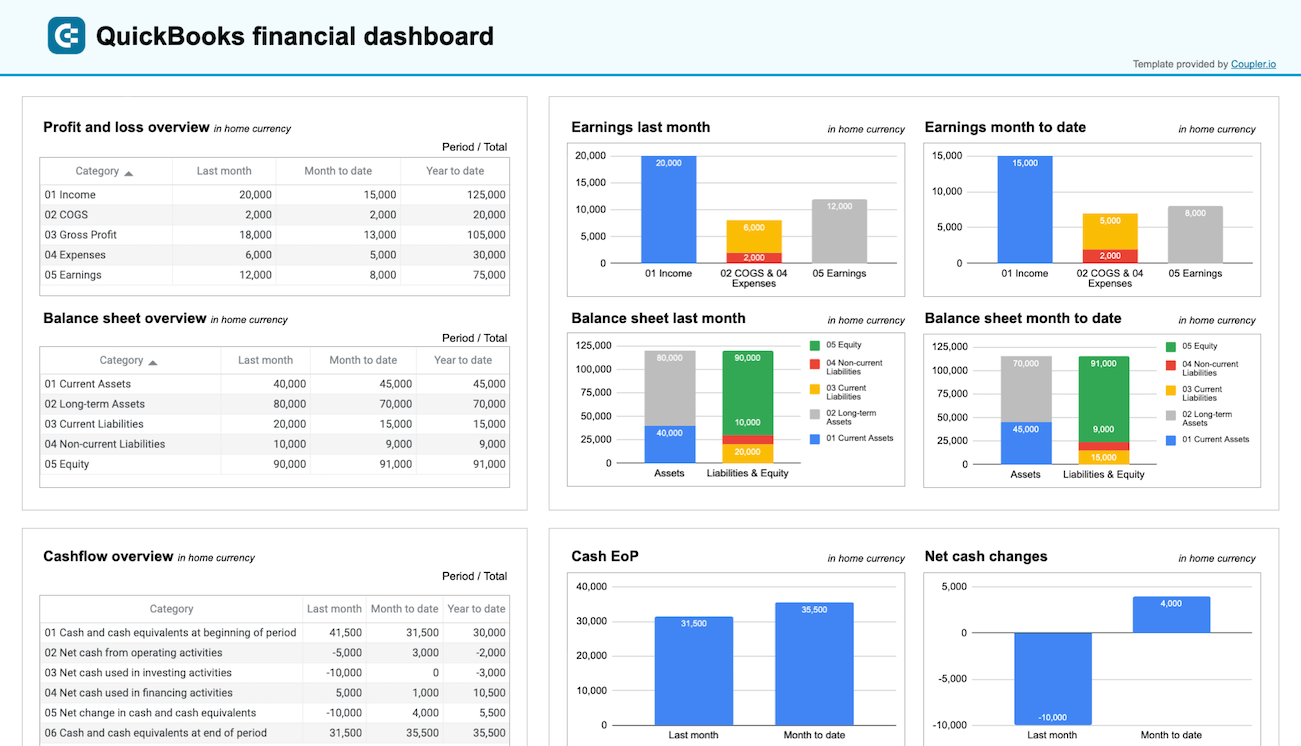
QuickBooks financial dashboard in Google Sheets
Get a clear snapshot of your business finances, including cash flow, P&L, balance sheets, and bank accounts, powered by data from QuickBooks Online.
List of metrics:
- Income
- Earnings
- Assets
- Liabilities and equity
- Cash balance
- Currency
- Net cash changes
Template rating
| Usability | ????? |
| Design | ????? |
| Customization | ???? |
| Accuracy | ????? |
| Integration | ????? |
| Availability | Free |
Sales pipeline analysis report templates
These report templates allow you to conduct a detailed analysis of your sales pipeline, thanks to special visualization features and a handy set of filters.
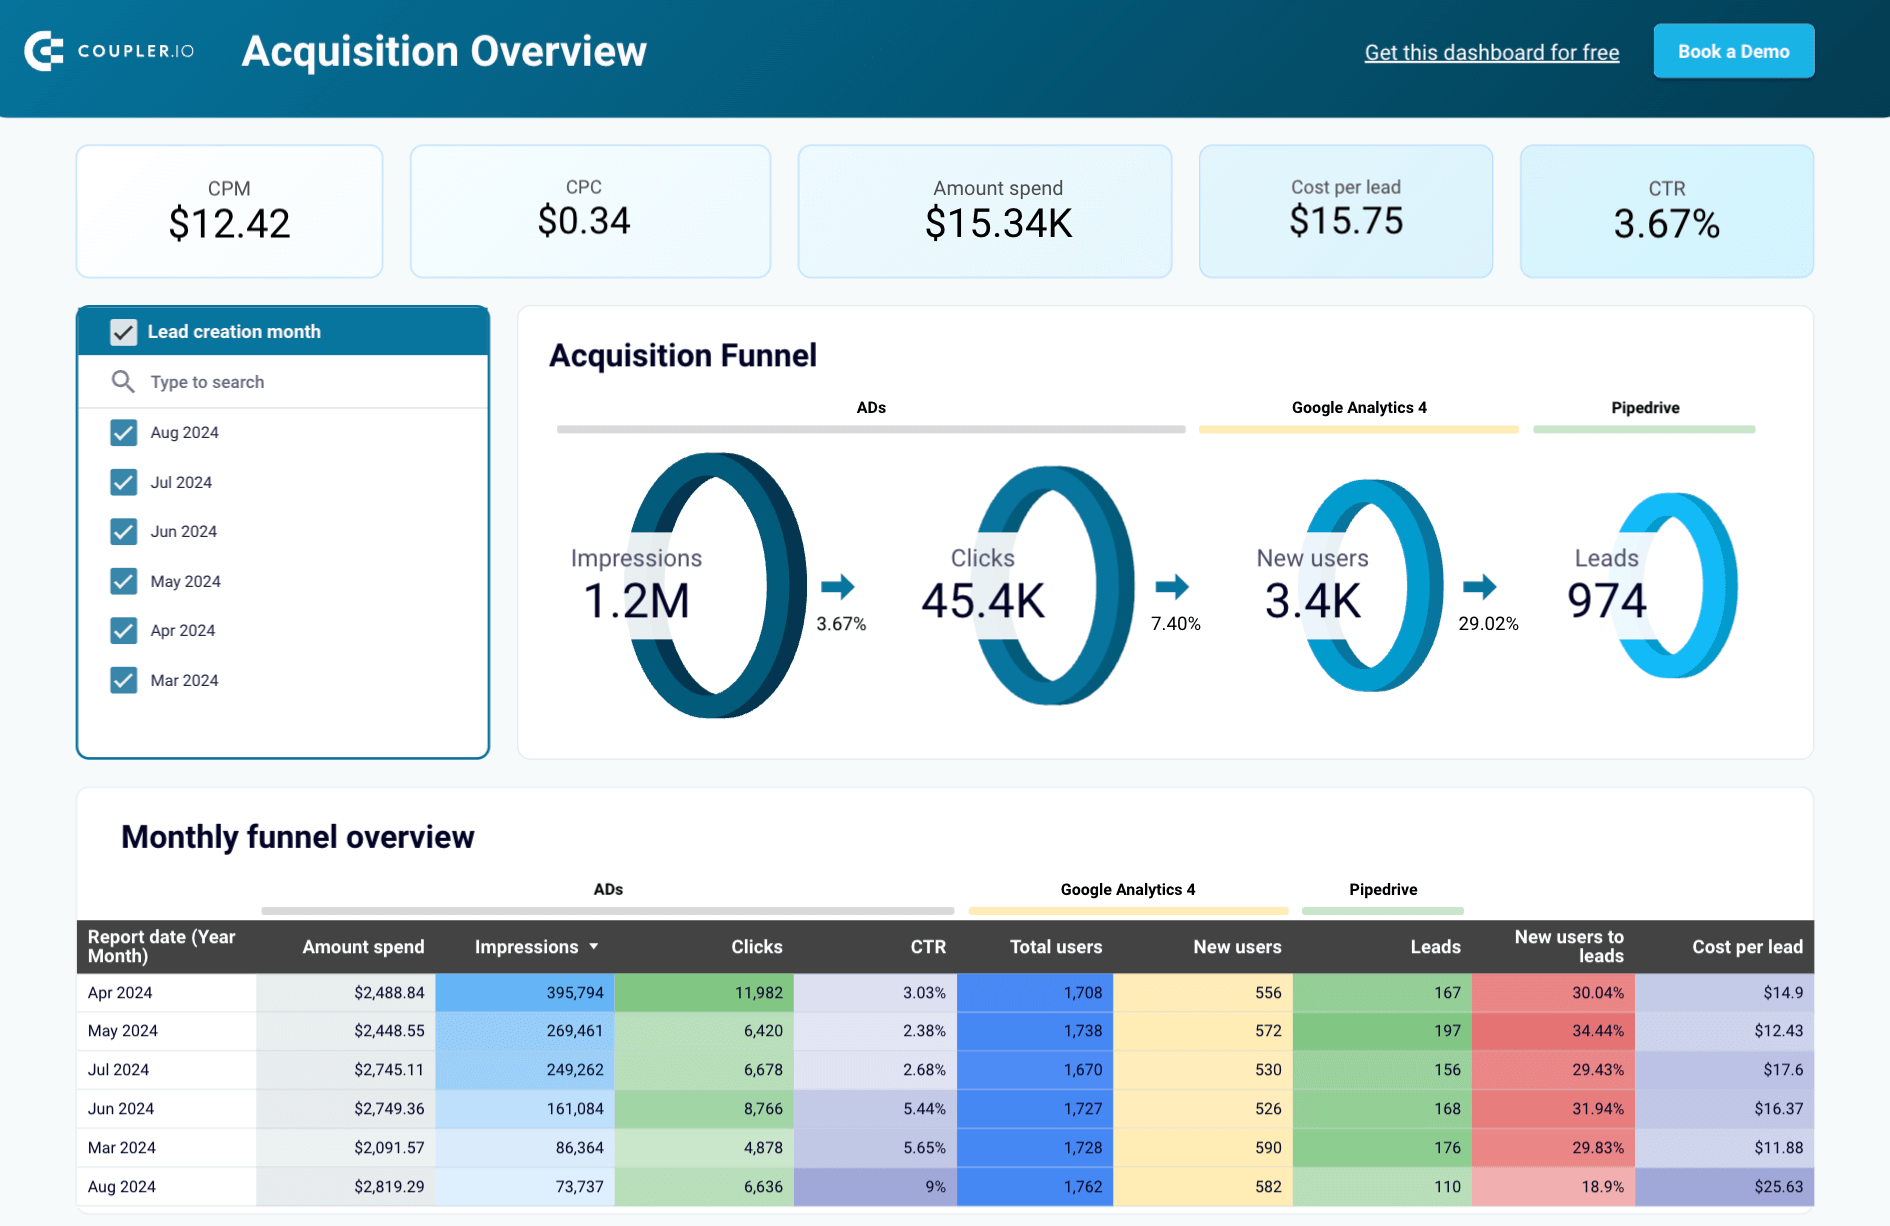
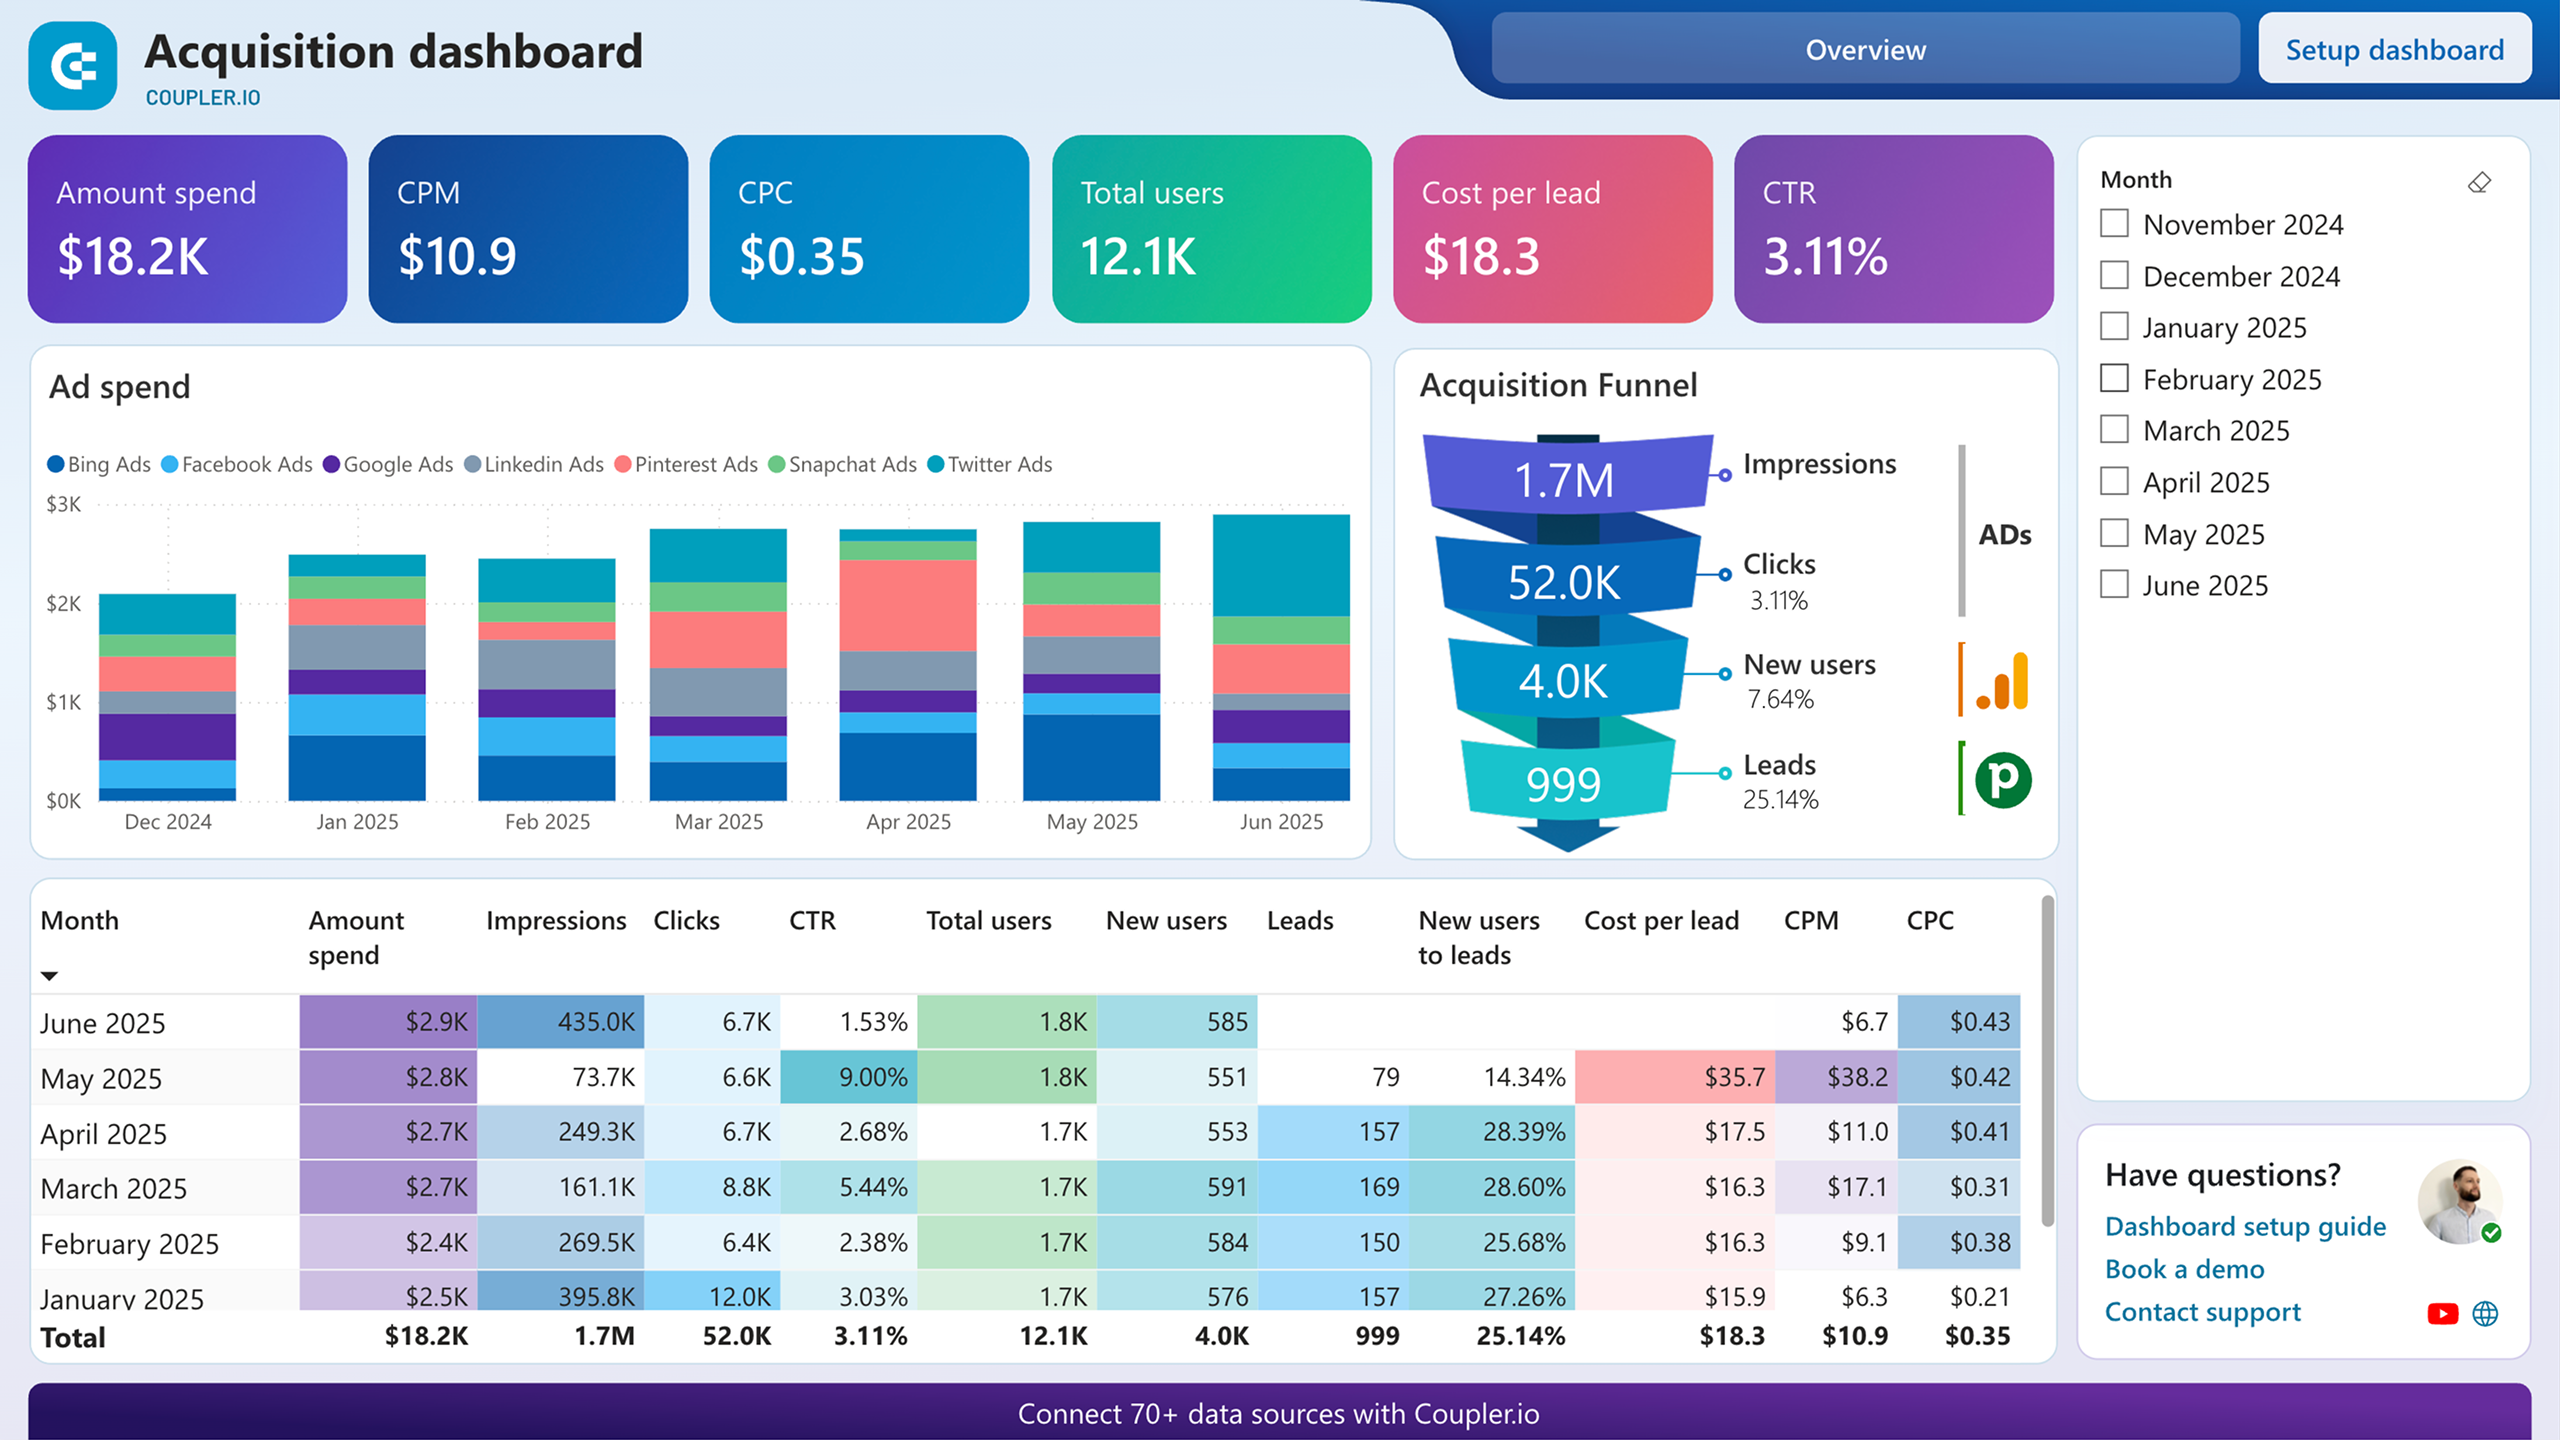
11. Customer acquisition report template for Pipedrive in Looker Studio
This report template combines Pipedrive data with marketing data from GA4 and all major ad platforms such as Facebook Ads, Linkedin Ads, and Google Ads. You can analyze the acquisition funnel to understand how efficiently your team converts sales prospects into customers.
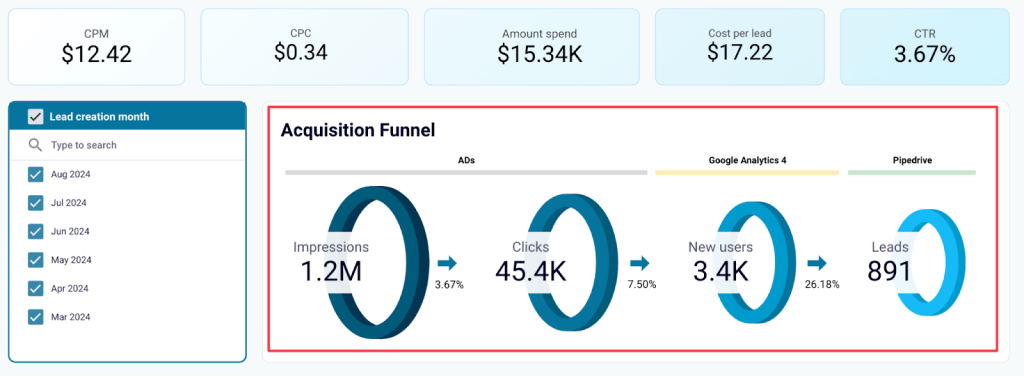
More specifically, you can use the funnel visualization to assess:
- How many impressions/clicks your marketing ads generated
- How many users made it to your website
- How many warm leads landed in your Pipedrive system.
Leverage historical data to build sales forecasts for future ad investments. For example, predict the number of leads you could generate by doubling your ad spend. There is also the option to track funnel performance changes month by month. This can help you uncover correlations with marketing and sales lead-generation activities.
This template is available for free in Looker Studio. Follow the steps within the preview to get a copy for yourself:
List of metrics:
- Leads
- Impressions
- Clicks
- CPM, CPC, CTR
- Amount spend
- Cost per lead
- New users
- New users to leads
- Conversion rate
Template rating
| Usability | ????? |
| Design | ????? |
| Customization | ???? |
| Accuracy | ????? |
| Integration | ????? |
| Availability | Free |
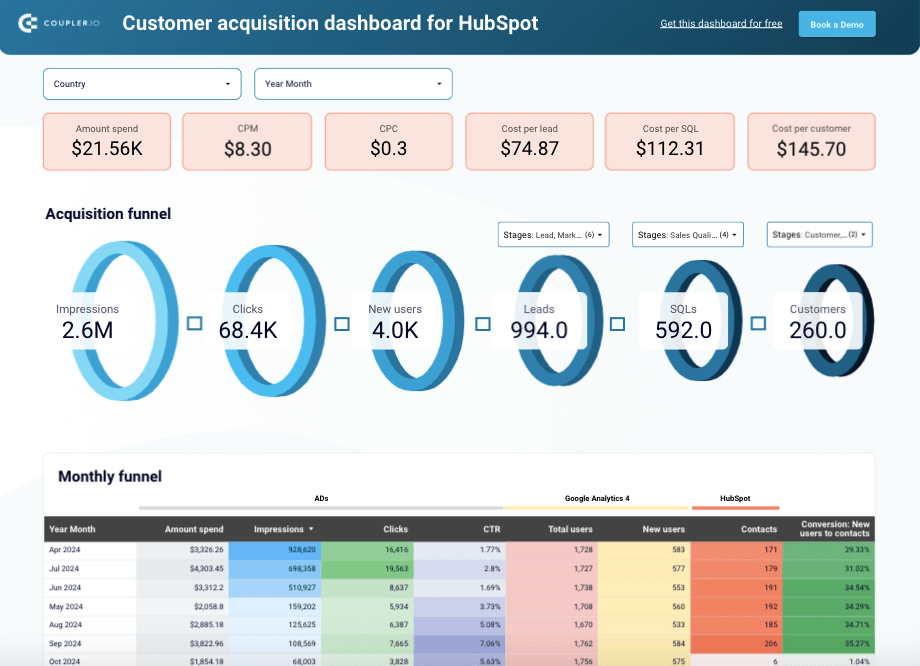
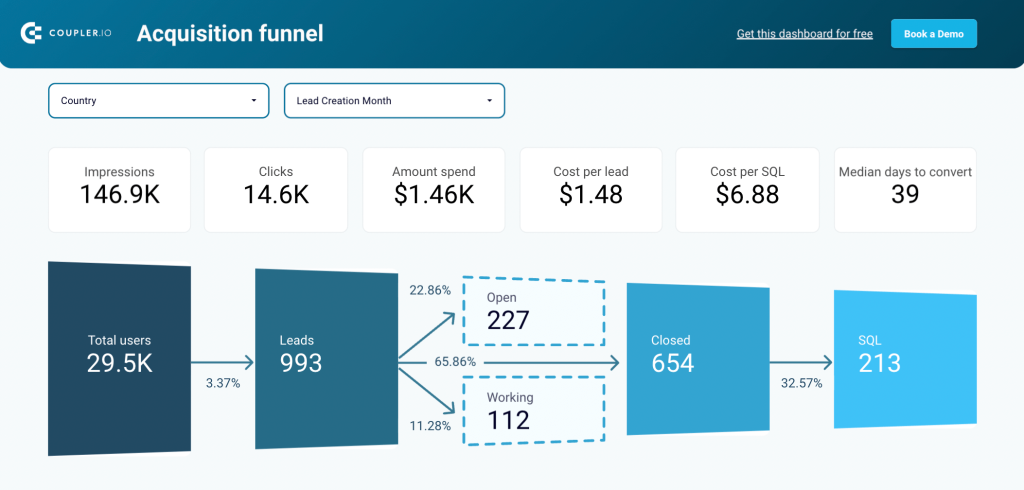
12. Customer acquisition report template for HubSpot/Pipedrive
Much like the previous template, this customer acquisition dashboard combines sales pipeline and GA4 data with data from your favorite ad platforms (Facebook Ads, Google Ads, etc.).
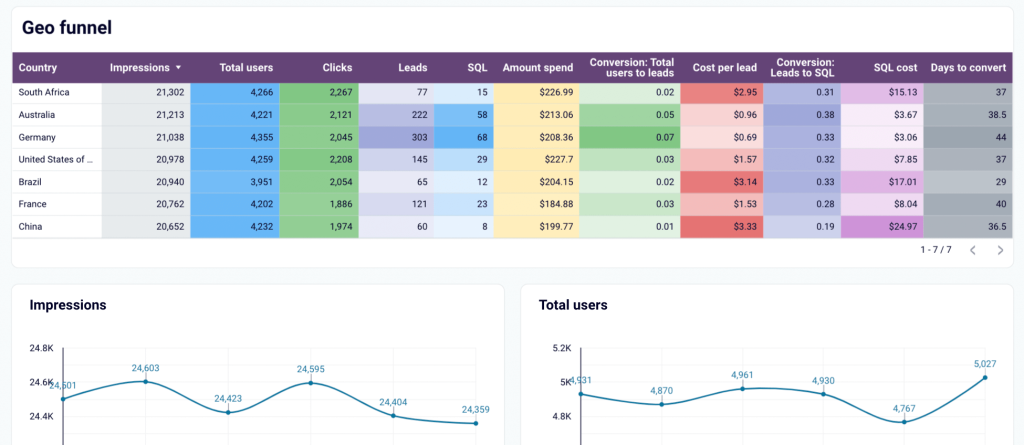
The template has a 6-stage acquisition funnel for analyzing your sales pipeline. With metrics like SQL, Cost per SQL, and Customers, you can evaluate pipeline efficiency, pinpoint areas for improvement, and ultimately optimize conversion rates.
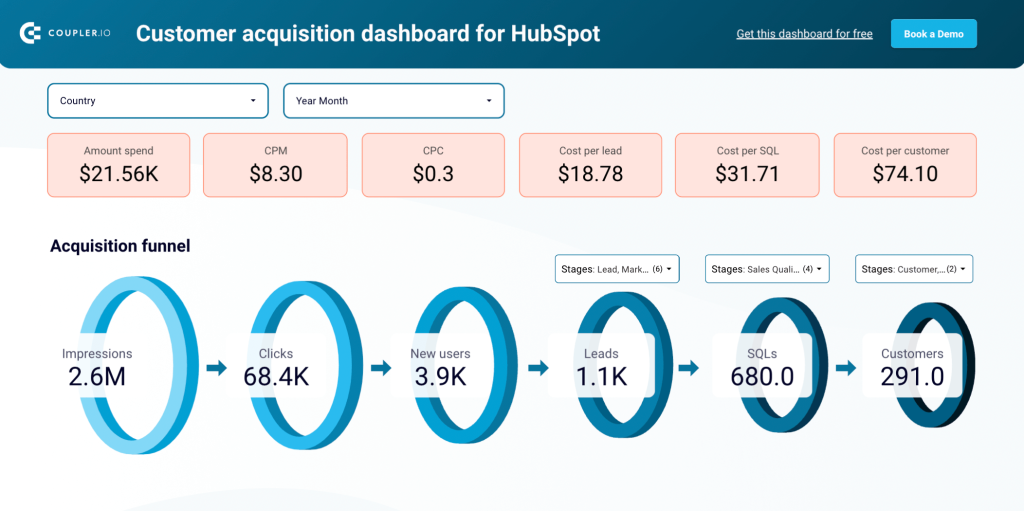
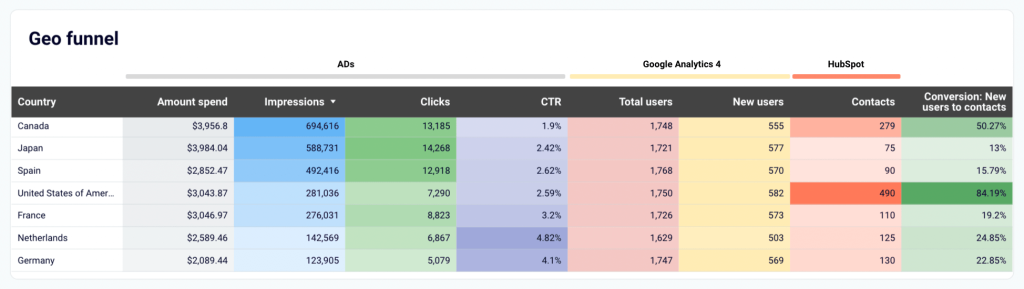
There is also a geo funnel that lets you track key performance indicators such as amount spend, CTR, and conversions by country. This can help you identify high-performing regions and refine the targeting of your sales and marketing campaigns.
The Looker Studio template is available for both HubSpot and Pipedrive CRM apps. For the latter, there is also a Power BI version. All of them are equipped with Coupler.io to automate data flow.
Customer acquisition dashboard for HubSpot in Looker Studio
Monitor your acquisition funnel and analyze its effectiveness using the insights from HubSpot CRM, advertising platforms, and Google Analytics 4.

Customer acquisition dashboard for Pipedrive in Looker Studio
Use one dashboard to analyze the effectiveness of your Pipedrive acquisition funnel. Gain insights from data sourced from ad platforms and Google Analytics 4.
Customer acquisition dashboard for Pipedrive in Power BI
Visualize your complete lead generation funnel from initial ad impressions through CRM conversions, enabling data-driven decisions to improve acquisition costs and conversion rates.


List of metrics:
- Leads
- Impressions
- Clicks
- CPM, CPC, CTR
- Amount spend
- Cost per lead
- SQL
- Cost per SQL
- Contacts
- New users
- New users to leads
- Customers
- Conversion rate
Template rating
| Usability | ????? |
| Design | ????? |
| Customization | ???? |
| Accuracy | ????? |
| Integration | ????? |
| Availability | Free |
13. Salesforce sales analytics report template in Looker Studio
This dashboard aggregates data from Salesforce and major advertising platforms to attribute leads and revenue to specific marketing channels. It has a visualized sales funnel built on data from Salesforce and GA4. You can use it to assess the effectiveness of generated traffic (Total users) by comparing conversion rates with your industry benchmark.
You can apply filters by country to identify the most effective regions in terms of lead generation or conversion rates. For example, if you have a high number of leads from France but low conversion rates, the issue could be related to language barriers or shipping options.
Like the other templates in this selection, the dashboard comes with monthly and geo funnels, as well as charts for analyzing individual performance metrics (leads, SQL, conversion rates, etc.). You can use these tools to track sales trends over time and make data-driven optimizations to your pipeline.
Again, it only takes a few minutes to grab a copy of this free Looker Studio template for your team. Simply sign up for Coupler.io and follow the instructions within the dashboard view:
List of metrics:
- Total users
- Impressions
- Clicks
- Leads (open, working, closed)
- Cost per lead
- SQL
- SQL cost
- Spend amount (by country, ad source)
- Conversion rate
- Cost per conversion
- Days to convert
Template rating
| Usability | ????? |
| Design | ????? |
| Customization | ???? |
| Accuracy | ????? |
| Integration | ????? |
| Availability | Free |
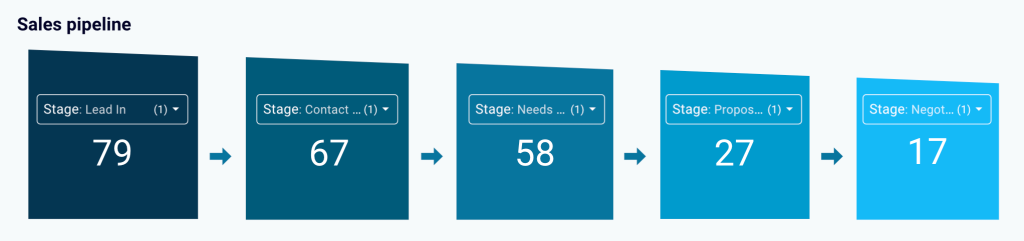
14. Sales pipeline report template in Power BI
This template built by Power BI provides a clear visualization of the sales funnel, describing sales stages from lead to won. It allows sales teams to identify potential areas for improvement and optimize the flow of opportunities through each stage.
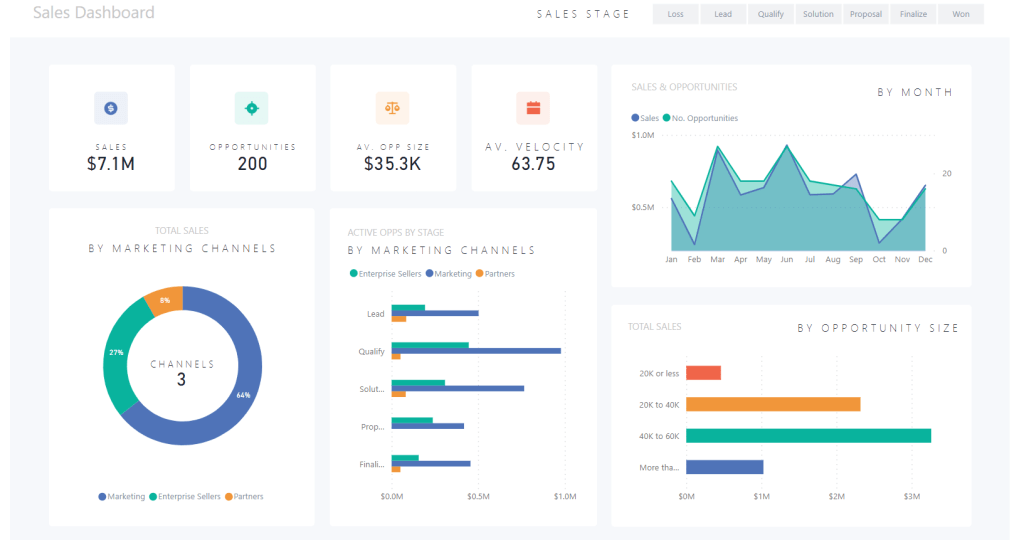
By tracking sales stages and opportunities, you can also conduct an efficient churn rate analysis and uncover methods to improve retention. The template also comes with total sales by marketing channel metrics, allowing teams to gain actionable insights from their marketing campaigns and boost lead generation.
List of metrics:
- Sales stages (loss, lead, qualify, solution, proposal, finalize, won)
- Sales and opportunities by month
- Total sales by opportunity size
- Total sales by marketing channels
- Average opportunity size and velocity
Template rating
| Usability | ???? |
| Design | ???? |
| Customization | ??? |
| Accuracy | ???? |
| Integration | ? |
| Availability | Free |
Other sales report templates
Here are a few other types of sales report templates you and your team may find useful:
15. Calendly event dashboard in Looker Studio
This template allows you to visualize and track Calendly event data in Looker Studio. You can monitor sales-related events scheduled through Calendly and get an overview of the total number of events, their duration, and popular time slots. Sales teams can leverage this data to optimize their schedules and ensure efficient time management.
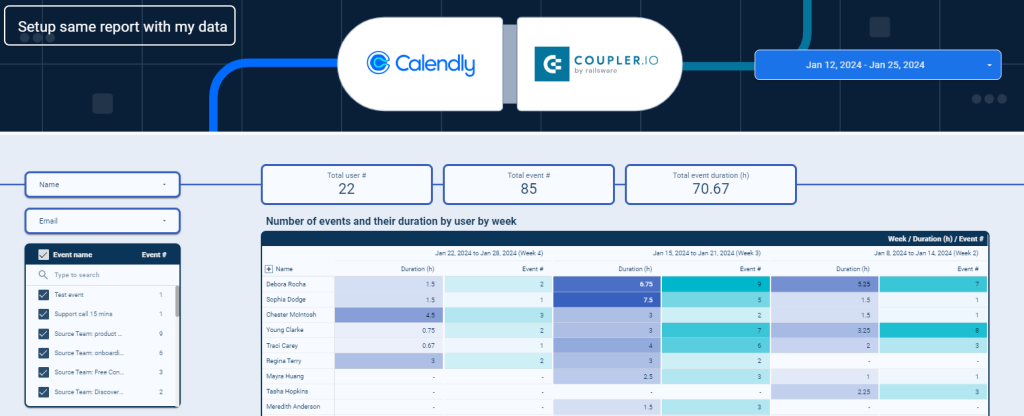
By identifying peak time slots and event durations, your team can align availability with customer preferences to enhance overall productivity. This data-driven approach also enables you to schedule events with times that yield the highest engagement, improving the chances of successful interactions.
List of metrics:
- Total user
- Total event
- Total event duration
- Number of events and duration by time period and user
- Event status
- Popular time slots by day, week, month, and year
Template rating
| Usability | ????? |
| Design | ????? |
| Customization | ???? |
| Accuracy | ????? |
| Integration | ????? |
| Availability | Free |
16. Daily sales report template in Excel
This sales reporting template is best for tracking and analyzing day-to-day sales performance. It provides a simple breakdown of daily transactions, including item number, name, description, price, quantity, amount, tax, and sales total.
The details enable sales teams to track individual sales for a thorough understanding of product performance and revenue generation.
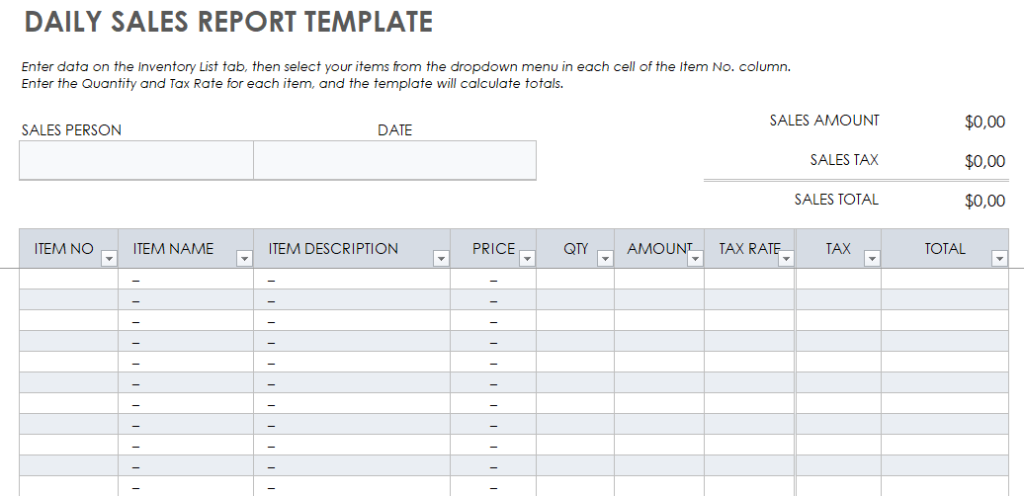
The tax-related metrics also help automate calculations to minimize errors and provide accurate financial insights to simplify the daily calculation process.
The sales report template in Excel allows for easy customization and additional data analysis. Sales teams can adapt the report to their specific needs by adding new metrics or modifying existing ones.
Metrics display
- Item number name, description
- Pricing
- Quantity
- Sales amount
- Tax and tax rate
- Sales total
Template rating
| Usability | ???? |
| Design | ??? |
| Customization | ???? |
| Accuracy | ???? |
| Integration | ? |
| Availability | Free |
17. Weekly sales report template in Tableau
This weekly sales reporting template in Tableau offers a holistic margin analysis using advanced visualization. It allows sales team to analyze gross margin data comprehensively by using metrics like gross margin, price, and volume on different categories such as country, sales channel, and product type.
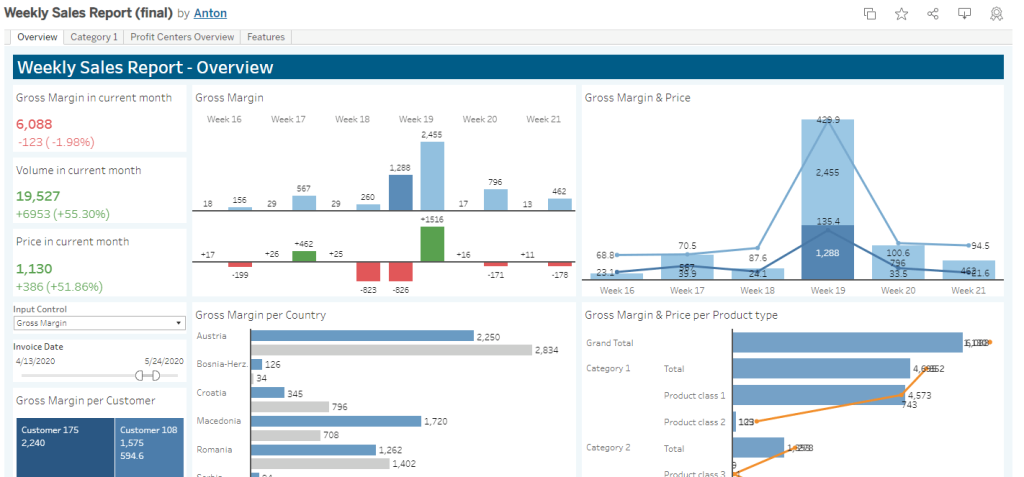
This segmentation sheds light on the factors influencing gross margin, which can help sales managers identify high-performing segments, pinpoint areas for improvement, and tailor sales strategies to specific market dynamics.
List of metrics
- Gross margin
- Gross margin and price
- Gross margin in current month
- Volume in current month
- Gross margin per country, customer, brand, sales channel, and product type
Template rating
| Usability | ???? |
| Design | ??? |
| Customization | ??? |
| Accuracy | ???? |
| Integration | ? |
| Availability | Free |
18. Monthly sales report template in Google Sheets or Excel
This report template by HubSpot shows a snapshot of the current month’s stats, including new accounts and monthly recurring revenue. The template comes with a clear instruction and five tabs to gather comprehensive sales data.
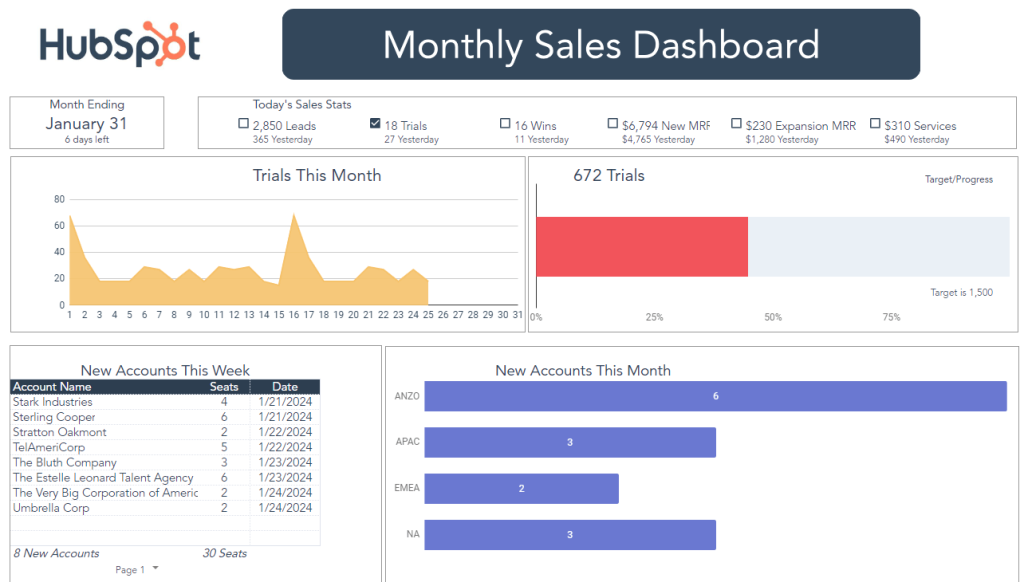
On the dashboard, users can see stats for today in comparison with the day before, as well as results for the entire month. The monthly sales reporting template also shows progress towards the monthly target, allowing teams to adjust their sales strategy before the month ends.
List of metrics:
- Today’s sales stats, including leads, trials, wins, services, and monthly recurring revenue
- Weekly and monthly new accounts
- Monthly recurring revenue by region
Template rating
| Usability | ??? |
| Design | ??? |
| Customization | ??? |
| Accuracy | ???? |
| Integration | ? |
| Availability | Free |
19. Quarterly sales report template in Excel
This quarterly sales report template streamlines the sales process by providing a comprehensive view of contacts in the pipeline, conversion rates, and actual sales against quotas. From here, sales teams can identify strengths and weaknesses in the process and make informed adjustments to the strategy.
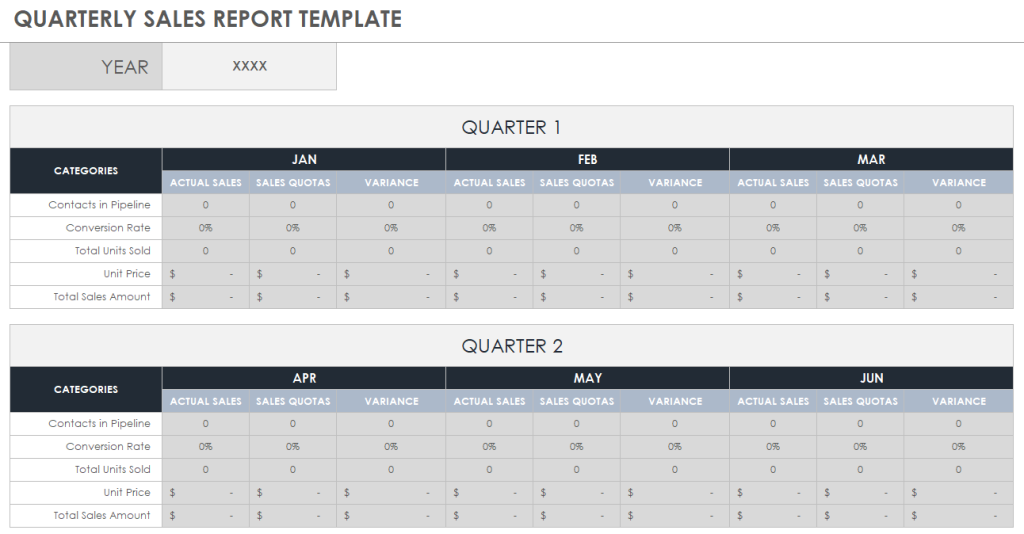
The template also improves sales forecast accuracy by providing insight into total units sold, unit price, and total sales amount. Team members can make predictions based on historical data to reliably forecast results in future quarters.
Sales reporting templates like these can be well-suited for small businesses as they provide a cost-effective solution for tracking contacts and analyzing quarterly sales performance.
List of metrics:
- Actual sales
- Sales quotas
- Conversion rate
- Total units sold
- Total sales amount
- Annual total
- Actual unit sales vs sales quota
Template rating
| Usability | ???? |
| Design | ???? |
| Customization | ???? |
| Accuracy | ???? |
| Integration | ? |
| Availability | Free |
20. Annual sales report template in Excel
This sales reporting template provides a holistic yearly snapshot. It offers detailed insights into product statistics, sales rep statistics, regional actuals, and product revenue comparisons. The template enhances sales operations by presenting key metrics in both charts and tables, allowing sales teams to easily visualize and analyze data.
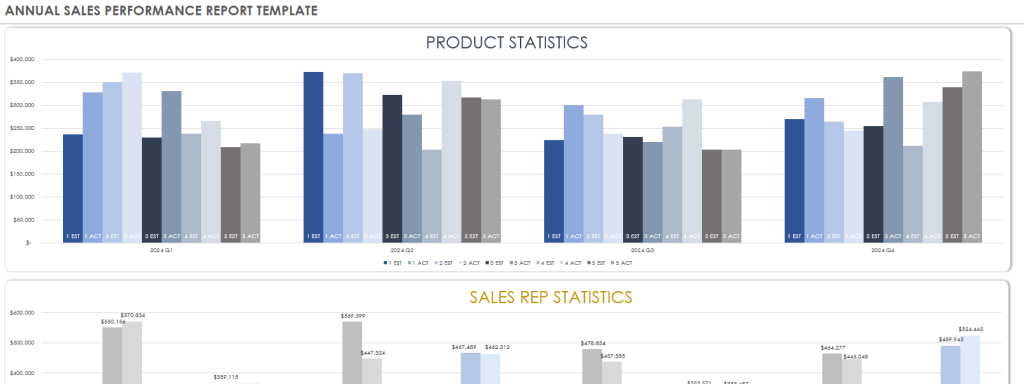
Through product revenue comparisons and regional actuals, the dashboard helps you develop an in-depth understanding of the sales cycle. You can track the progress of products throughout the year, optimizing their approach in each cycle stage.
List of metrics:
- Product statistics
- Sales rep statistics
- Regional actual
- Estimate vs. actual product revenue
Template rating
| Usability | ??? |
| Design | ??? |
| Customization | ???? |
| Accuracy | ???? |
| Integration | ? |
| Availability | Free |
21. Sales call report template in Excel
It helps streamline your workflow by providing a structured format for documenting each sales call. Teams can easily input and retrieve information, ensuring a consistent approach to managing sales processes.
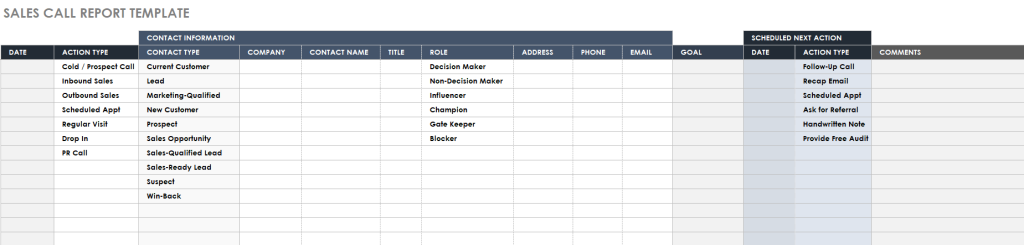
By recording action types, goals, and next action plans, the template becomes a valuable tool for developing targeted retention strategies and increasing customer lifetime value.
List of metrics:
- Action type
- Contact information (contact type, contact name, company, title, role, address, phone, email)
- Goal
- Scheduled next action (data, action type, comments)
Template rating
| Usability | ????? |
| Design | ???? |
| Customization | ???? |
| Accuracy | ???? |
| Integration | ? |
| Availability | Free |
22. Sales activity report template in Google Sheets or Excel
This sales activity report template provides a bird’s eye view of your sales performance. It includes critical metrics such as forecasted and won sales, revenue vs. target, closing percentage, and total won revenue. Sales teams can use it to refine strategy and keep track of expected forecasts.
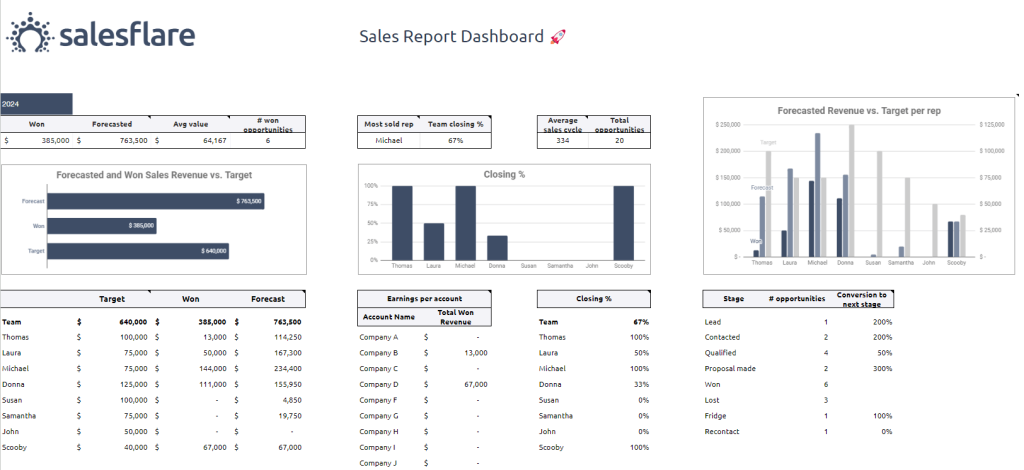
Metrics like average sales cycle and earnings per account help identify sales patterns and trends, allowing your team to make more informed decisions. The template also lets you analyze the individual performance of sales representatives. You can recognize high performers and provide targeted support to those with poorer results.
List of metrics:
- Forecasted and won sales revenue vs. target
- Closing percentage
- Most sold sales representatives
- Average sales cycle
- Total opportunities
- Earnings per account
- Total won revenue
- Forecasted revenue per quarter
Template rating
| Usability | ???? |
| Design | ??? |
| Customization | ??? |
| Accuracy | ???? |
| Integration | ? |
| Availability | Free |
23. Sales volume report template in WPS
This sales analysis report is a simple, ready-to-use tool for tracking and analyzing sales volumes. Sales teams can gain insights into sales volume by area and volume trends over the last and current year.
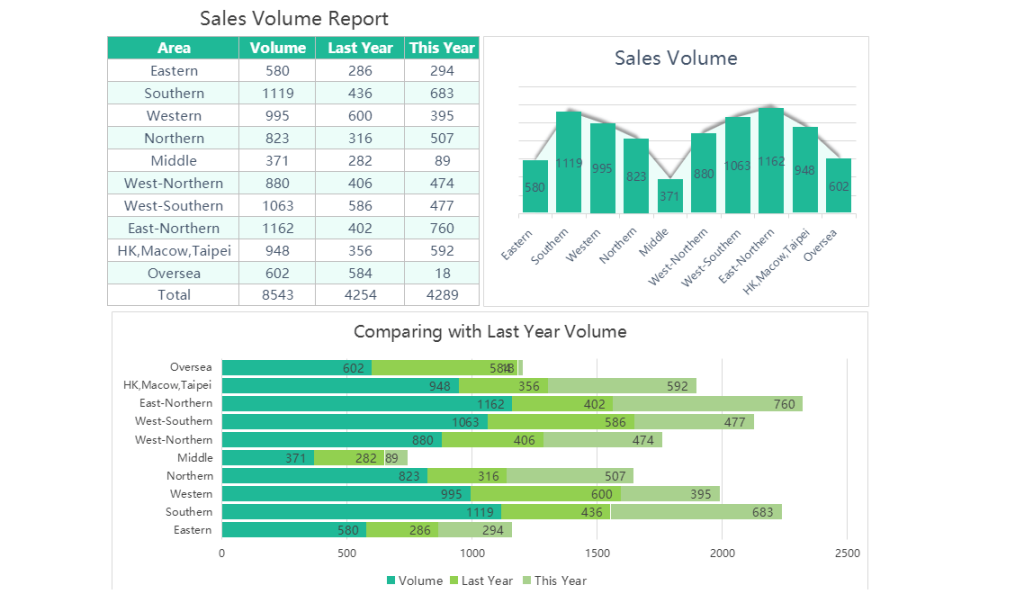
Metrics like sales volume by region can also help identify high-performing areas that may require additional focus. Additionally, the historical performance comparison helps teams understand trends and anticipate seasonal fluctuations to make informed decisions based on past performance.
List of metrics:
- Sales volume report (area, volume, last year, this year)
- Sales volume by region
- Comparison volume between this year vs. last year
Template rating
| Usability | ???? |
| Design | ??? |
| Customization | ??? |
| Accuracy | ???? |
| Integration | ? |
| Availability | Free |
What is a sales report template?
A sales report template is a pre-designed document that organizes key sales data for insightful analysis. It tracks essential information to help evaluate progress toward sales targets and establish benchmarks for success.
As seen on our list above, there are plenty of sales report templates to use for different scenarios. You can track your team’s individual sales, monthly customer acquisition, and many more.
Ultimately, these templates help make well-informed decisions to drive sales growth.
Benefits of using sales reporting templates
Sales report templates offer plenty of advantages for businesses seeking data-driven strategies. Here are some of the benefits of using them:
- Efficiency. Automate routine tasks and gain actionable insight on a regular basis.
- Clarity. Present complex sales data in a visually intuitive format, so performance indicators are easy to understand for decision-makers.
- Consistency. Offer consistent formats to maintain uniformity across various reporting periods or teams.
- Simplicity. Has user-friendly interfaces for easy performance report and data interpretation.
- Accuracy. Reduce the risk of errors for an effective sales report.
How to build a perfect sales report?
Building a perfect sales report involves a systematic approach. This ensures the report communicates the information and insights your team needs.
Here’s a simple step-by-step guide on how to create a comprehensive sales report:
- Define the purpose of the report. Understand the specific goals and objectives you aim to achieve with the sales report.
- Identify essential metrics. Common metrics include conversion rates, time periods, and sales growth.
- Select the right sales report template. Choose a suitable sales report template based on your requirements.
- Gather relevant data. Collect data from essential sources, this might be your CRM system, sales software, marketing tools, and financial records.
- Perform regular review. Consider scheduling regular reviews of the sales report to ensure relevance.
How to create a custom sales report
If you need a more customized solution than the above templates can offer, why not create your own report from scratch? With Coupler.io, it doesn’t take long to set up. Follow this step-by-step guide and have your sales report ready in less than 10 minutes.
First, sign up for a free Coupler.io account. Then go to the Importers tab on the main screen and click Add Importer to begin the set-up process.
1. Connect your sales data with Coupler.io
The next step is to determine which tool you want to visualize data from. For this tutorial, we’ll choose Pipedrive as the primary CRM and data source. Then proceed to the next step, where you can:
- Specify the source account and data entity you would like to export, such as leads. In the advanced settings, you can filter or list specific columns to refine the data.
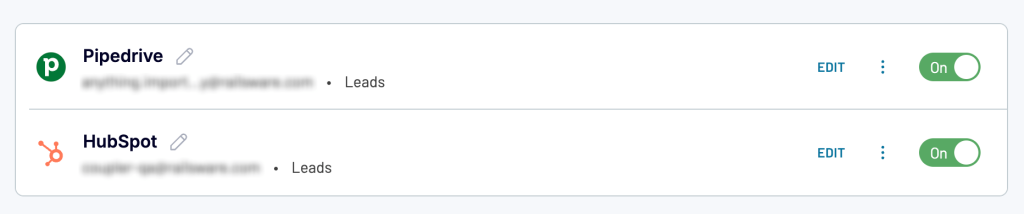
Once you click Finish and Proceed, you’ll see the option to add more sources to your report. Let’s say you also track lead data in HubSpot. In this case, you can add HubSpot as a source to visualize all of your data in one place. We’ll do that here to show you how it works.
- Choose HubSpot as a second source and specify the source account and data entity (leads), just like before.
- Use the optional advanced settings to make any exclusions or filter your data by time period. Then, click Finish and Proceed and move on the Transformations stage.
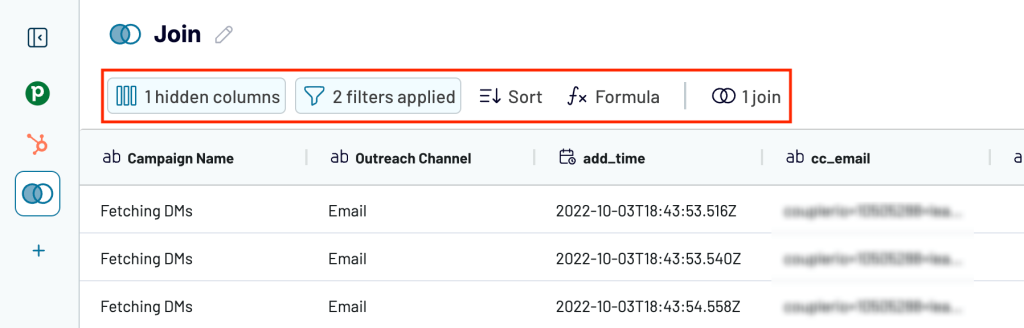
2. Organize and transform your data
This step allows you to make targeted fixes to your data before visualizing it in a dashboard. For instance, you can:
- Sort and filter your data
- Hide or rename columns
- Append or join data from multiple sales applications
The Join function is useful when you want to seamlessly merge data from two different apps, such as Pipedrive and HubSpot. It ensures that all fields in your lead data are logically consistent and not repeated.
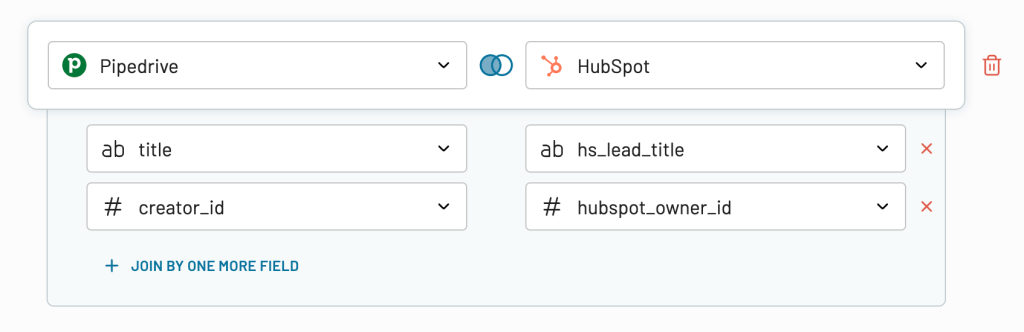
Once you have linked all of the fields, click Join data and proceed to the final step – Destinations.
3. Load data and schedule automated data refreshes
You also need to pick your preferred destination from the drop-down menu. We’ll go with Looker Studio here, as it has a low learning curve and it’s free to use. To finish setting up your sales report, simply:
- Confirm your data destination (Looker Studio, Tableau, etc.)
- Generate a dashboard in Looker Studio by following the authorization instructions in the external app.
- Return to your Coupler.io browser tab and schedule an automatic data refresh. For example, you can configure the interval (hourly, daily, weekly), time preference, timezone, and days of the week.
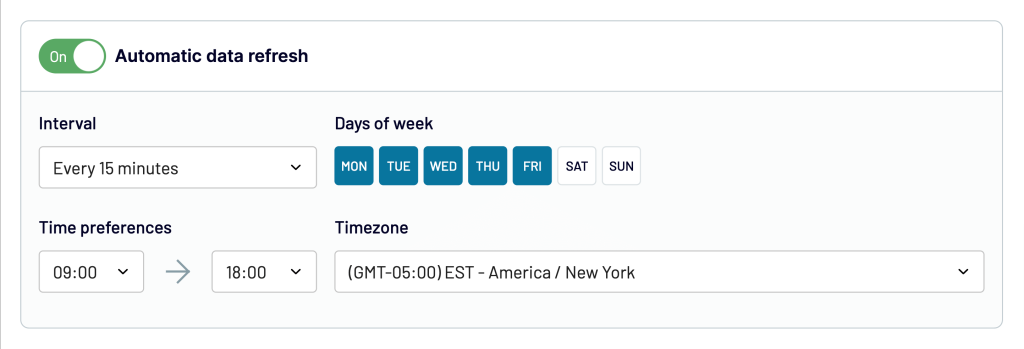
By default, the dashboard will be automatically updated every day. If you want a more frequent data refresh, choose the 15-minute refresh interval and make your dashboard update close to real-time!
After creating your first dashboard, you can access more ready-to-use dashboard options or create one from scratch by importing data from 60+ sources!
Automate sales reporting with Coupler.io
Get started for free