When it comes to visualizing data, you’ll find plenty of native Salesforce reports. However, they are static and only provide a deeper look at specific data at a specific time. They don’t update in real-time, and you’ll need to refer to different reports individually to gain insights into different aspects of your business.
This is why using interactive and dynamic Salesforce dashboards is a better option. They consolidate insights from multiple reports and display them in a single, comprehensive view. In this article, we have curated 13 dashboards for Salesforce to monitor and track your sales, marketing, and customer service.
Top 5 Salesforce dashboards available as templates
Let’s start by examining dashboards which are available as templates that you can reuse and customize according to your requirements. You can simply connect your Salesforce data to these templates and get your dashboard ready without any manual effort.
1. CRM analytics dashboard Salesforce by Coupler.io
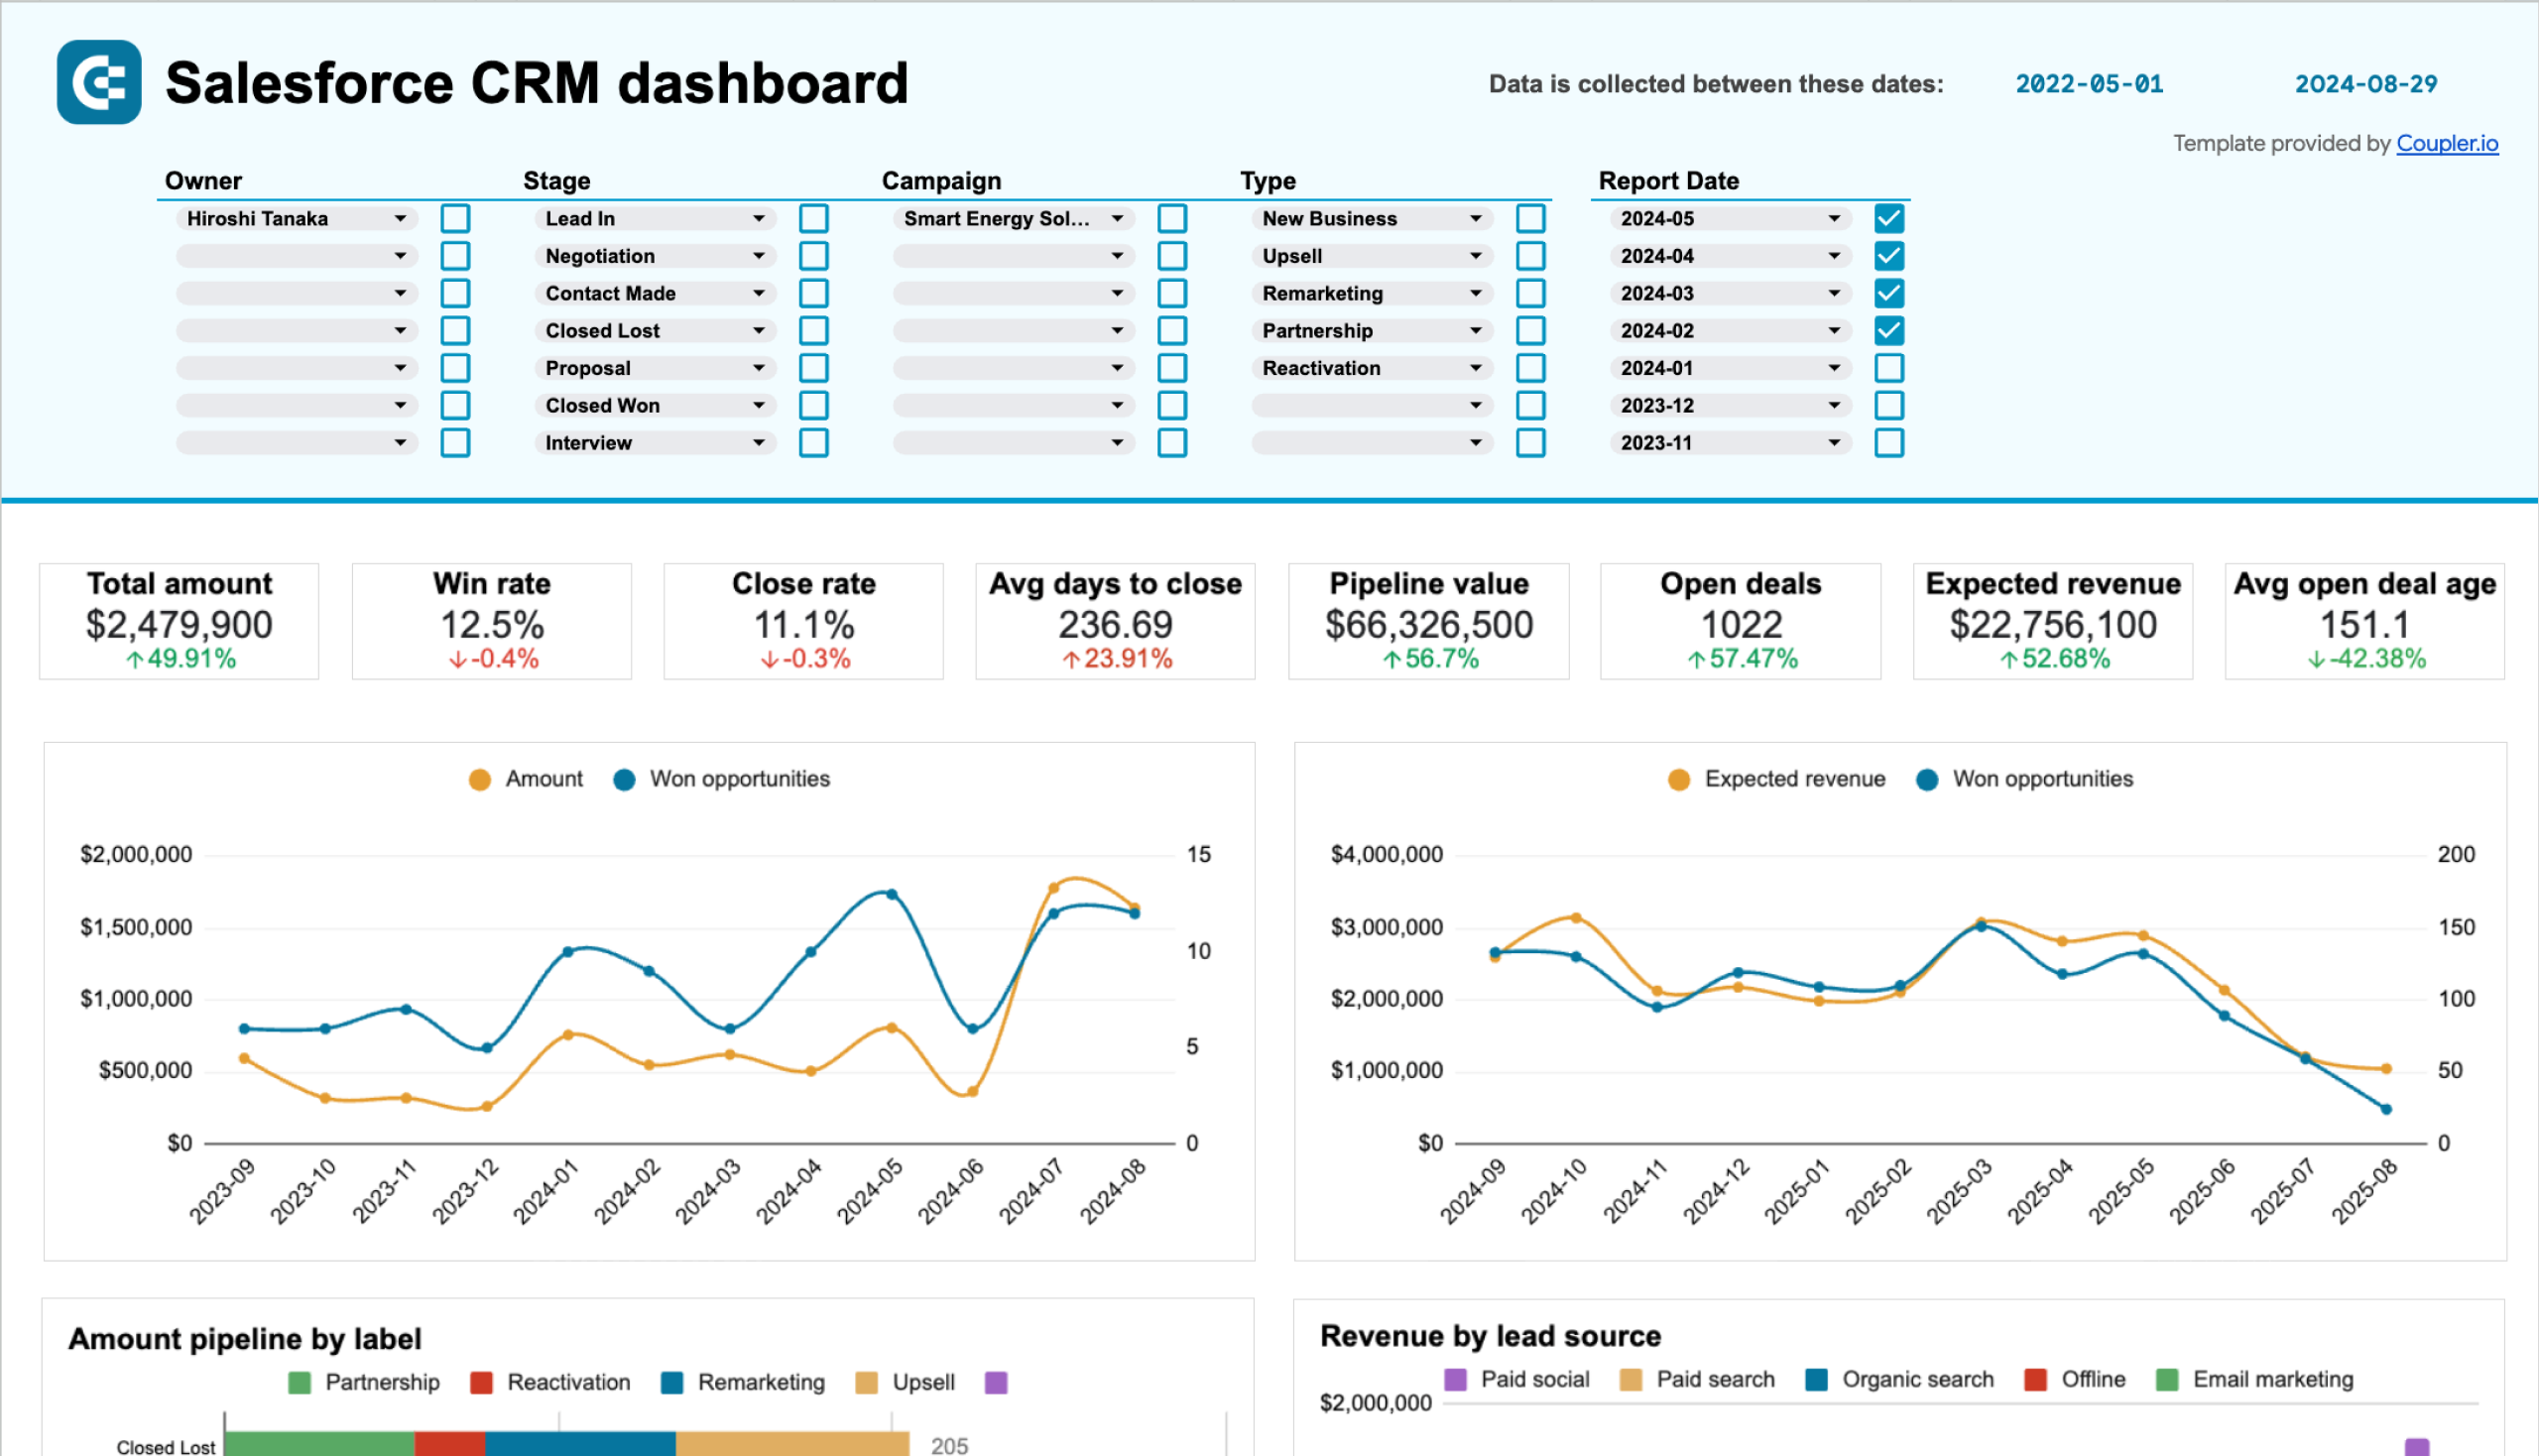
This CRM analytics dashboard template helps you identify and understand the factors driving your revenue. It provides an overview of customer relationships, sales activity, and business performance. This gives you a great way to visualize trends, detect opportunities, deliver lightning experiences to customers, and identify areas to adjust and improve.
Key dashboard insights
- Deal stages breakdown: Obtain a clear breakdown of deal stages, including the date when the deal was created, Contact made, Lead-in, Interview, Proposal, Negotiation, and Closed won.
- Revenue by lead source: View which channels, like email marketing, webinars, paid social, referrals, etc., were the most successful in delivering returns from the dashboard viewer.
- Top performers: See the top-performing sales reps and opportunities by looking at the quality and amount of deals they closed.
- Open opportunities: Find active deals and their details like owner, deal amount, stage, lead source, the campaign you run, closure probability, etc. This helps you track your deal’s status, prioritize high-ticket deals, and improve closure rates.
- Amount of opportunity type: Check the number of each opportunity type brought in.
In addition, the Salesforce sales dashboard will help you overview campaigns, accounts, owner comparison, closed amounts by country, and more.
How to use the dashboard template
You have two template options available – Looker Studio and Google Sheets. Both include Coupler.io’s Salesforce connector to enable automatic data integration. Choose either of them based on your needs and preferences.
Go to the Readme dashboard tab from the left panel to view the instructions. Follow them to connect your Salesforce account and start loading your data to the dashboard.
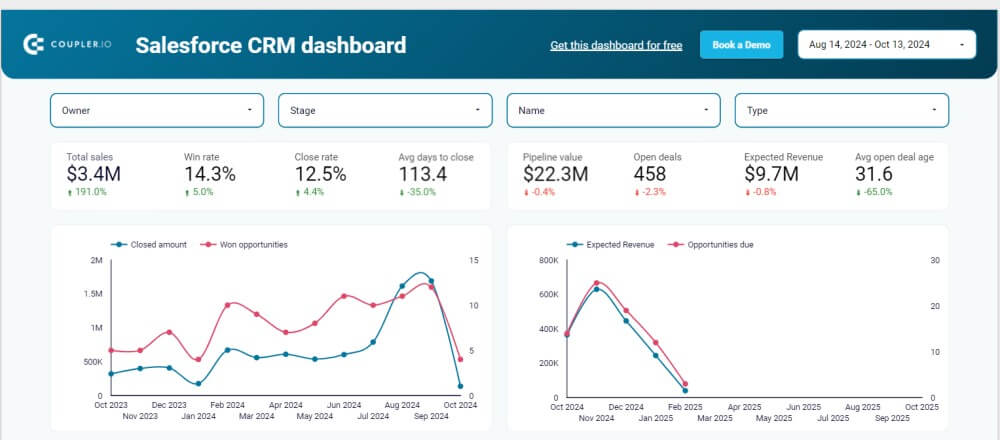
CRM dashboard for Salesforce in Looker Studio
Use our CRM dashboard for Salesforce to track key metrics, check how your sales team performs, and understand what drives your revenues.


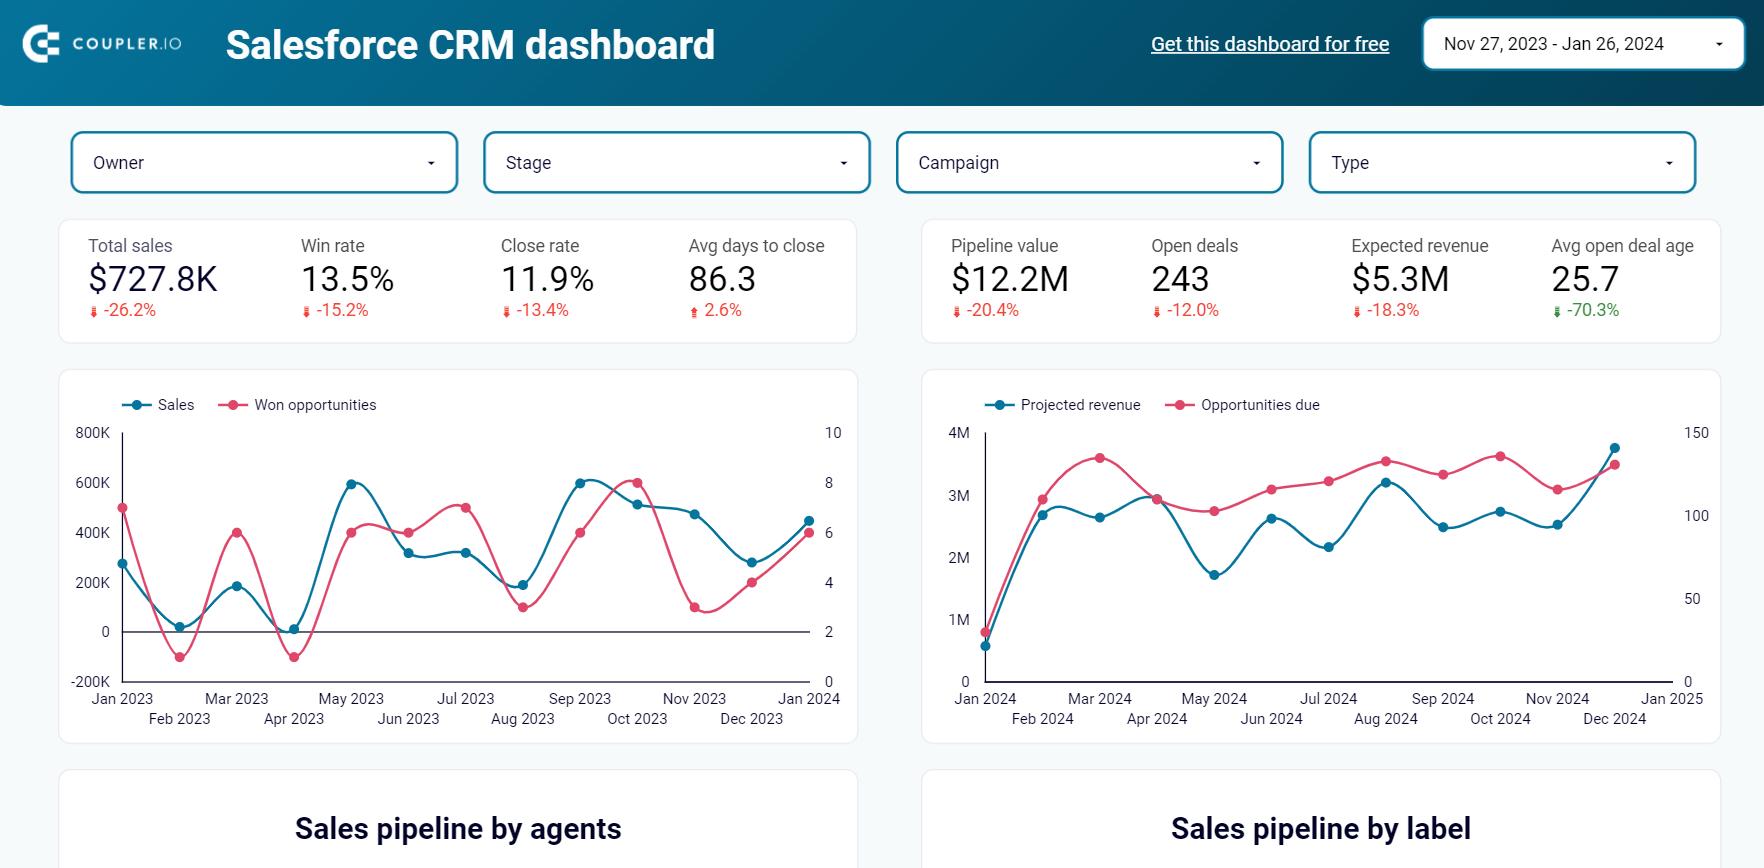
Salesforce CRM dashboard in Google Sheets
Get a detailed overview of your opportunities in Salesforce and analyze the performance of your sales team.

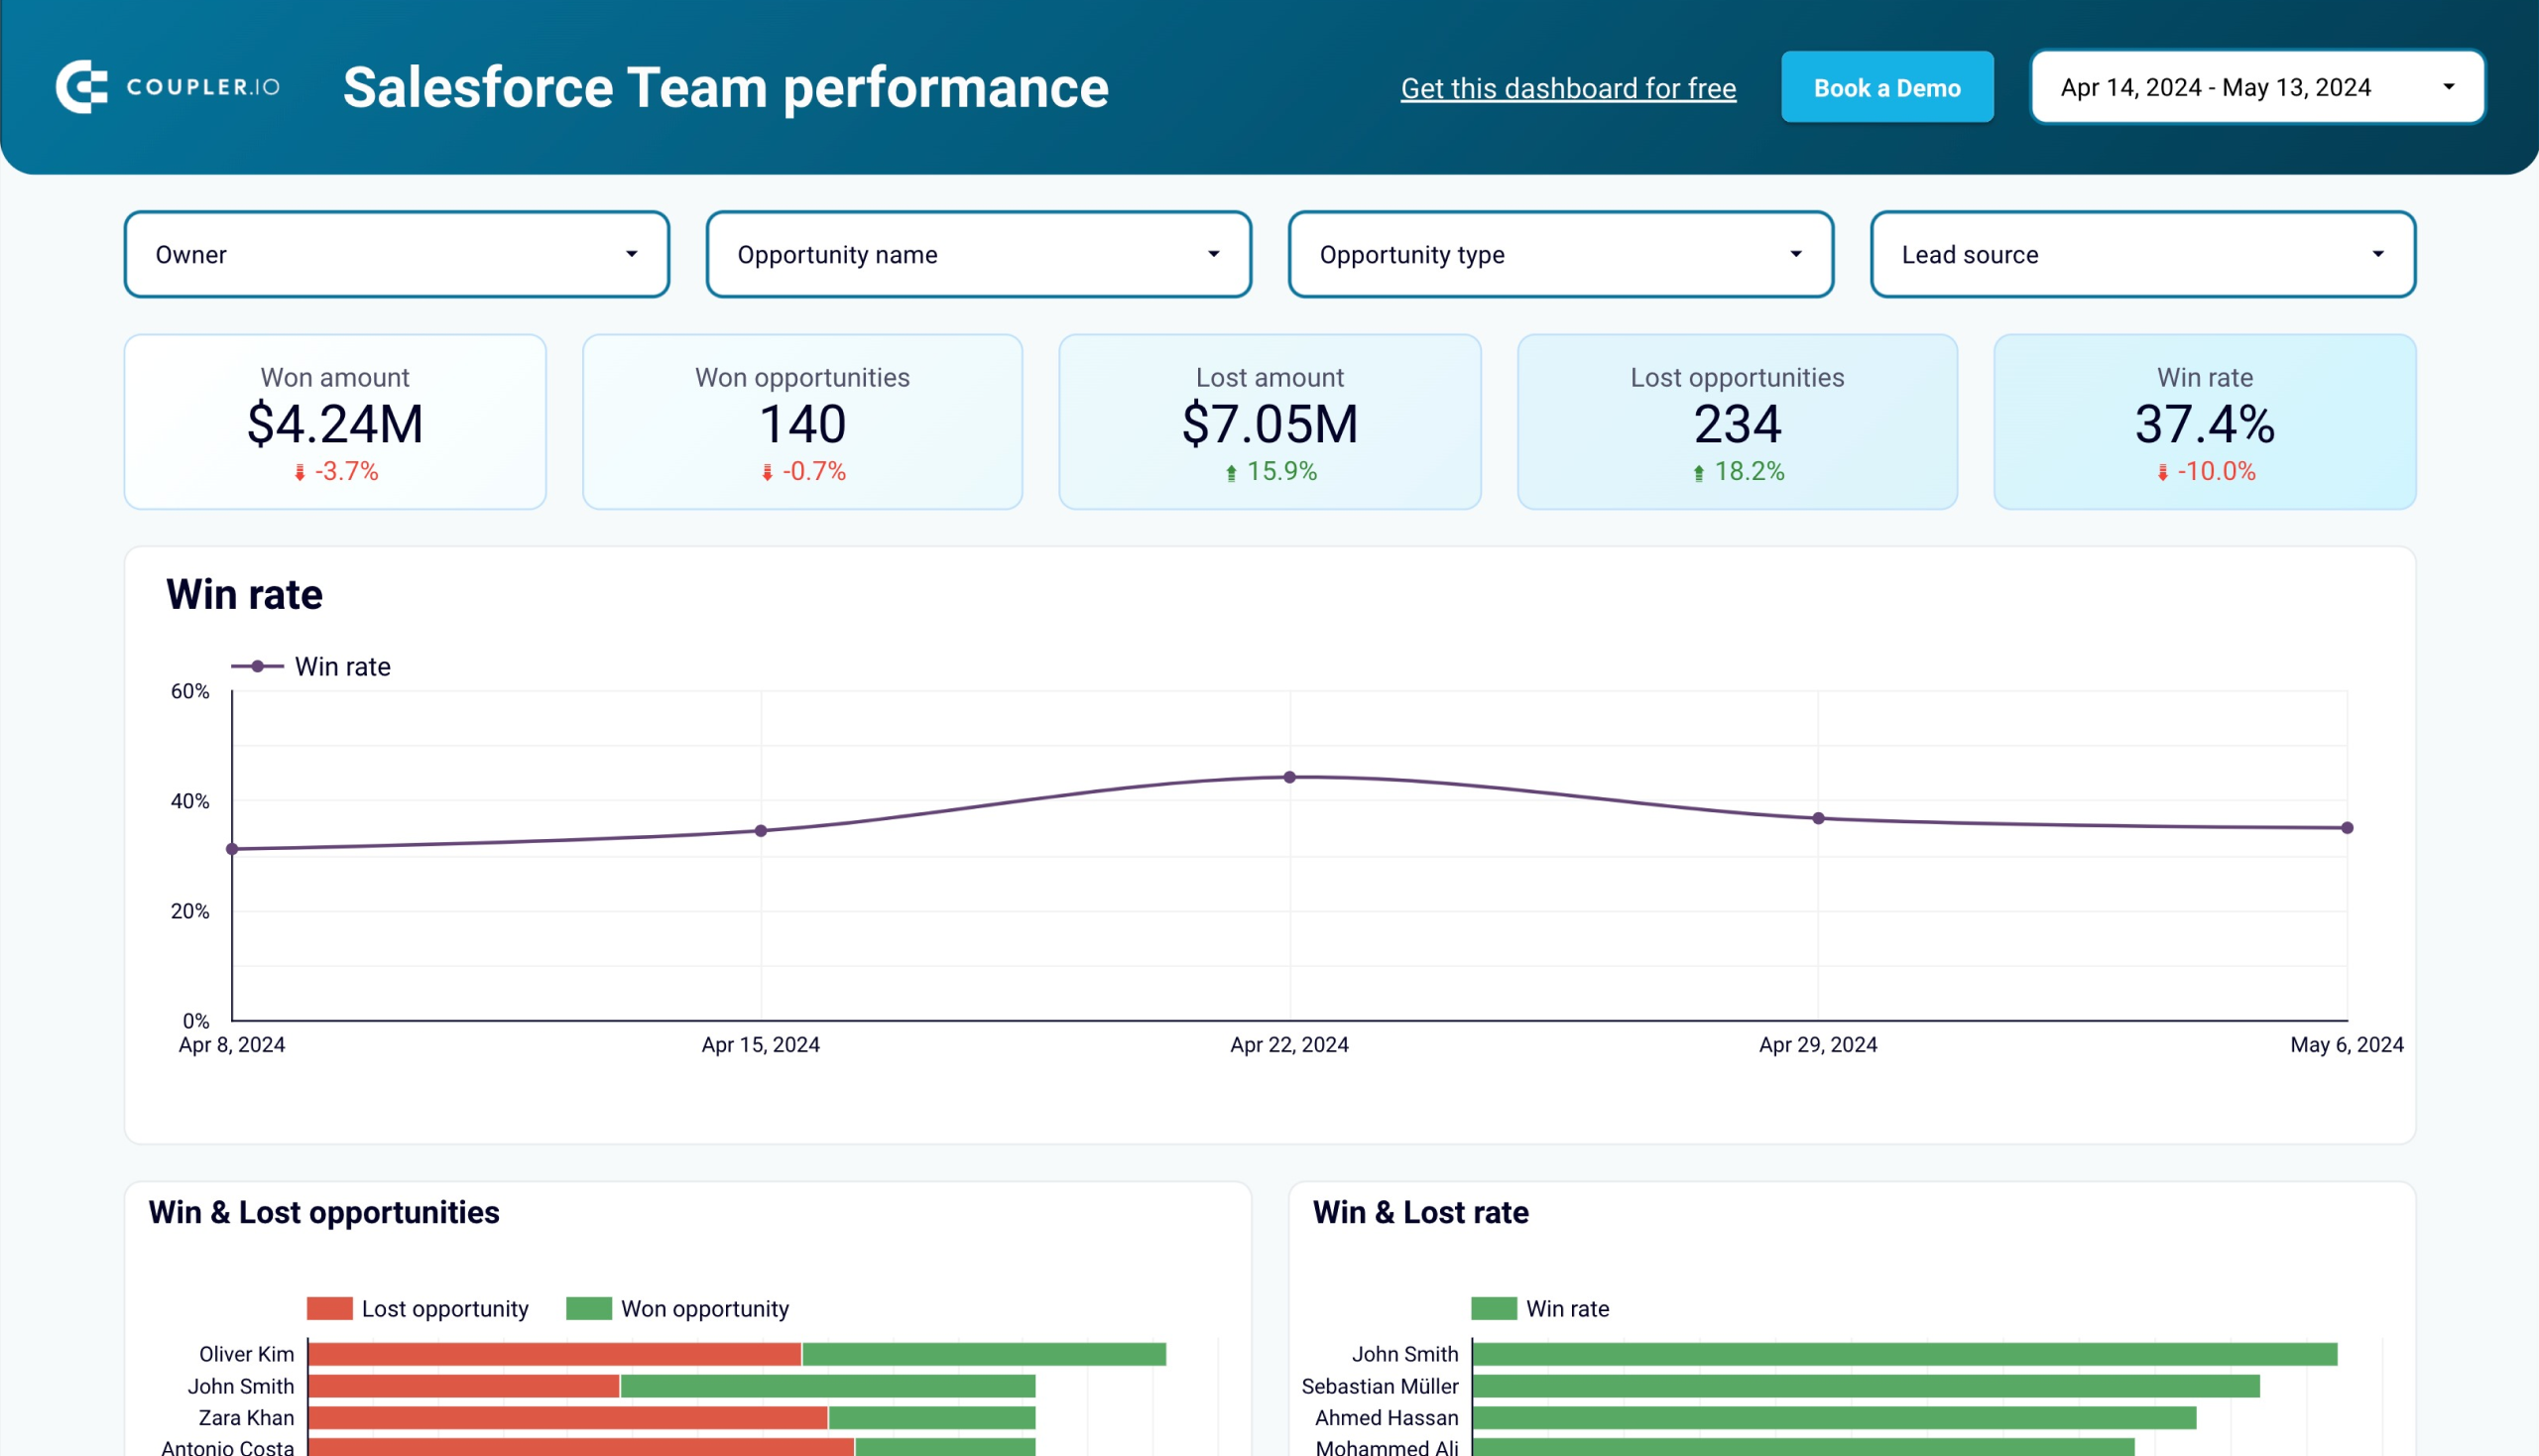
2. Salesforce KPI dashboard for sales team performance by Coupler.io
Coupler.io’s Salesforce KPI dashboard for sales team performance helps you understand how each member of your sales team performs. It’s useful if you have a minimum of 2 sales managers on your team.
The dashboard centralizes data like won amount, won opportunities, lost amount, lost opportunities, win rate, sales funnel stages, deal type closed, average open amount, etc., in a single place. This enables Salesforce admins to evaluate sales performance, allocate resources more efficiently, and make better data-driven decisions.
Key dashboard insights
- Performance by deal type: Understand which managers perform the best in which deal type. The lightning dashboard helps you allocate deals based on each owner’s specialty.
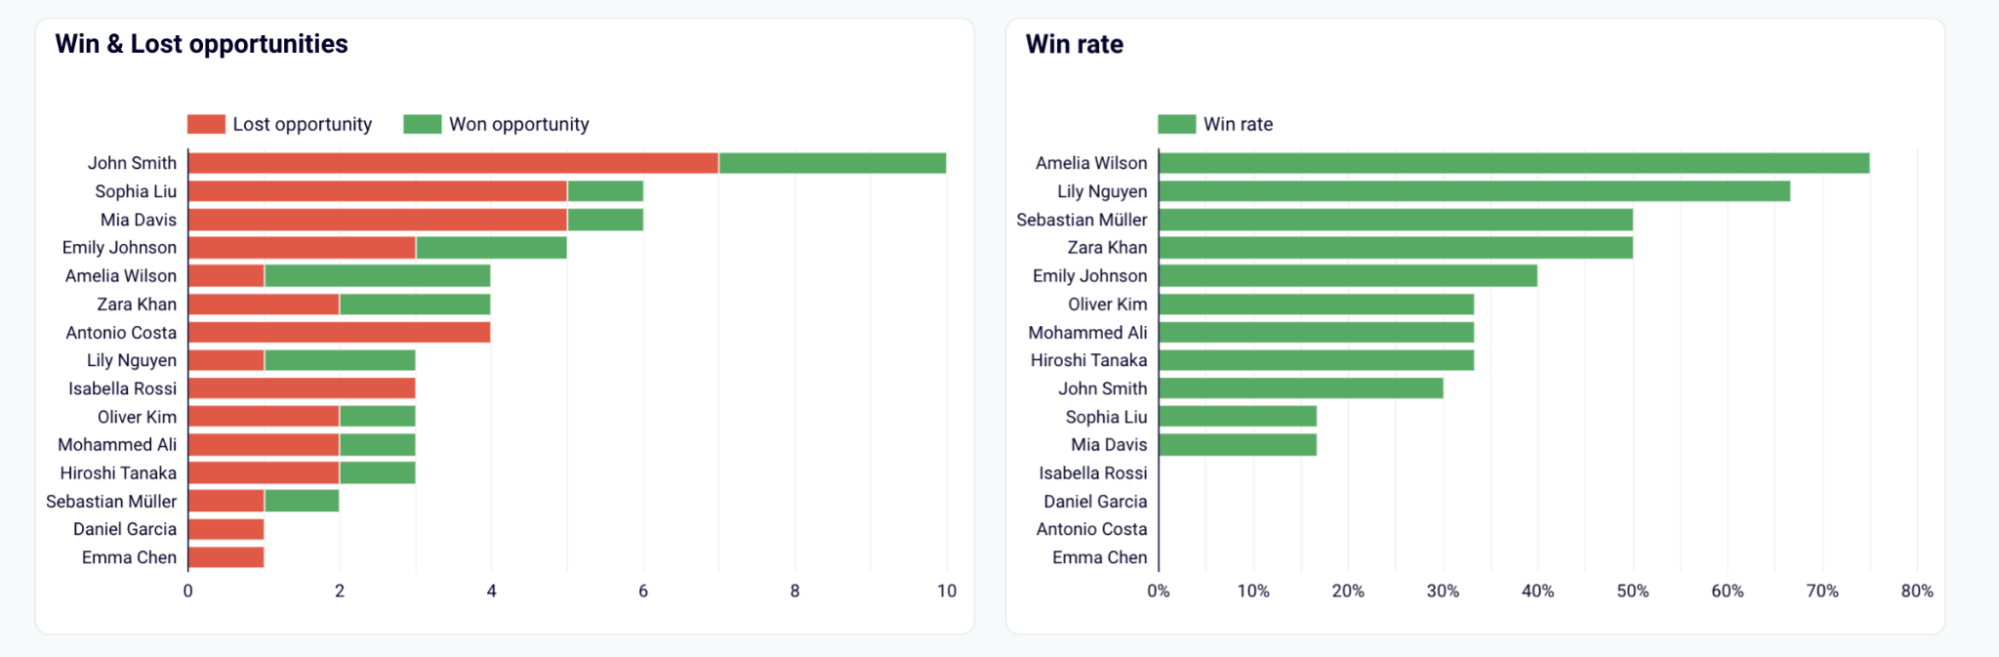
- Win/loss ratio: View each member’s win/loss ratio as a percentage (from the win and lost amount chart and the win and loss opportunity chart). This will help you identify your top and bottom performers and adjust your sales strategies accordingly. Maximize your team’s potential by assigning tasks to the best members based on individual strengths and weaknesses, such as allocating high-value deals to your best performers to boost win rates.
- Top performers: Identify your top performers based on data like win rate, won opportunities, won revenue, etc., from the Top performers chart. This will help you assign managers better opportunities and reward them to boost their enthusiasm.
- Sales pipeline: Understand where each sales manager struggles or excels at which stage. You can provide training accordingly and optimize the outcomes.
You can also view other real-time data like a breakdown of opportunity stages (Lead-in, Contact made, etc.), won amount by opportunity type (Remarketing, Upsell, etc.), won opportunity by opportunity size, closed tasks, task overview, and more.
How to use the dashboard template
This Salesforce KPI dashboard template also comes in two versions – Looker Studio and Google Sheets. You can automate the data loading process by using Coupler.io’s connector to reduce effort, time, and manual errors.
Go to the Readme tab and follow the instructions to get started with this ready-to-use template for free without any credit cards.
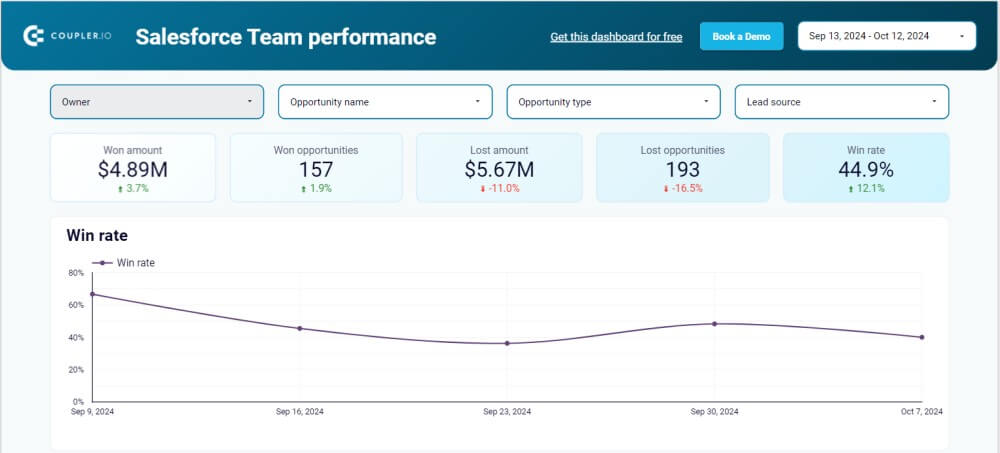
Sales team performance dashboard for Salesforce in Looker Studio
Get insights into your sales team’s effectiveness in converting opportunities within your sales pipeline in Salesforce.
Sales team performance dashboard for Salesforce in Google Sheets
Monitor the effectiveness of your sales team and derive insights into how to optimize your sales pipeline conversions in Salesforce.
3. Salesforce marketing dashboard by Coupler.io
The Salesforce marketing dashboard by Coupler.io allows you to track revenue and leads by marketing channels. The template offers an excellent way to visualize your sales funnel and compare sales performance by month and country. It collects and aggregates data from Salesforce, Google Analytics 4 (GA4), and various advertising platforms like Google Ads, Meta (Facebook) Ads, LinkedIn Ads, and more.
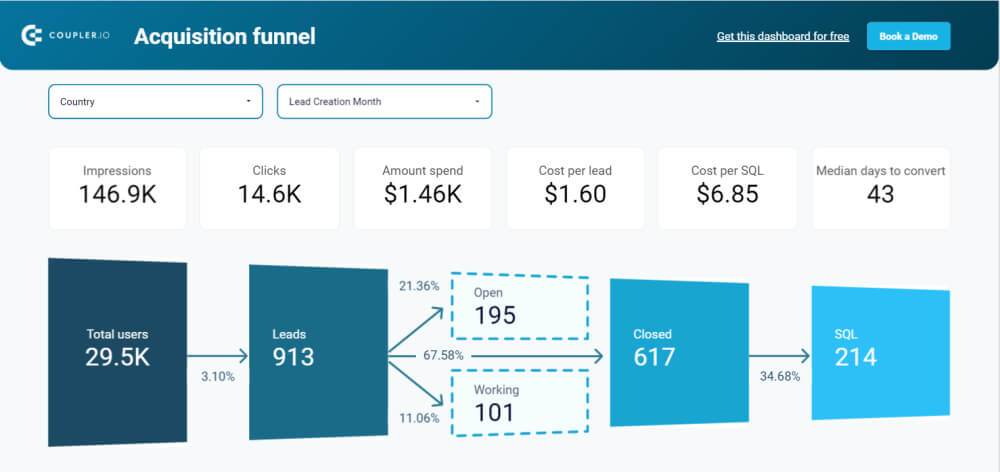
Key dashboard insights
- Sales funnel: Identify total users or traffic, impressions, clicks, leads, conversions, the amount spent, cost per lead, and more from the dashboard. Compare your conversion rates with the industry benchmarks. You can also filter sales data by country or ‘lead creation month’ to view data from a specific country or month.
- Geo/monthly funnel: Visualize sales insights from different countries and periods. This way, you can identify the best-performing periods and regions and uncover challenges (like shipping issues and language barriers). You can also correlate your marketing activities in these periods and locations to identify successful strategies and growth opportunities.
- Spend amount by ad source/country: See how much money was spent on which ad source (like Google Ads, LinkedIn ads, etc.) or country in which month.
- Opportunities: Get a detailed overview of total opportunities, open deals, and closed won/lost. You can also filter by country, closing month, amount, owner name, opportunity type, and lead source. These insights will help you focus on promising deals and improve your win metrics.
How to use the dashboard template
The dashboard template is created using Looker Studio and comes with a built-in connector by Coupler.io. Use the connector to automatically aggregate your Salesforce data and other data sources to Looker Studio, eliminating the need for manual effort, saving you time, and reducing errors. Go to the Readme tab and follow the instructions to get the free dashboard in minutes.
4. Salesforce win-loss analysis by Coupler.io
The Salesforce win-loss analysis dashboard by Coupler.io enables you to compare the deals you’ve won and lost, along with their granular details. This helps you understand the reasons behind both successful and unsuccessful sales, so you can work on weak points and double down your success rates.
The dashboard shows key metrics like the won/lost amount, won/lost opportunities, average won/loss amount, and won/loss rate. You can even apply dashboard filters like opportunity name and type, owner, and lead source.
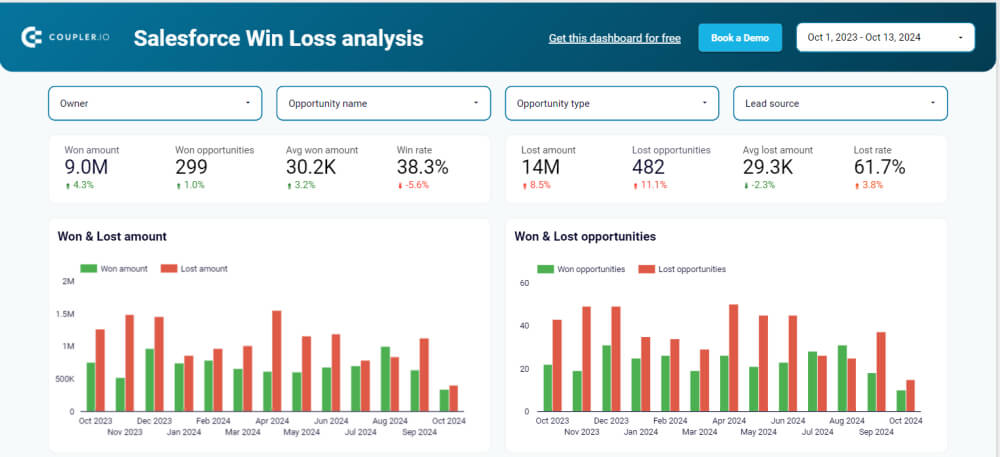
Key dashboard insights
- Win/loss ratio: Identify the ratio between deals won and lost at a point in time. For example, if you want to know how much the win/loss ratio was in July 2024, the dashboard will show you the value. You can compare this with past/current ratios to measure sales performance.
- Win/lost deals segmentation: Find out won/lost deals segmented by industry, owners, country, lead source, opportunity amount, and opportunity age. These insights help you figure out areas of improvement and revise sales strategies.
- Top won/lost opportunities: Identify your best-performing opportunities and focus on them more. Also, reduce focus on underperforming areas and save your time, resources, and effort.
How to use the dashboard template
This Salesforce dashboard template is created in Looker Studio. Simply follow the instructions in the Readme tab to get started for free. You’ll receive Coupler.io’s connector to load data automatically to Looker Studio from your Salesforce account. You can also change the reporting period, country, and other aspects to tailor the dashboard to your needs.
5. Salesforce sales dashboard by Coupler.io
Coupler.io’s Salesforce sales dashboard displays a detailed breakdown of your sales performance. You can quickly view the number of opportunities, the total amount, the open/won/lost opportunities, and more.
The dashboard allows you to apply filters to get insights by owner name, account name, opportunities, etc. The insights assist you in making better decisions regarding marketing, resource allocation, sales, and closing more deals.
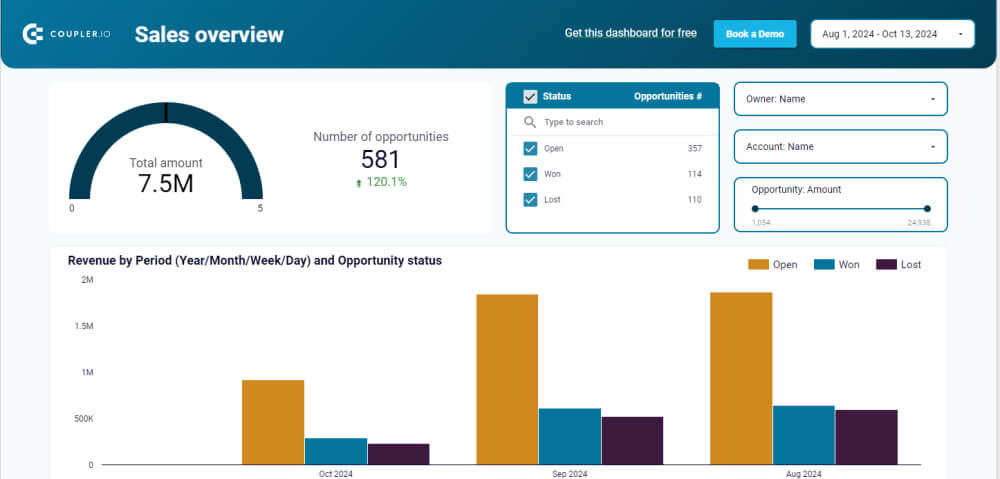
Key dashboard insights
- Opportunity amount: Analyze deals within a specified revenue range by applying the Opportunity amount filter. You can view its status as open, won, or lost, owner’s name, effectiveness, etc., to evaluate a high-value deal and shift focus to valuable deals.
- Revenue insights: Check how much revenue is still open, won, or lost in which period (day/week/month/year), owner/account, and stage (like prospecting, proposal, negotiation, etc). Correlate this insight with your efforts to understand what’s working and what’s not.
- Lead source: View which lead sources are the most effective from the Lead source chart and focus more on them. It shows the comparison between your open/won/lost deals from various lead sources (like partners, purchased lists, and trade shows. You can also filter by opportunity name and type, close rate, close month, new activity date, etc.
- Days to Close: Determine your sales cycle by looking at how many days it took to close the deal. You can understand your closing timelines, which can vary based on deal type, owner, geography, industry, and lead source.
- Deal success/failure: Analyze deal success and failure rates by separating won and lost deals. You can see what strategies are working and which aren’t and the factors influencing the success and failure rates.
How to use the dashboard template
Designed using Looker Studio, this template by Coupler.io comes with a built-in connector to automate data loading from your Salesforce account. Follow the simple Readme dashboard tab instructions to connect and use it for free.
Top 6 Salesforce dashboard examples
Unlike the above 5 Salesforce dashboard templates, these are just examples, so you can not reuse them, but you can take inspiration from them to create your new dashboard from scratch. Customize components based on your organization’s requirements.
6. Marketing executive dashboard
The marketing executive dashboard enables marketing executives, such as VPs, directors, and other senior managers to assess the effectiveness of their marketing campaigns. You can also evaluate whether enough leads are being generated and then converted based on your enterprise’s goals.
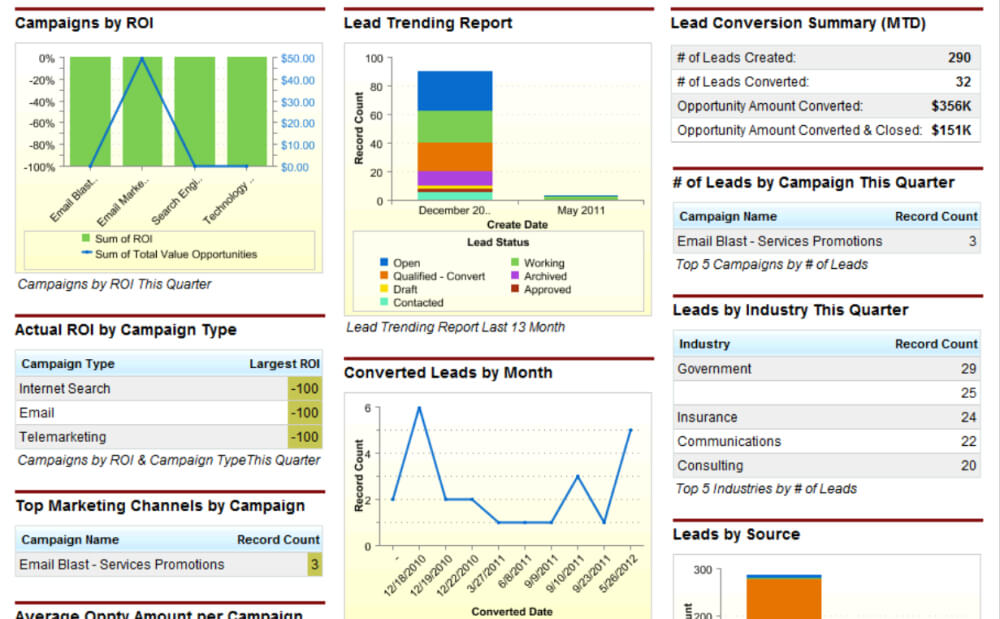
Key dashboard insights
- Actual ROI by campaign type, such as email, webinars, telemarketing, and internet search
- The number of converted leads by month
- Lead trending report to view how many leads are in which status (open, contacted, etc.) in which month and year
- Top marketing channels by campaign
- The number of leads by campaign, industry, and source
- Lead conversion summary like leads created and converted and opportunity amount converted
- The lead conversion rate for a period
7. Service KPIs dashboard
The service KPI dashboard enables senior managers to uncover important customer service insights and make better decisions for training and staffing. Service executives can compare their team’s performance with pre-defined key performance indicators (KPIs) and make improvements accordingly.
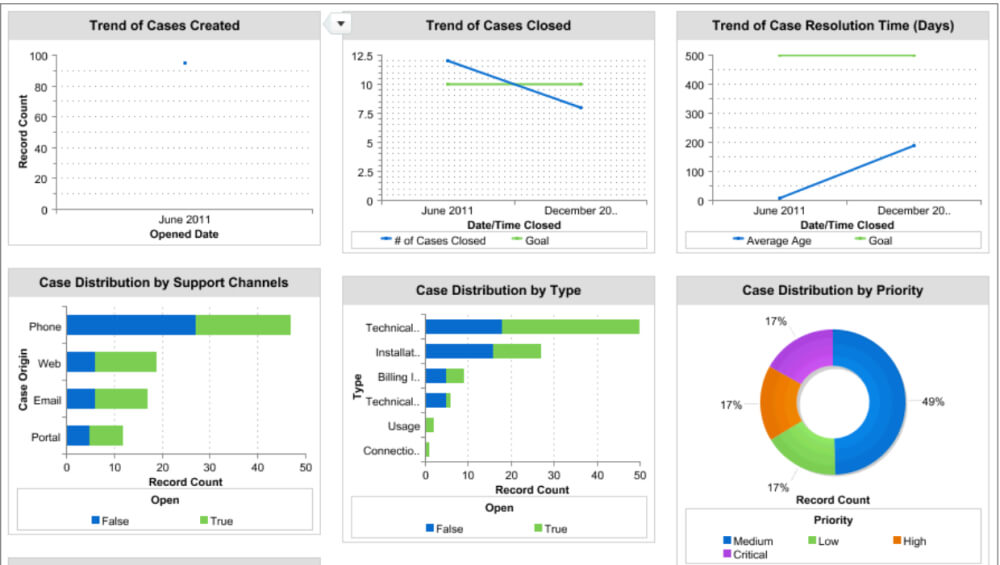
Key dashboard insights
- Case distribution by support channels such as phone, email, etc.
- Case distribution by type such as technical, installation, usage, etc.
- Case distribution by priority: low, medium, high, or critical
- Case closed and case resolution time
- Trend of cases created/closed/resolution time in days
8. Sales analytics forecast dashboard
The sales analytics forecast dashboard allows you to view each team member’s quota attainment and forecast in a specific period and review opportunities to improve the forecast.
The dashboard is easy to follow with its color schemes and information arranged in charts, graphs, and tables. Apply filters to view data by “view as” (forecast manager or executive), owner, opportunity type, forecast category, time period, and record type.
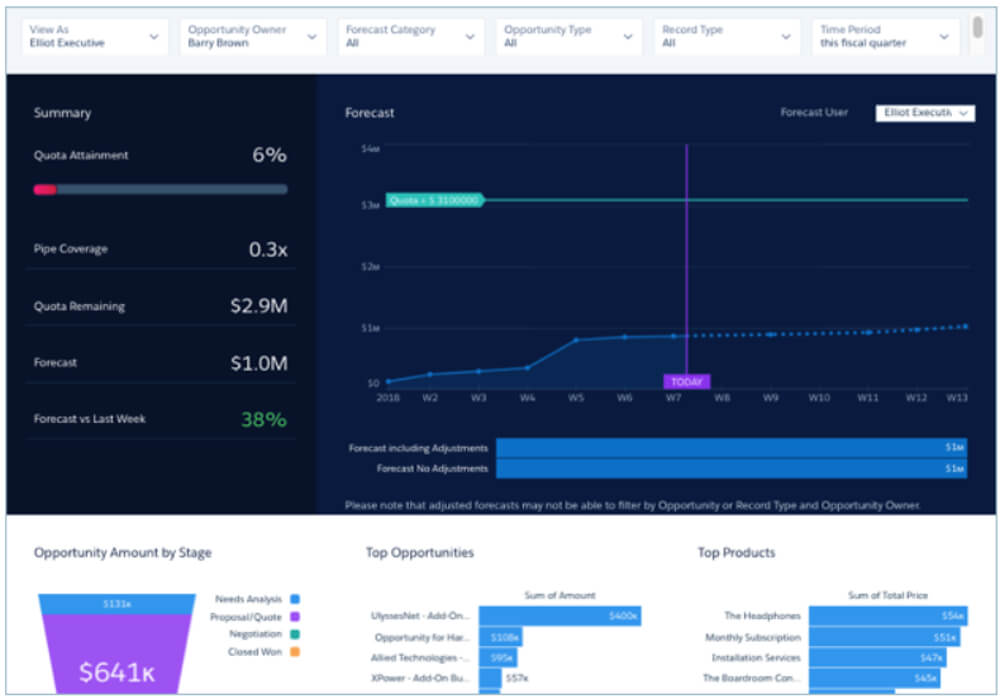
Key dashboard insights
- Quota attainment: Closed won / quota amount per owner in a period
- Pipe coverage: Open pipeline / remaining quota per owner in a period
- Quota remaining: Quota amount – closed won in a period on a close date
- Forecast: Closed won + number of forecast categories chosen
- Forecast vs last week: Figure out how accurate the forecast was compared to last week’s performance
- Top products: View top-performing products based on the amount in a forecast
- Opportunity amount by stage: View opportunities amount in each stage for a chosen period
9. Sales analytics leaderboard dashboard
The sales analytics leaderboard dashboard is an excellent tool for sales leaders to improve members’ performance, train them, and reward top performers. They can use these insights to analyze individual and team performance for a specific period.
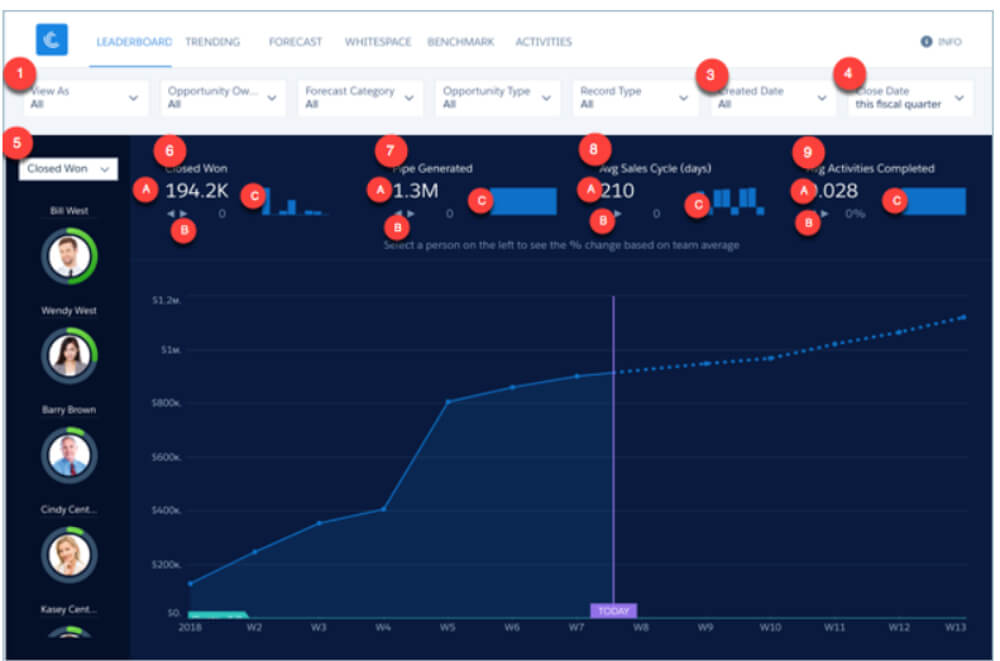
Key dashboard insights
- Quota progress for each member in a sales cycle
- Remaining quota: (quota amount minus closed won) for each owner in a period
- Open pipe: Total amount open in a period after the close date per owner
- Pipe coverage: Open pipeline / remaining quota for each owner
- Pipe generated: Total opportunities created in a period per owner
- Completed activities: Total activities completed per owner in a period
- Closed won: Total amount each owner closed in a period
- The average sales cycle in days
The lead dashboard Salesforce has many functionalities, including:
- Close date filter to change scheduled dates
- Opportunity type filter to view data based on the type of opportunity, such as partnership, new business, etc.
- Top deals chart to track which deals topped the chart so you can focus on them more. It shows the total amount your team or a member closed during a period.
10. Revenue insights dashboard
The revenue insights dashboard provides a quick overview of an organization’s revenue performance. These insights help leaders determine where to focus more, sales trends, the flow of opportunities, and other important sales and revenue details. Executives can also use these insights to understand whether their efforts are paying off and improve their performance.
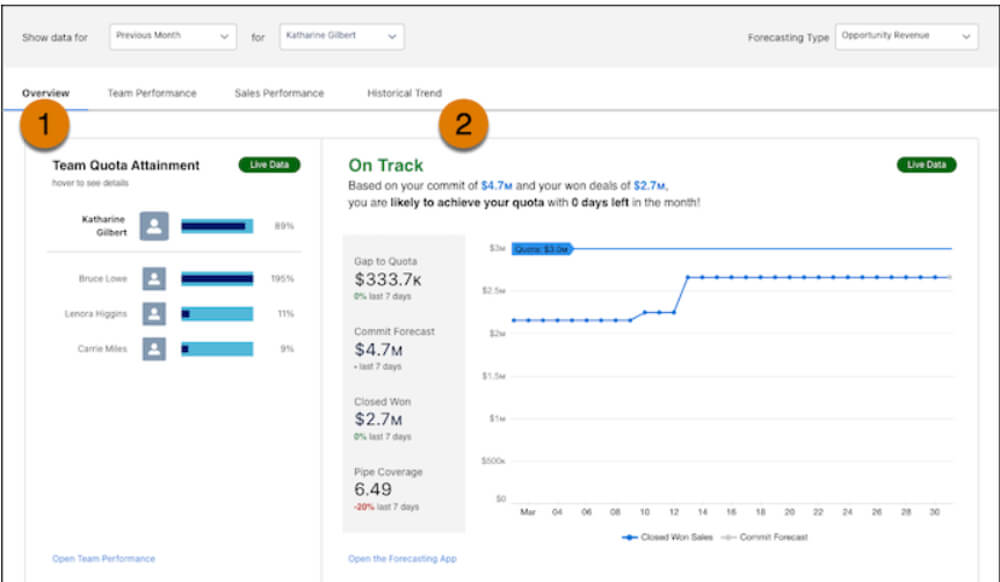
Key dashboard insights
- Team quota attainment: This shows the quota status of your team members.
- On Track/Off Track: This shows the gaps in meeting the committed quota, pipe coverage, closed won, and commit forecast.
- Opportunities Needing My Attention: This chart shows insights like No Activity (in the last 14 days or scheduled in the future), No Next Step, and Stuck in Stage (opportunities stuck in one stage for 14 days or longer)
- Opportunity changes: This shows changes in the 7 days for opportunity amount, close date, forecast category, new opportunities, and lost opportunities.
- Top open opportunities: View dashboard insights to find your best opportunities with the forecast category as commit, most likely, best case, and pipeline, and focus your efforts in that area.
- How is my sales performance trending?: This displays real-time data like total won opportunities, average sales size, average days to close, and win rate in %.
11. Sales stage analysis dashboard
If you want to understand how your deals are moving through the pipeline and the risks and bottlenecks in the process, the sales stage analysis dashboard is helpful. It provides you with granular details on the stages of your sales. For example, you can see the duration a deal remains in each stage, the amount changes in opportunities, and more.
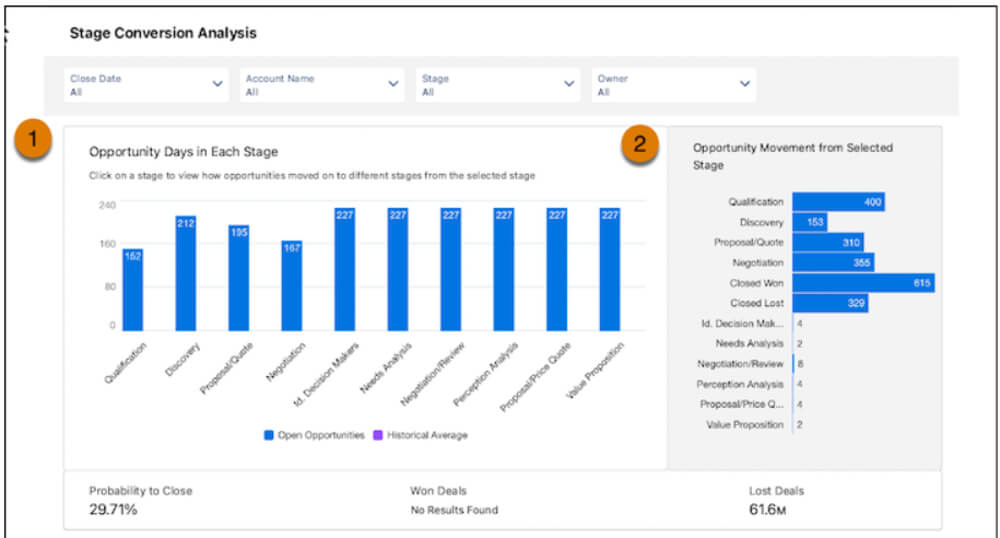
Key dashboard insights
- Opportunity days in each stage: Determine how long a given deal remained at one stage before moving to another, along with the number of lost and won deals.
- Opportunity Movement from Selected Stage: Track how many deals have moved from one stage to another.
- Neglected opportunities: This is the number of opportunities neglected in each stage.
- Stalled opportunities: View which deals remained in one stage for over 30 days.
- Pushed opportunities: This is the number of deals scheduled to close in one period but pushed to the next period.
- Deals overview: Overview each deal with its close date, forecast category, stage, amount, account name, and time in stages. This helps you refine your pipeline strategy.
12. Lead dashboard Salesforce by CloudAmp
The lead and opportunity dashboard by CloudAmp allows Salesforce admins to gain better clarity on their opportunities and leads funnel to generate more profit. You can also track pipeline trends to adjust your strategies and increase revenue and sales.
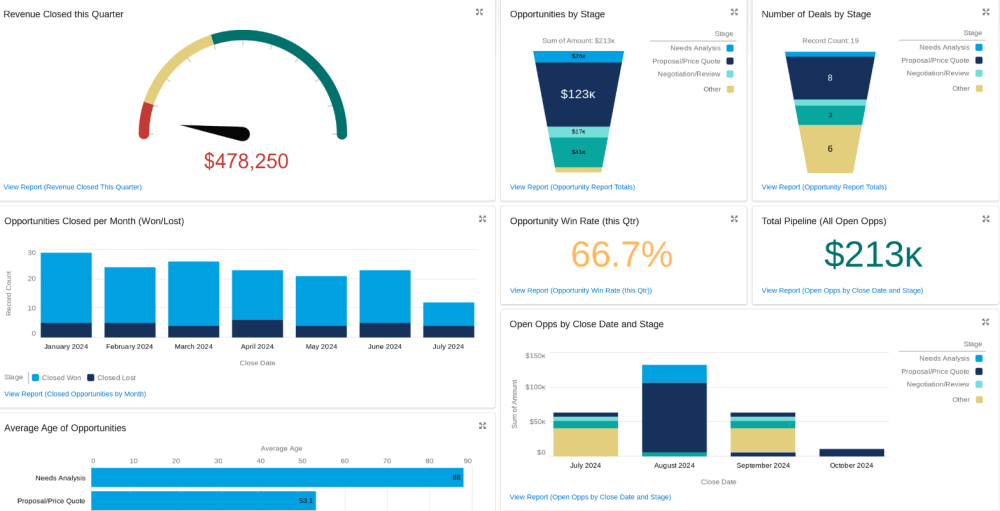
Key dashboard insights
- Leads: View the number of leads by day, week, and month along with leads by status and creator. You can also view the last 10 leads and the ones that have converted.
- Opportunities: Find out the value of opportunities by stage, opportunities closed per month, open opportunities by stage and close date, and the average age of opportunities. In addition, get to know the total pipeline value, revenue closed this quarter, and the number of deals by stage.
- Pipeline and team management: View pipeline by stage, leads created by reps, won/lost opportunities by rep by quarter, open opportunities by rep and close date, won opportunity revenue by rep, and average won deal size by rep.
- Success metrics: Figure out lead conversion rate along with monthly win rate and in the last 90 days.
13. Sales pipeline dashboard by GSP
If you’re looking to gain comprehensive visibility on your enterprise’s sales pipeline, use the sales pipeline dashboard by GSP. This high-impact, fully customizable dashboard allows you to view the performance, quality, trend, and size of your sales pipeline.
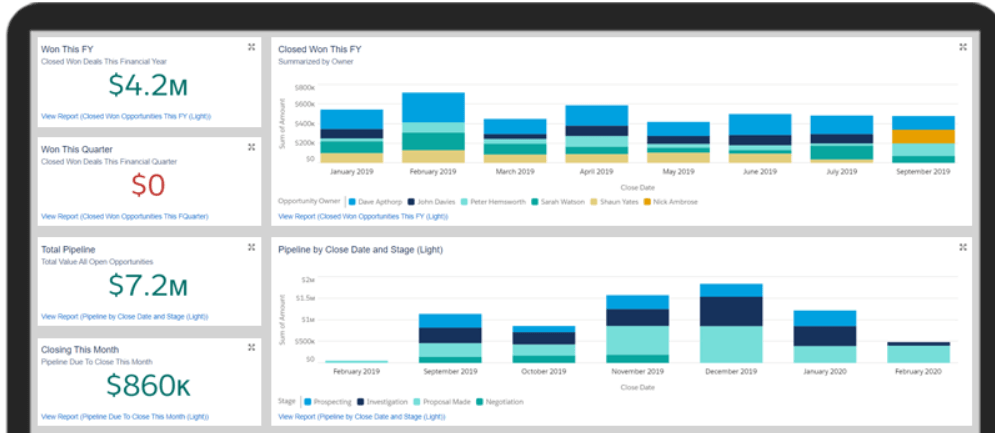
Key dashboard insights
- Pipeline quality metrics: Enables managers to evaluate sales pipeline health by viewing pipeline quality metrics, such as total pipeline value, closing value this month, closed won, won (this quarter or month), etc.
- Pipeline by stage and close date: Understand opportunity value with closes in a month and deals based on their stage.
- Closed won opportunities this FY: Get to know the total revenue your company achieved this financial year.
- Sales funnel chart: Find out the value of deals in each stage of the pipeline from this chart.
- Opportunity conversion ratios/win rates: Calculate win rates by amount and number and conversion rates by territory and salesperson.
- Short-term/long-term pipeline trend: Measure pipeline size at the beginning of each week and month to understand short-term and long-term trends in pipeline size, respectively.
What is the difference between a Salesforce dashboard and a template?
A Salesforce dashboard is a visual representation tool that you can create to view various metrics, such as sales and marketing insights, and make better decisions and strategies.
A Salesforce dashboard template is a reusable tool that you can use or customize to meet your specific requirements. It saves you the time and effort of creating a dashboard from scratch.
What types of Salesforce dashboards exist?
- Sales dashboard represents sales metrics, such as total sales win/loss ratio, conversions, revenue, etc. This helps you understand sales trends, forecast sales, and improve sales.
- Marketing dashboard shows marketing KPIs, such as site traffic, conversion rates, lead generation, social media engagement, etc., to track marketing progress and adjust strategies.
- Customer service dashboard provides insights into customer interactions, team performance, response rates, and more. Using these insights, you can improve agent performance, train agents, and allocate resources efficiently.
- Operational dashboard reflects the current business state with key metrics, such as quality control, employee productivity, customer retention/acquisition rate, time-to-decision, etc., to help optimize operational efficiency.
- Analytical dashboard displays metrics, such as revenues, lead generation, online conversions, customer satisfaction rates, churn rates, etc., interactively using tables, charts, and plots to enhance overall business performance.
- Strategic dashboard offers a lightning-fast overview of current performance against set KPIs to monitor the efficiency of strategies and improve them.
What Salesforce dashboard components should you add?
You can’t just randomly add visual elements to your dashboards since each chart or graph has a specific value. For example, line charts are the best way to show progress, and scorecards are the choice to highlight a specific result. Check out some of the most common components you can use in your Salesforce dashboard:
Charts show insights graphically. You can add various chart types, such as:
- Bar charts: To view values horizontally or vertically, best for displaying one grouping in a summary report.
- Line charts: To show changes in metrics over time, suitable for understanding trends and relationships.
- Pie charts: To highlight a proportion of a value (usually in %) for each group against the total value.
- Donut charts: To display the proportions of data in each category as arcs and not slices (unlike pie charts).
Tables represent a set of insights in columns, highlighting groupings and fields. For example, if you want to see the top 5 opportunities by amount, you can customize the table by selecting columns like opportunity amount and name to display. Next, apply settings like sort order and conditional highlighting to view the desired groupings and fields.
Metric charts display one key value among many. It’s useful when you want to quickly view the amount of something, for instance, the number of days in the sales pipeline.
Gauge charts are used to show a single value within a set of values, which can indicate something like poor, satisfactory, and excellent.
How do I improve dashboard performance in Salesforce?
To improve your Salesforce reports and dashboards, tailor them to fit your organization’s needs. Coupler.io allows you to collect data from different sources, including Salesforce, transform the data, and visualize it using a BI tool or spreadsheets.
The platform utilizes Salesforce API which you can use without any coding skills. Let’s explore how to create a custom dashboard template:
1. Collect data
In the below form, select a destination for your dashboard and hit Proceed. Once done, you’ll be taken to a page inviting you to start with Coupler.io for free without any credit cards.
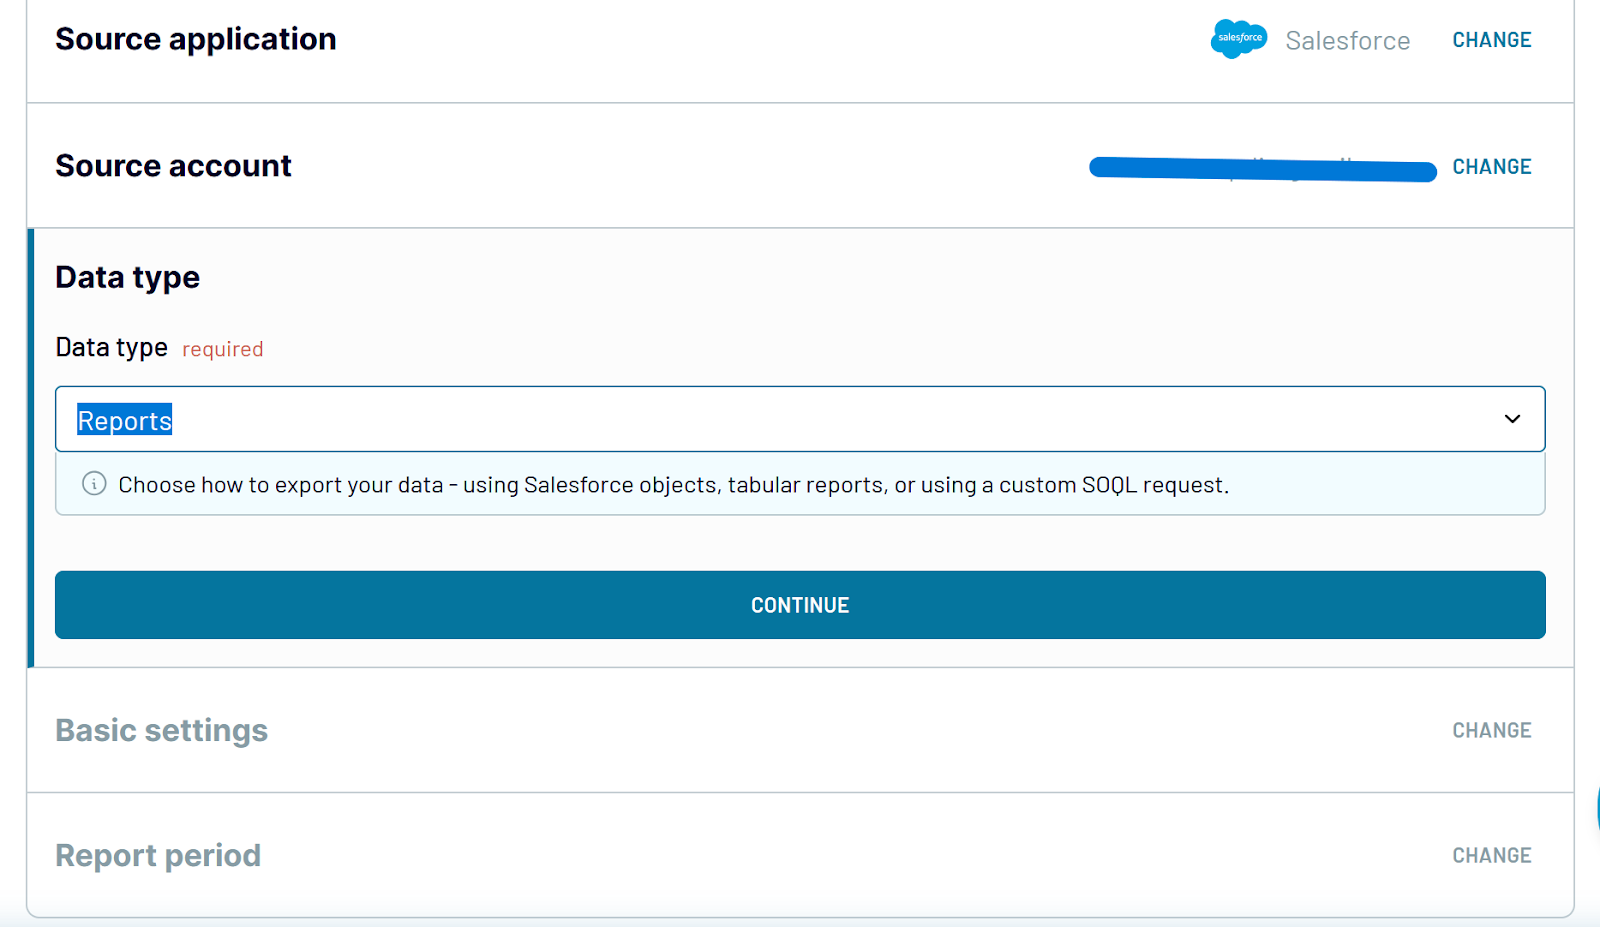
Next, complete the authentication and permissions for your Salesforce account and select a data type you prefer. You’ll be given three options:
- Objects: Objects, such as Account, Account History, Opportunity, and Leads, are predefined in Salesforce.
- Reports: There are multiple tabular report types in Salesforce for data collection.
- Custom SOQL: Extract data or export various data types concurrently using the custom Salesforce Object Query Language (SOQL).
2. Structure data
Structure and organize data before you load your datasets into the destination application. Do this via Coupler.io’s functionality:
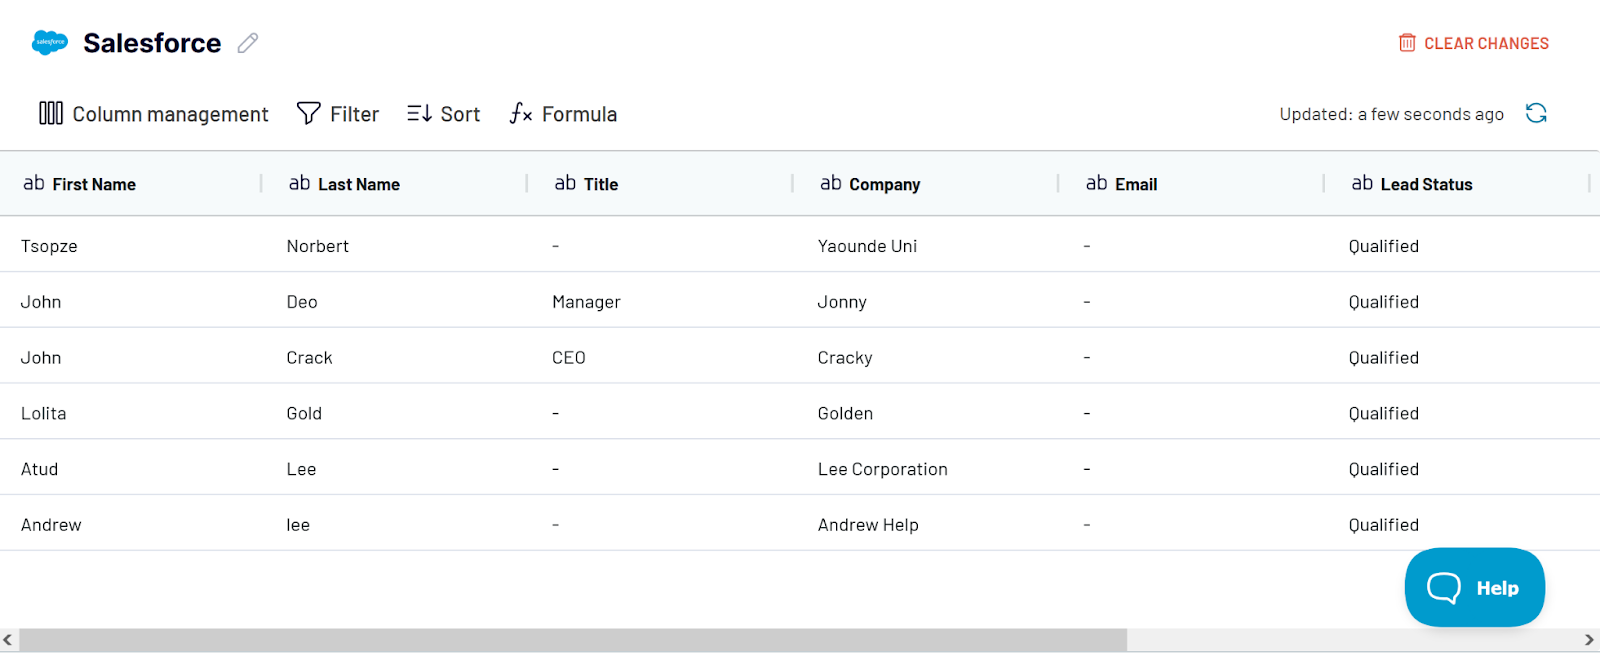
- Adding, editing, hiding, or rearranging columns
- Sorting data and applying dashboard filters to obtain your preferred order
- Consolidating information from various apps and accounts to create reports that work across multiple channels
- Using custom formulas to create new columns
3. Load data and schedule refresh
Connect the destination app and start loading the Salesforce data to it by following the on-screen instructions. Schedule and automate data refresh to ensure you get the latest data and notifications.
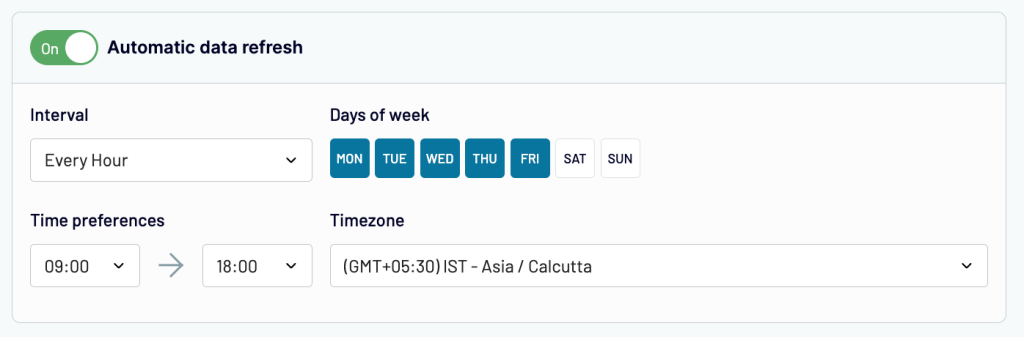
Once done, you’ll receive a notification on your dashboard. Next, you can view and edit your file to meet your requirements.
Automate Salesforce reporting with Coupler.io
Get started for free