Angela is a Salesforce user who needs to analyze the performance of her business. For analytics, Salesforce offers dashboards and reports. The latter seems to be ideal since it is good for pipeline analysis, calculation of basic sales productivity metrics, and other analytical tasks. In addition, Salesforce reports can be customized, visualized, and even exported. Wonderful!
It would also be great to have a guide or tutorial to explain all the intricacies of reporting in Salesforce…but wait! You’re already at the right place 🙂 In this article, you’ll learn how to create reports, what formats and types are available, and much other valuable information.
What options are available for Salesforce reporting?
Basically, there are two ways to set up reporting in Salesforce: native and custom.
The native approach means that you rely on the built-in Salesforce reports – both standard and custom ones. These are suitable for simple analytics, such as pipeline analysis. However, they are not fit for more advanced analytical purposes, making forecasts, and blending Salesforce records with external data.
In addition, there are specific limitations on Salesforce reports depending on the edition you have. The pretty confusing flow of creating, scheduling, and editing the reports is not to say. It’s not as user-friendly as it could be.
Those are the reasons why Salesforce users opt for external or custom reporting. The idea is that you either create a custom report in spreadsheet apps or BI tools or use ready-to-go report templates. This approach lets you avoid or minimize the limitations of native Salesforce reports and benefit from advanced reporting solutions. Let’s check out this option first and after that, you can learn more about native reports in Salesforce.
Custom ready-to-use templates for Salesforce reporting
This option allows you to speed up the reporting setup since it does not require you to make the actual report building. All you need to do is load Salesforce data to the preset report template and that’s it. Check out a few examples of templates in Looker Studio and Google Sheets. They are integrated with a no-code Salesforce connector by Coupler.io. This means that you only need to connect your Salesforce account to populate the dashboard with your data. These Salesforce report templates are free and you can start using them right away.
1. Salesforce dashboard
This report provides a detailed snapshot of your sales performance and lets you monitor all your sales opportunities on one dashboard.
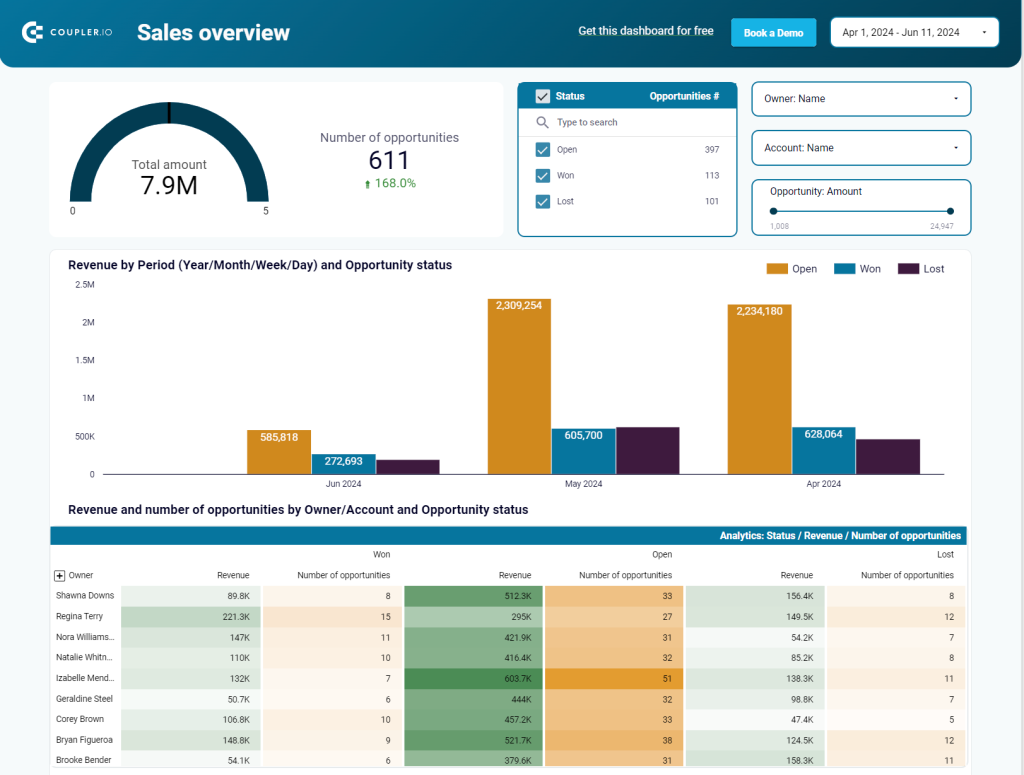
- On one page, you get an overview of sales activities and can drill them down by type, stage name, lead source, and other parameters.
- You can understand the state of your open deals and the revenue they can bring.
- The dashboard lets you analyze the performance of your sales team and identify the most efficient members. With that, you get their probability of bringing more won opportunities and, hence, revenue.
With this report, you can track key metrics, understand deal progress, and identify trends that impact your business growth.
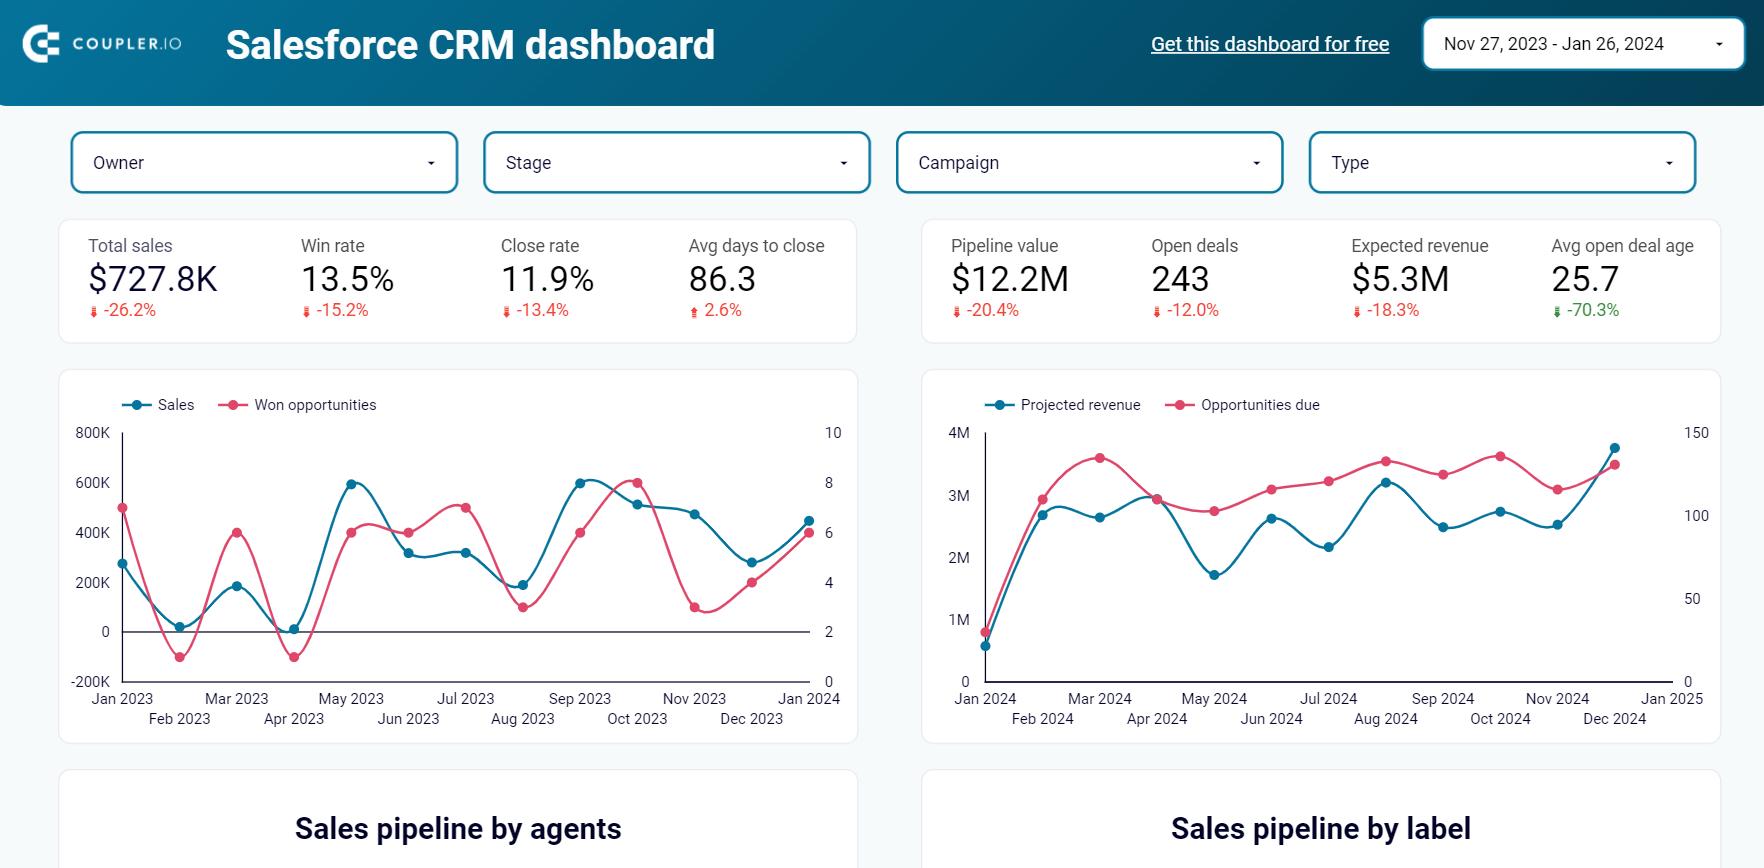
2. CRM dashboard for Salesforce
Use this CRM dashboard template for Salesforce to understand the factors driving your revenue.

The report provides a holistic view of your customer relationships, sales activities, and overall business health. It’s a helpful analytics solution to identify trends, opportunities, and areas for improvement.
The Salesforce report template is available for Looker Studio and Google Sheets. Pick the option that fits your reporting requirements and try it out right away.
CRM dashboard for Salesforce
Use our CRM dashboard for Salesforce to track key metrics, check how your sales team performs, and understand what drives your revenues.


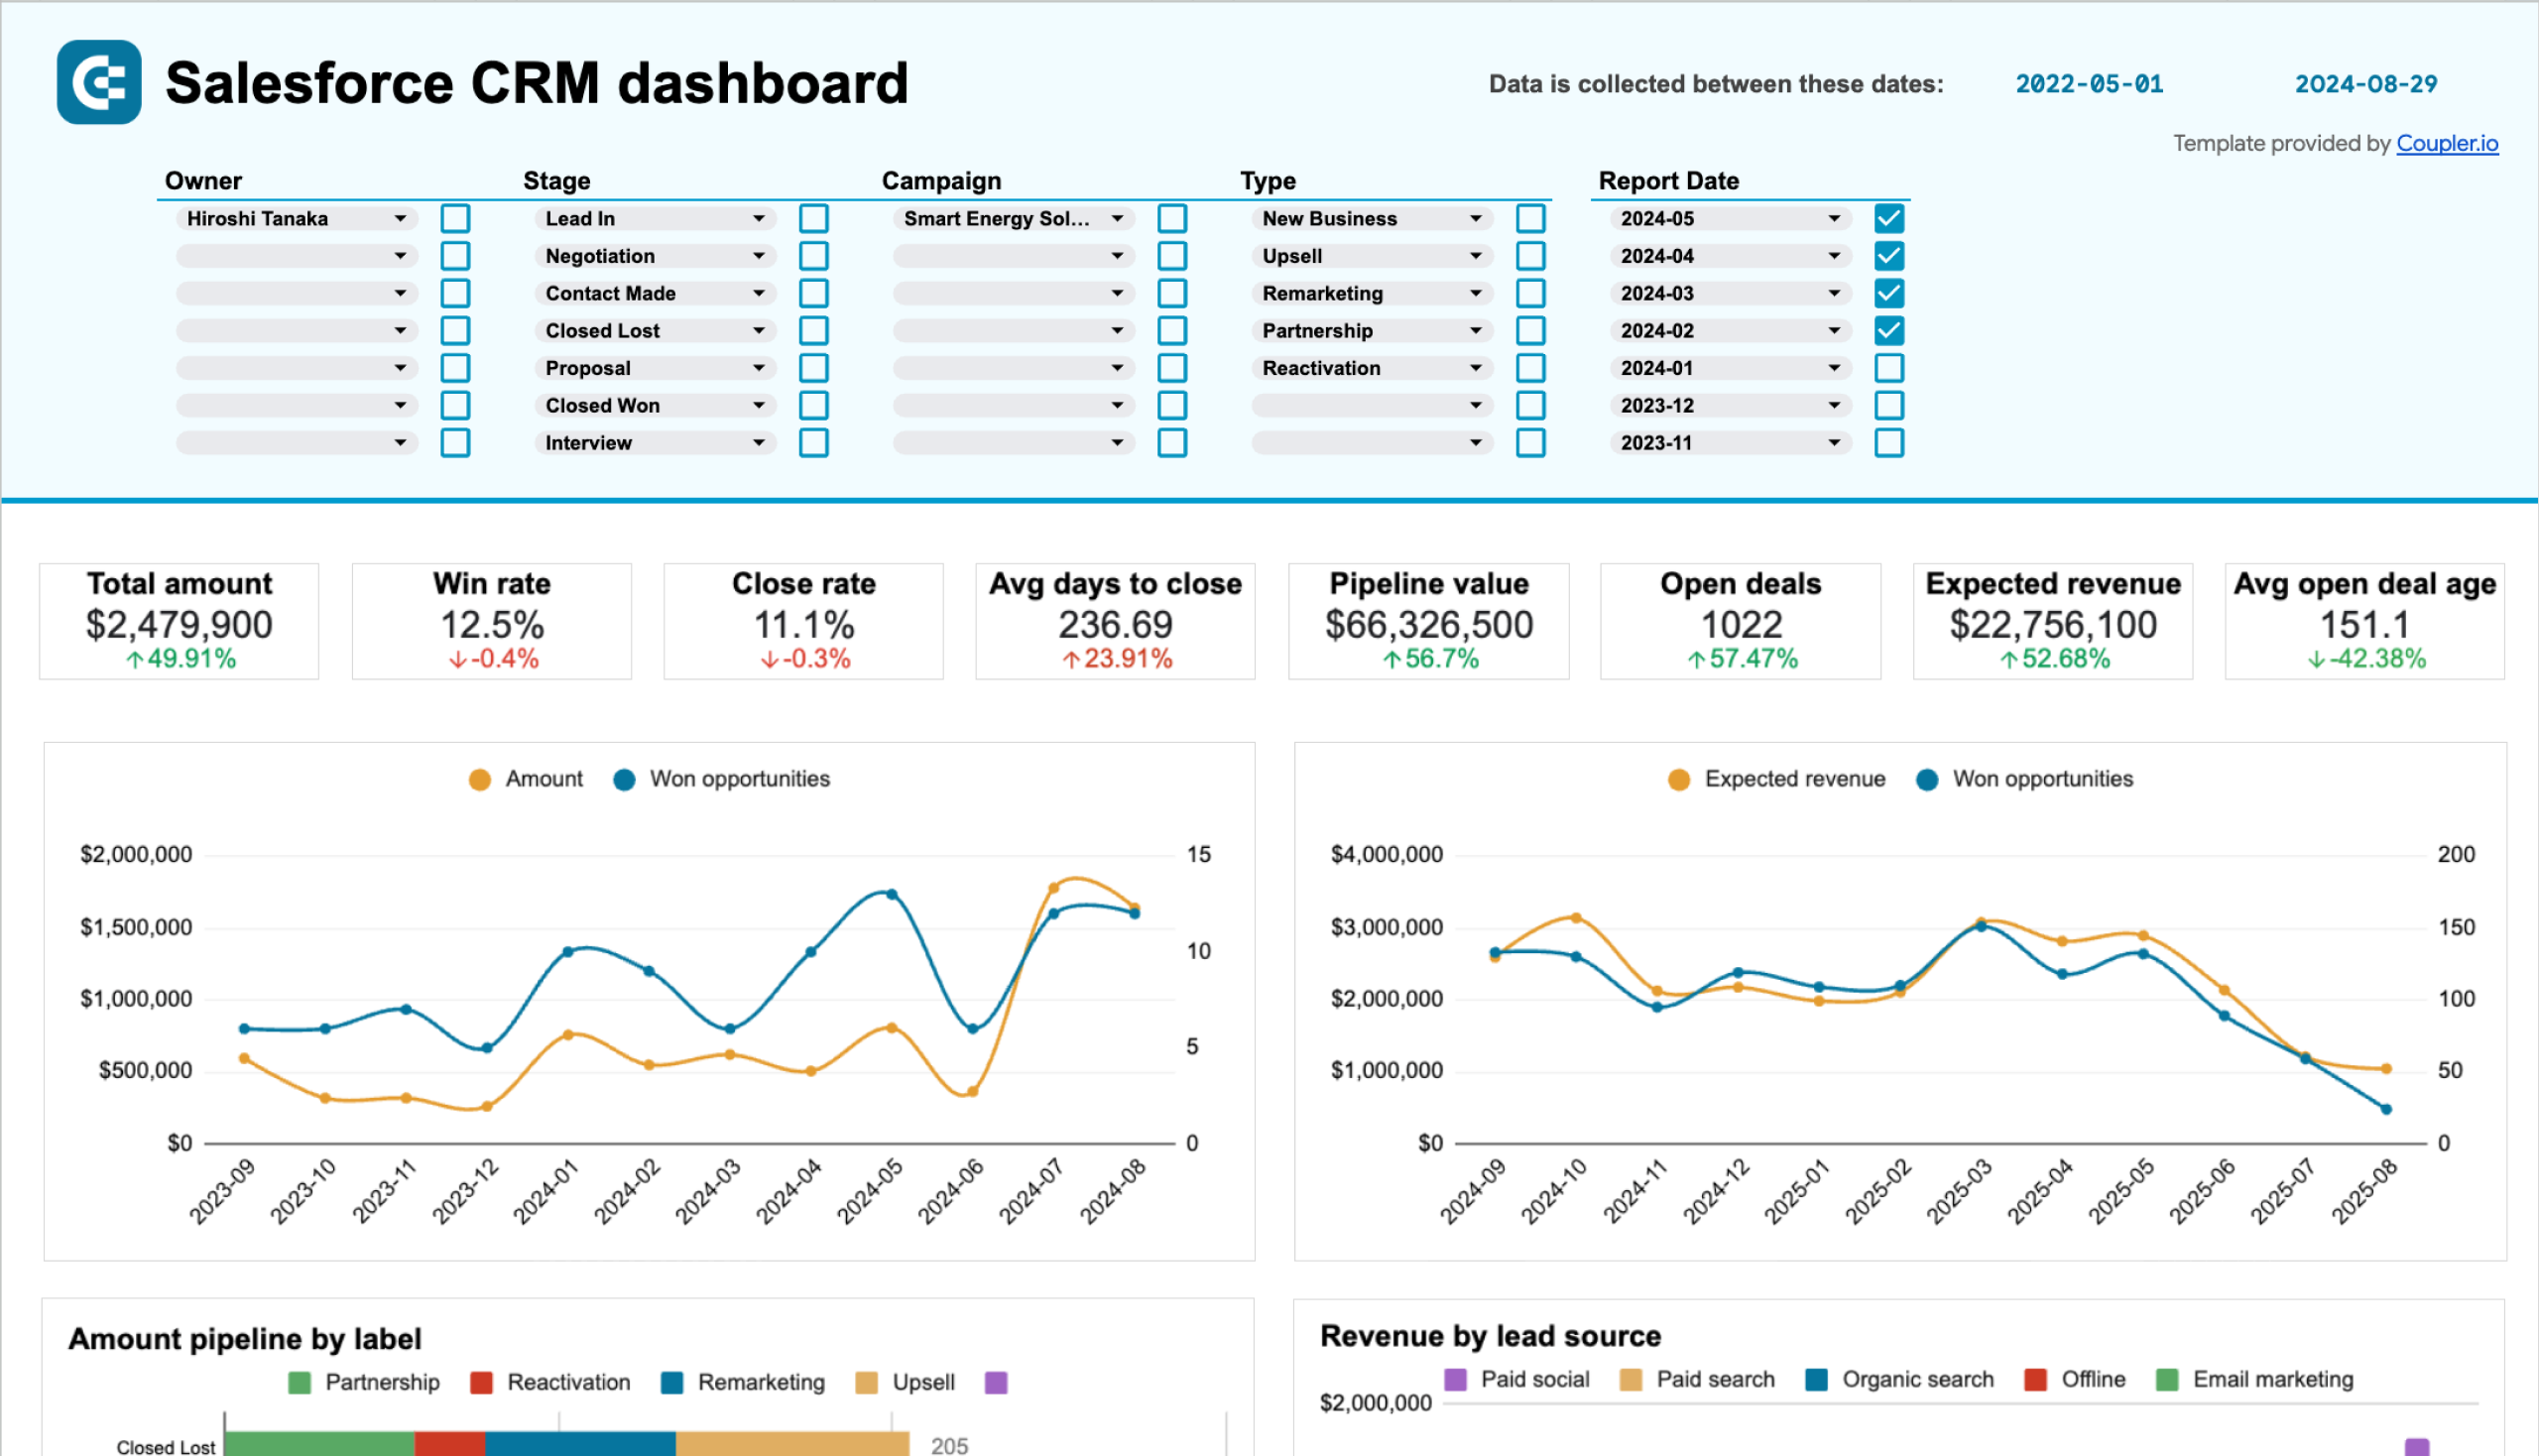
Salesforce CRM dashboard in Google Sheets
Get a detailed overview of your opportunities in Salesforce and analyze the performance of your sales team.

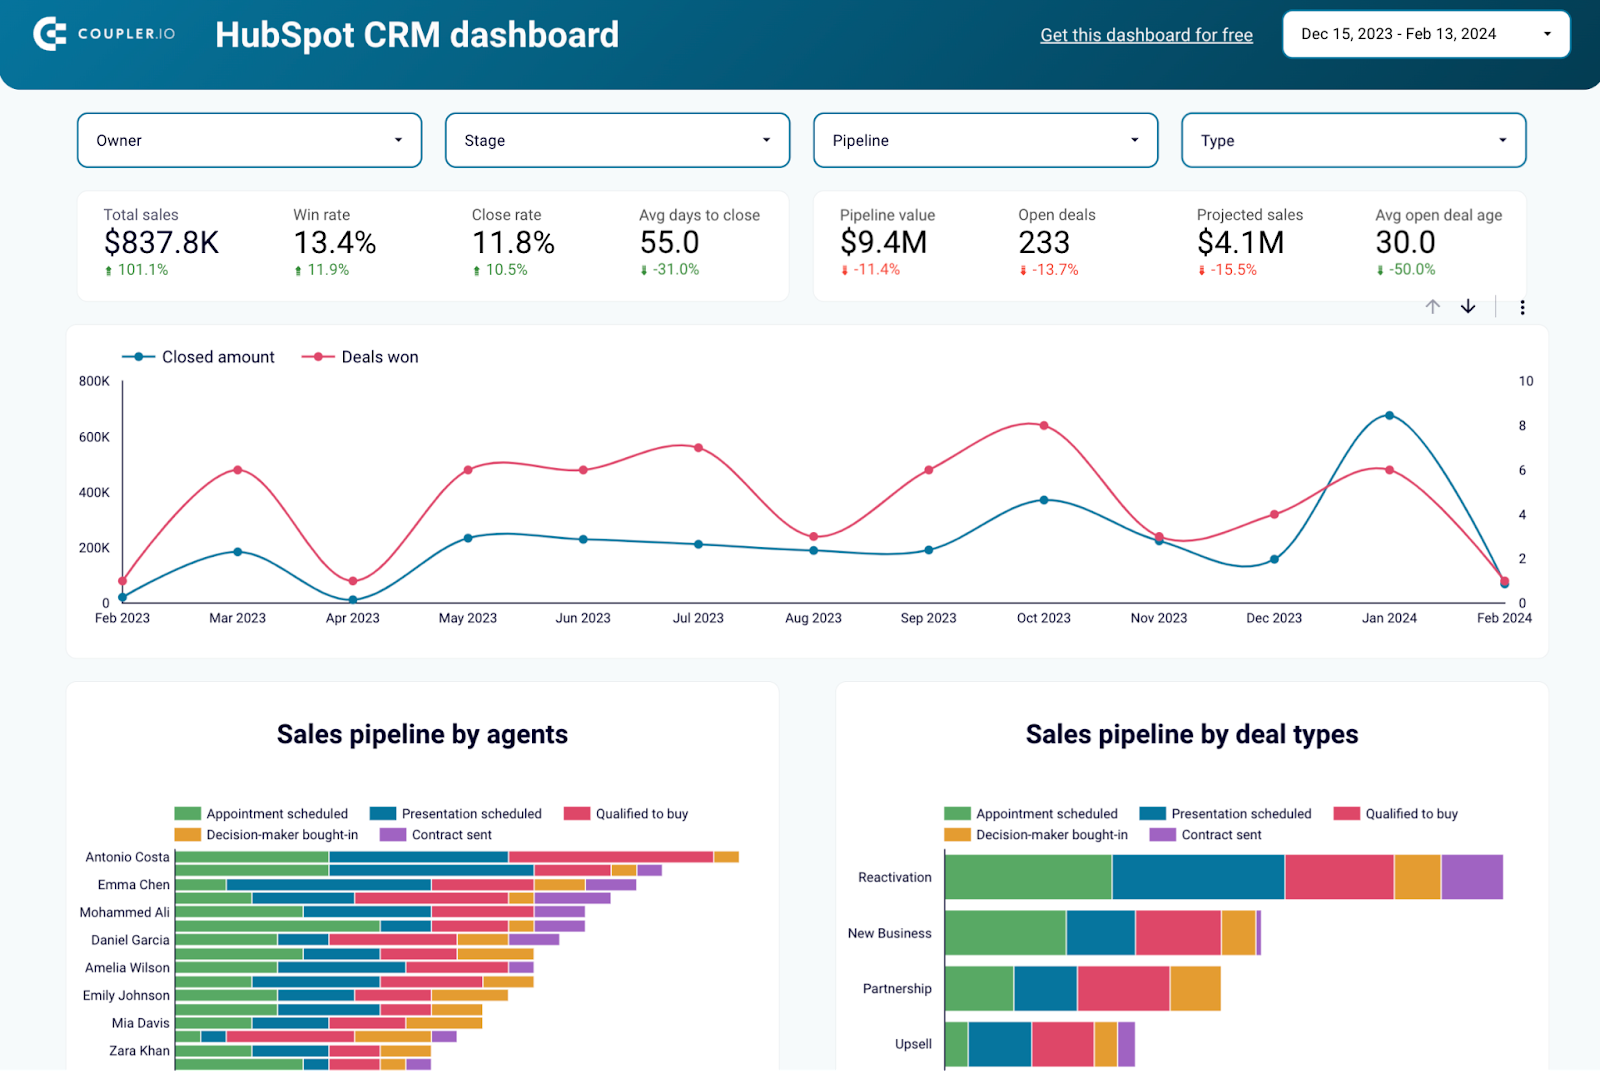
CRM dashboard for HubSpot
Use our CRM dashboard for Salesforce to track key metrics, check how your sales team performs, and understand what drives your revenues.

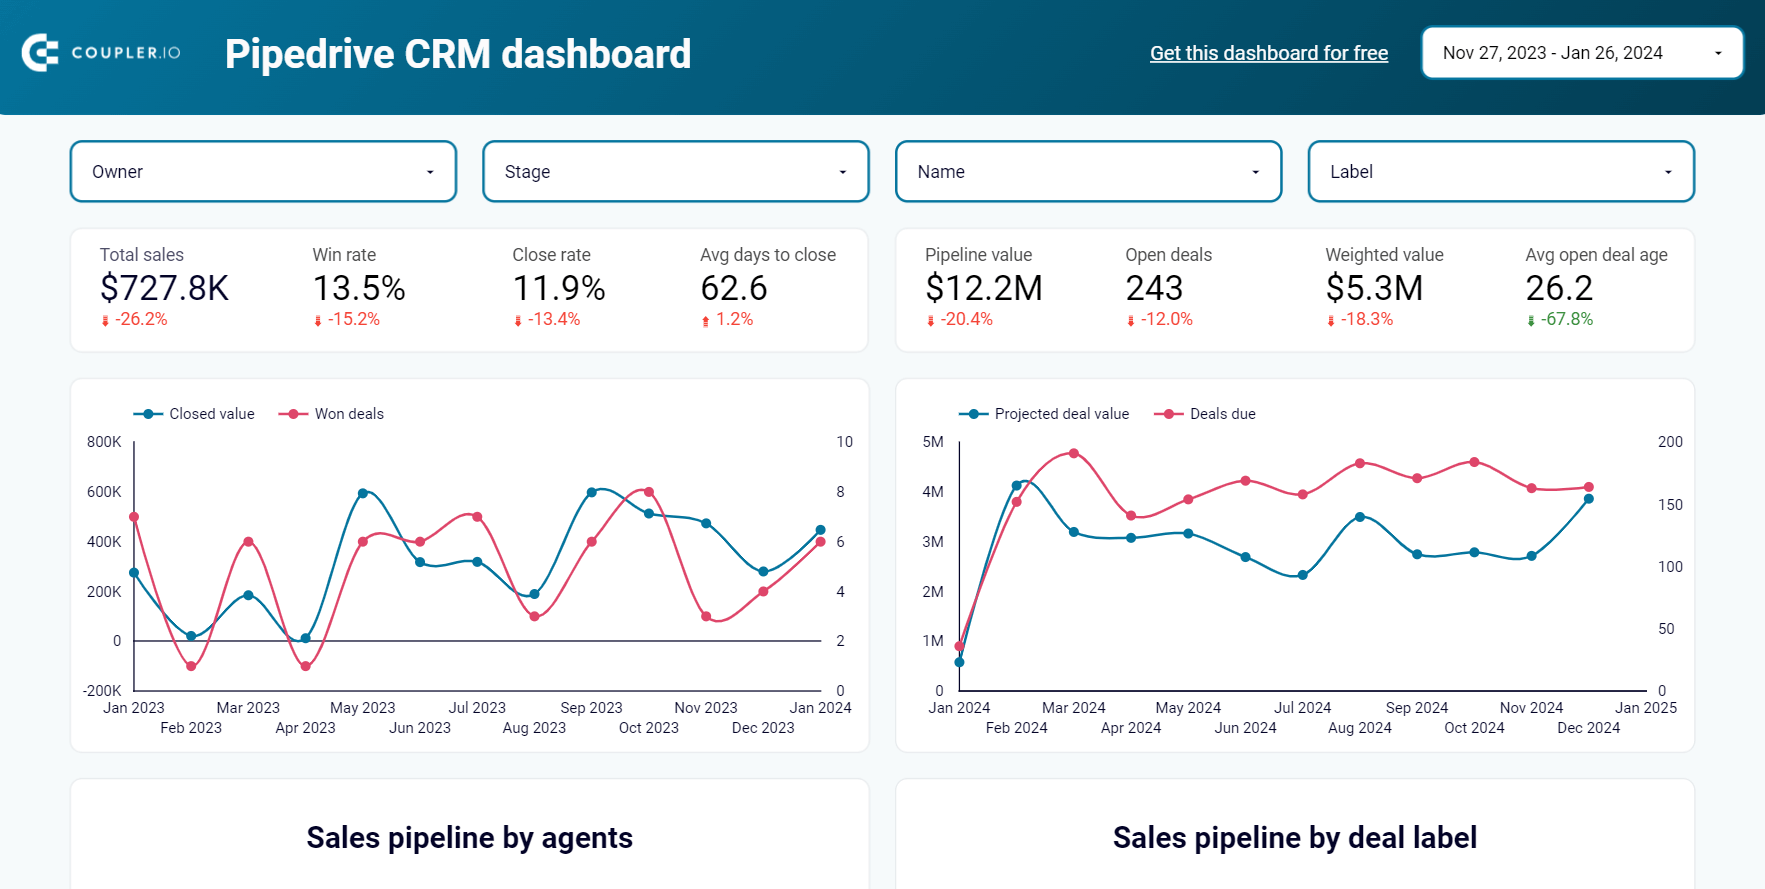
CRM dashboard for Pipedrive
Stay on top of your Pipedrive sales using our CRM dashboard which allows you to analyze your sales department’s performance.

3. Sales team performance dashboard for Salesforce
With this Salesforce report, you can analyze the efficiency of your sales team members.
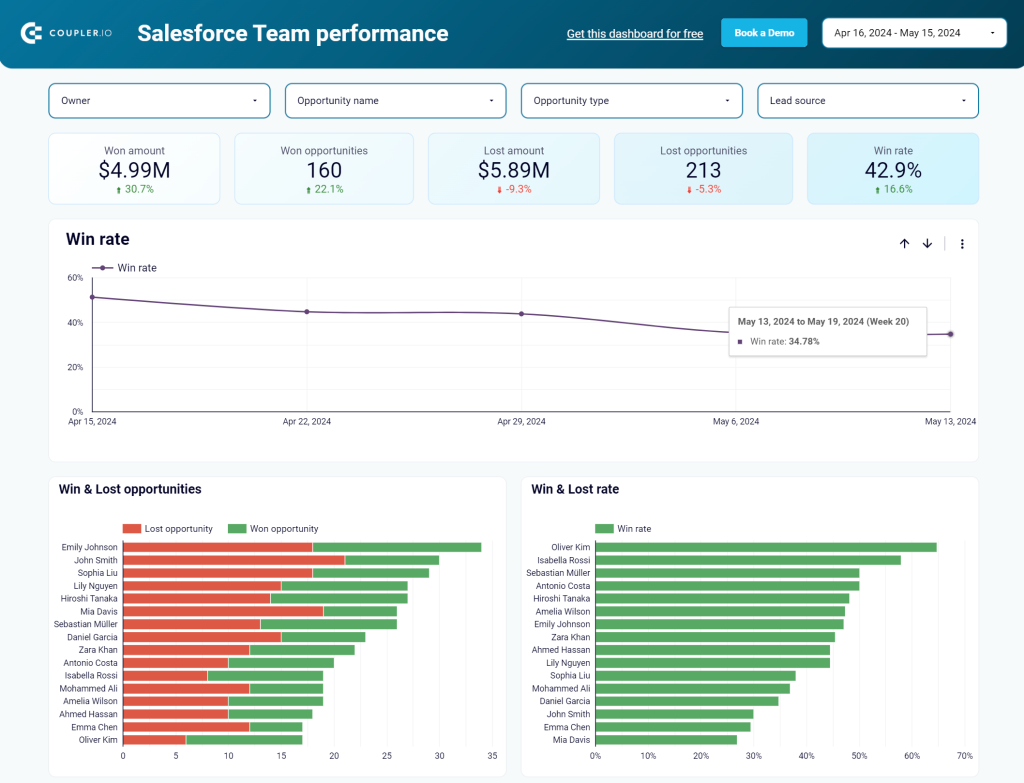
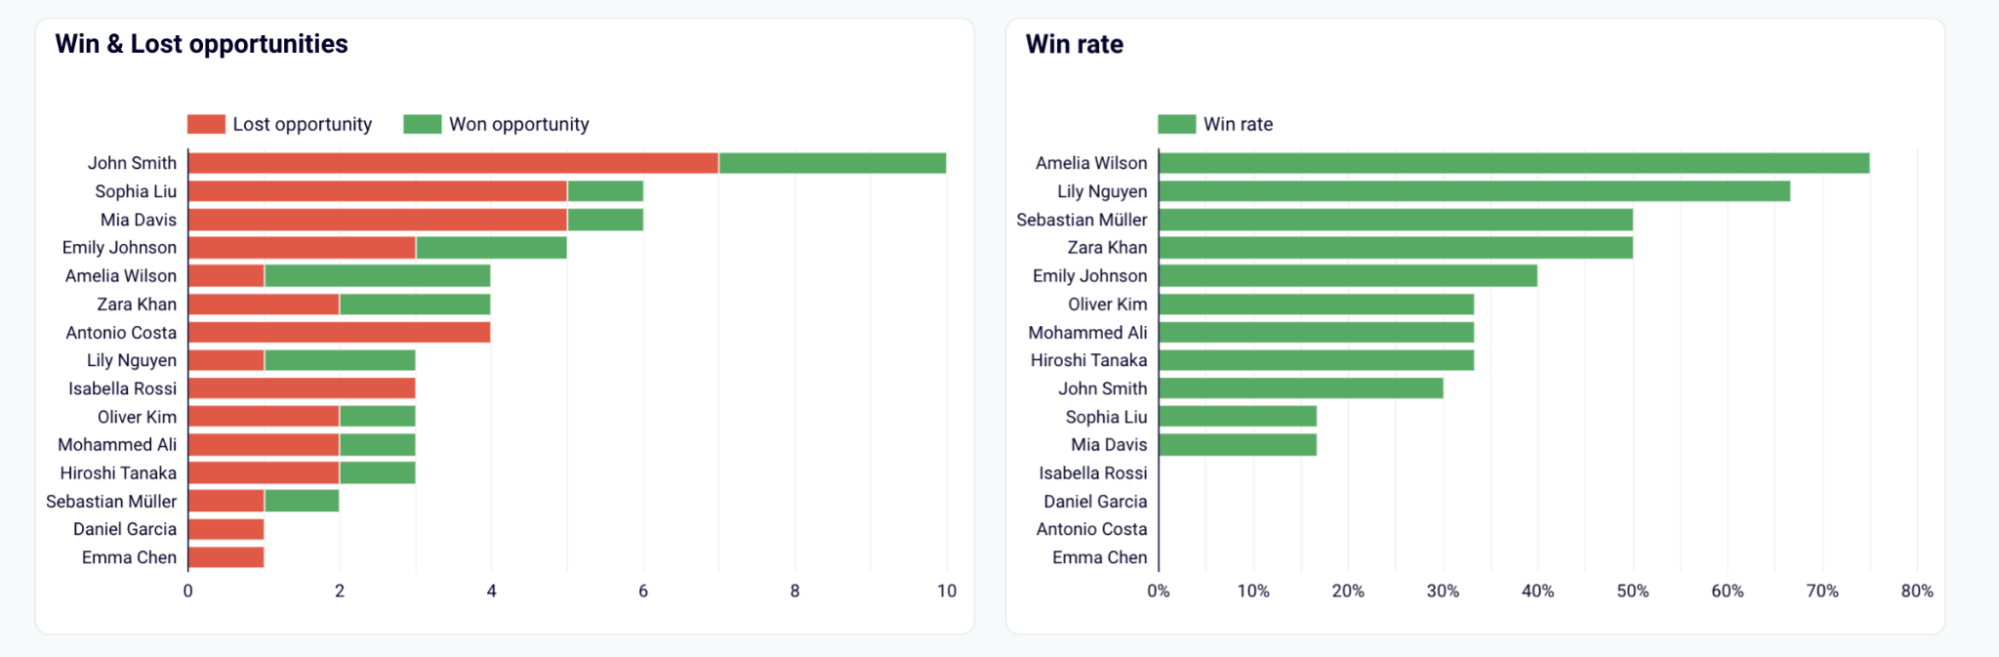
This sales team performance report for Salesforce provides a sales overview of the sales metrics, including won and lost opportunities. It also breaks down performance data for each team member. This lets you gain valuable insights into individual contributions and overall team success.
The template is available for Looker Studio and Google Sheets. Try the version that you like right away.
Sales team performance dashboard for Salesforce in Looker Studio
Get insights into your sales team’s effectiveness in converting opportunities within your sales pipeline in Salesforce.
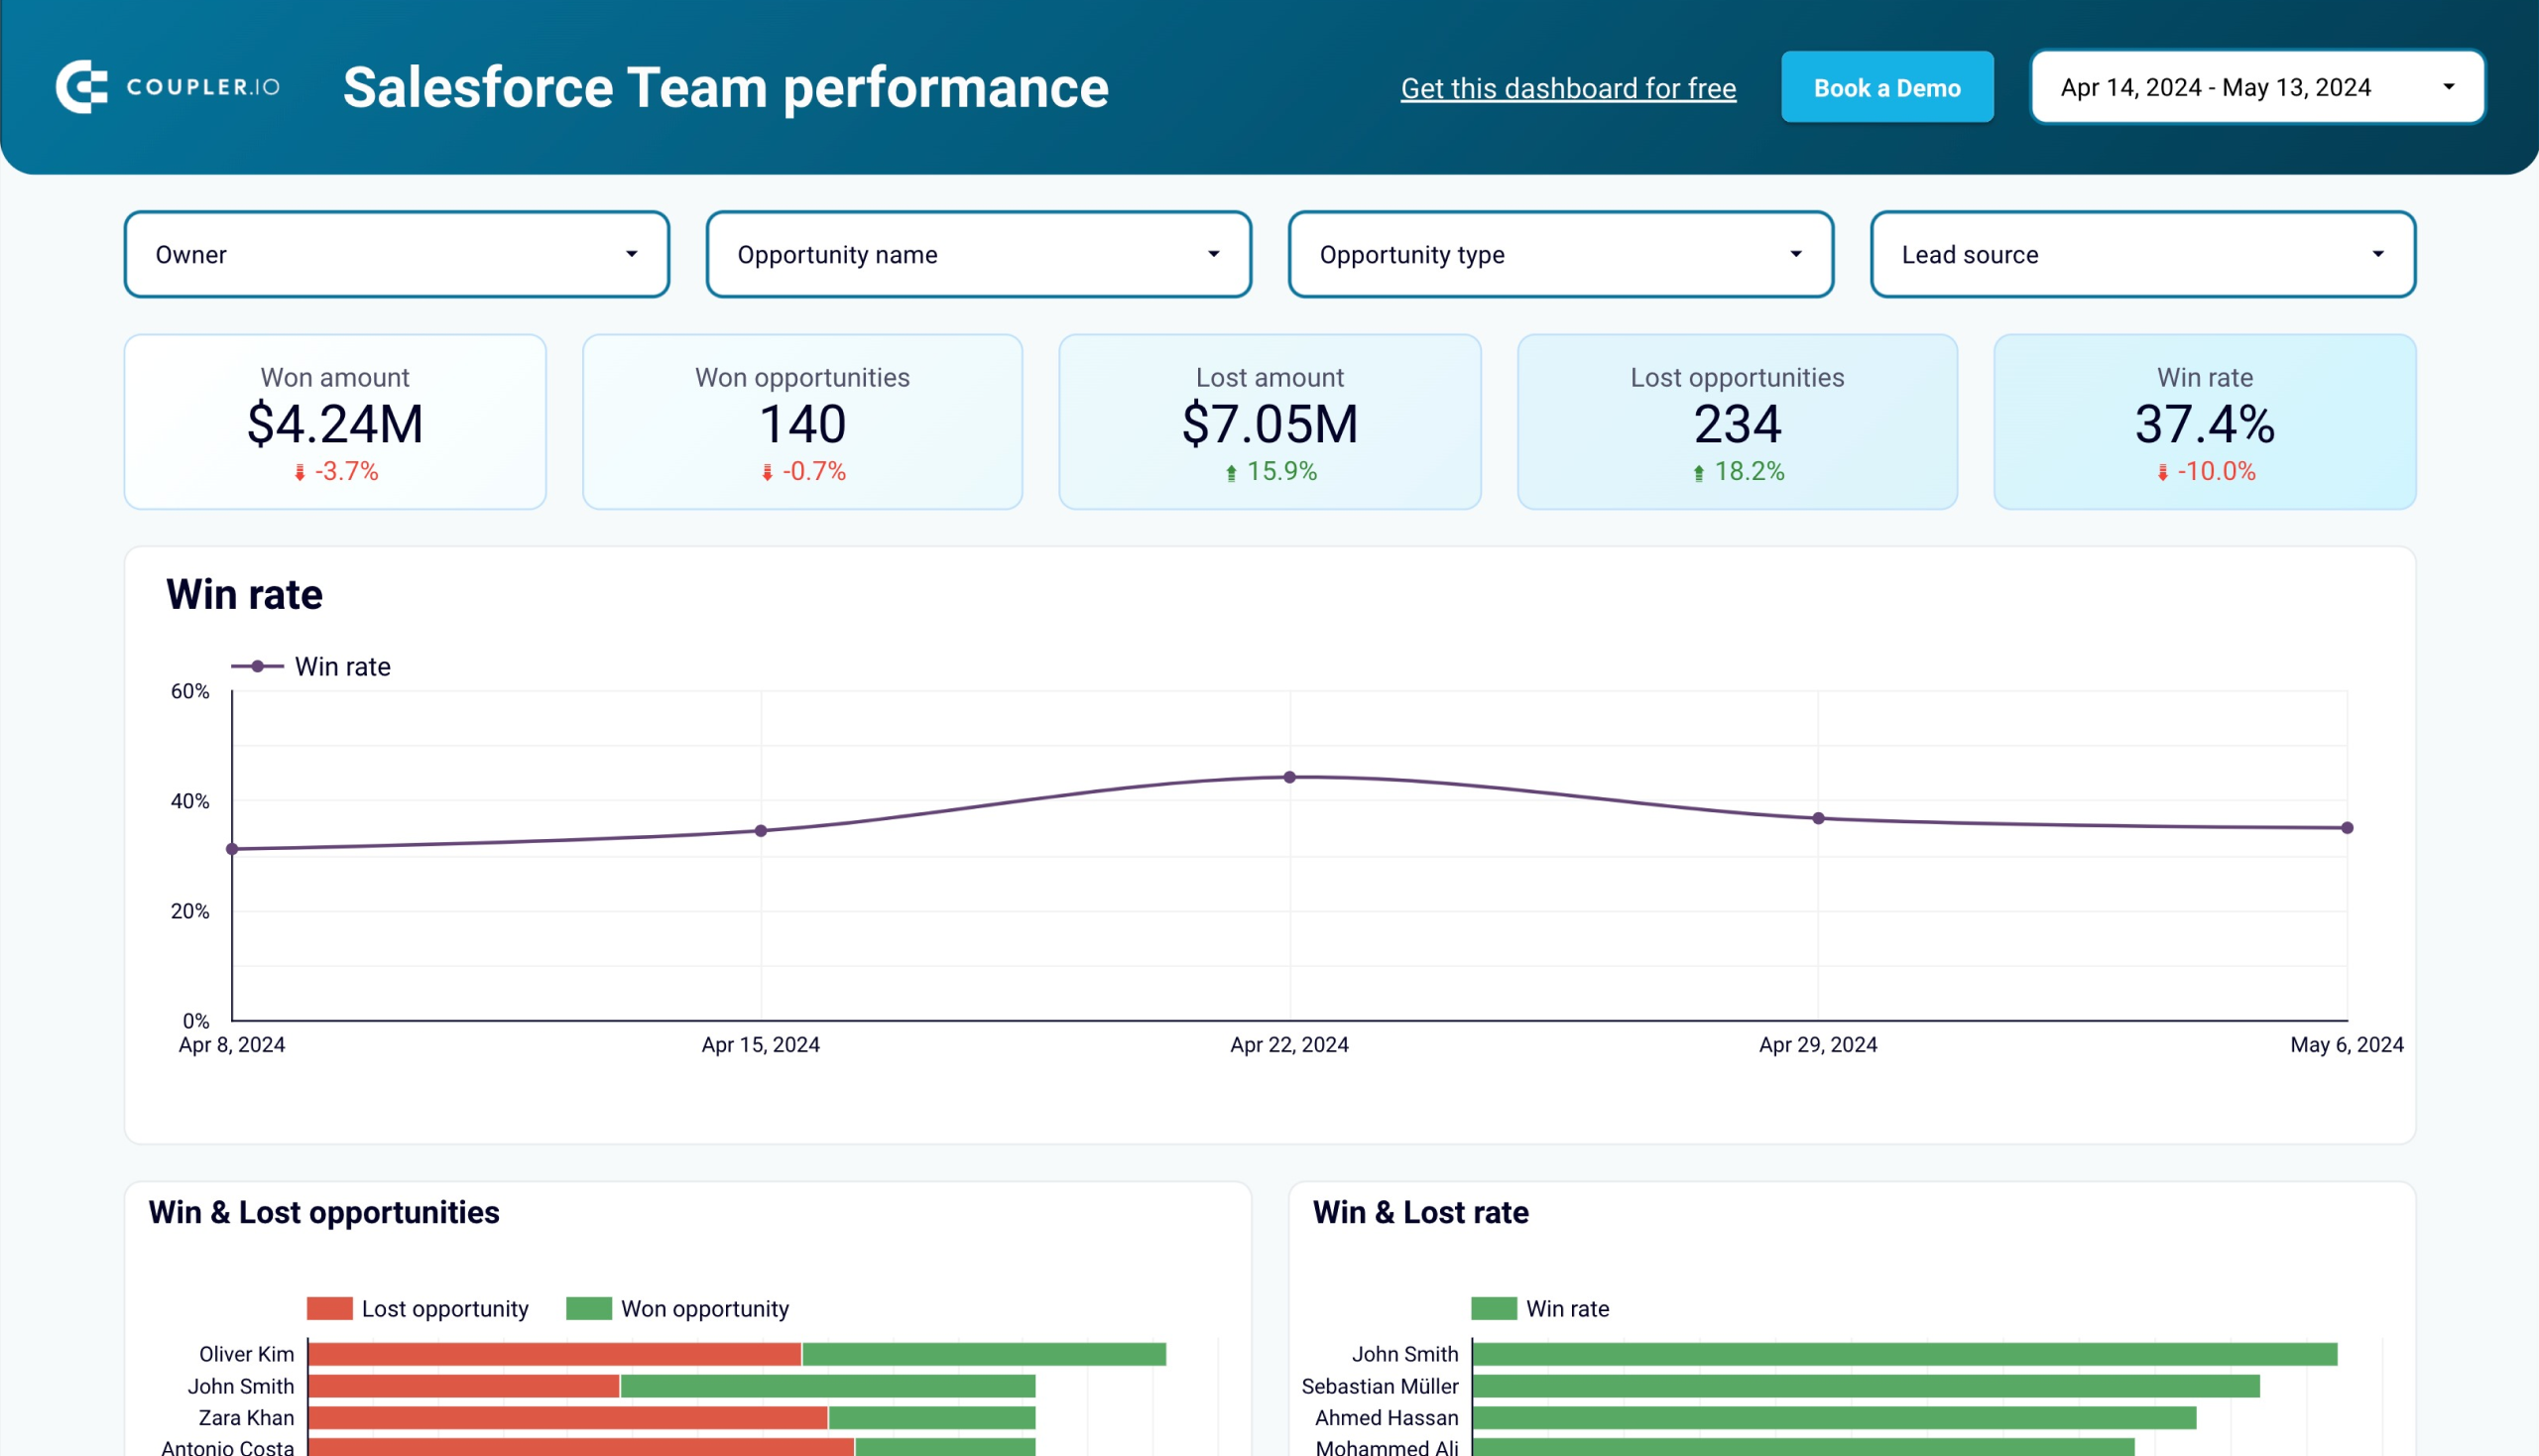
Sales team performance dashboard for Salesforce in Google Sheets
Monitor the effectiveness of your sales team and derive insights into how to optimize your sales pipeline conversions in Salesforce.
4. Salesforce win loss analysis dashboard
Our interactive Salesforce win loss analysis report provides an in-depth look at your sales outcomes.
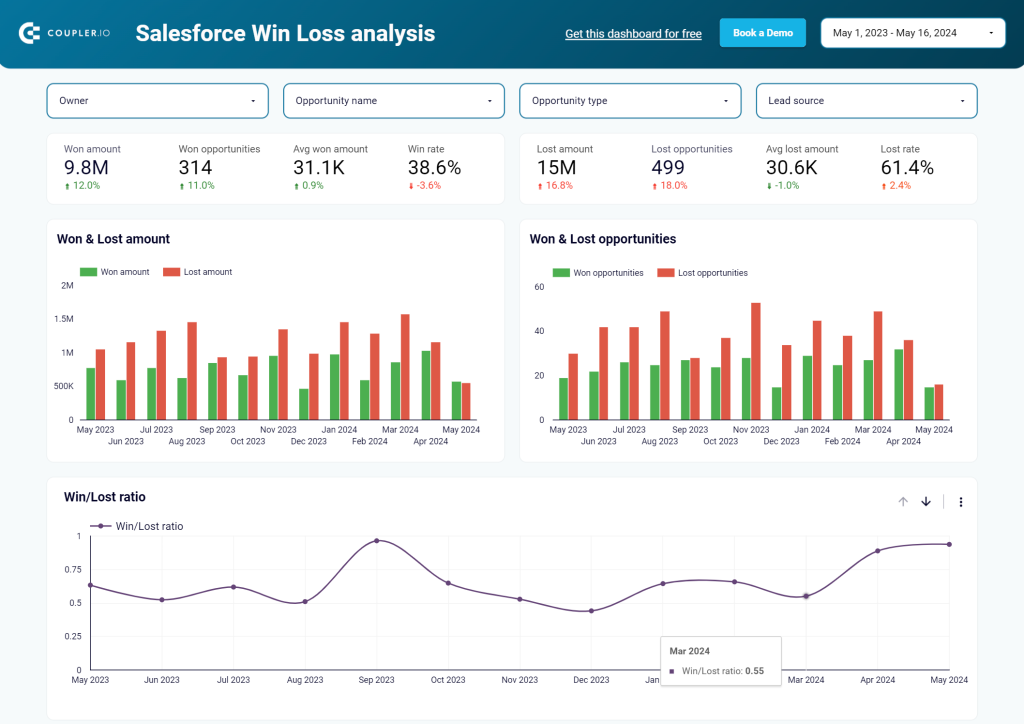
You get detailed analytics of your lost and won opportunities by amount, lead source, country, and more. These insights allow you to identify patterns, understand what drives your wins, and learn from your losses.
5. Salesforce sales analytics dashboard
This report template differs from those above since it uses data from not only Salesforce but also Google Analytics and the ad platforms you use for lead generation.
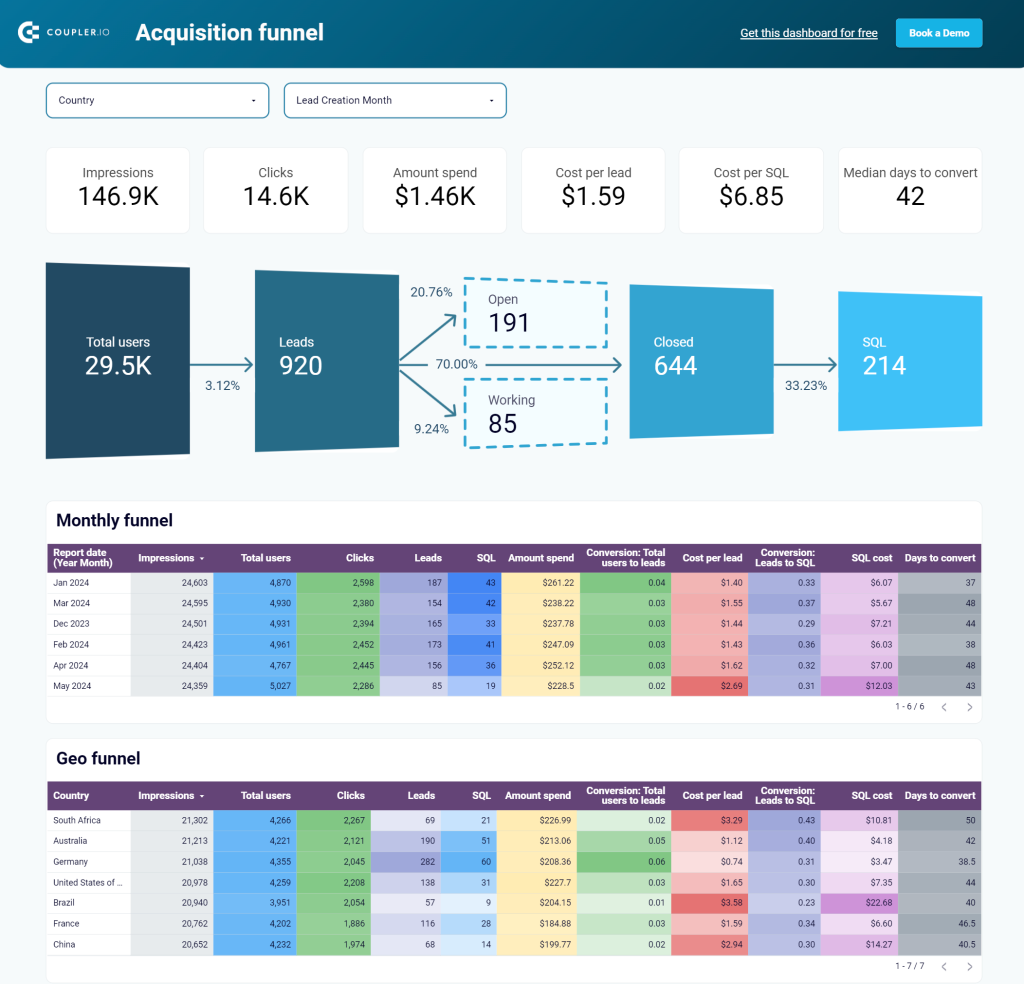
The Salesforce sales analytics dashboard gives you a comprehensive view of your sales process, from lead generation to closed deals. It breaks down win and loss data by industry, lead source, owner, country, opportunity age, and amount. You can see the top won and lost opportunities to identify patterns and areas for improvement.
What are native reports in Salesforce?
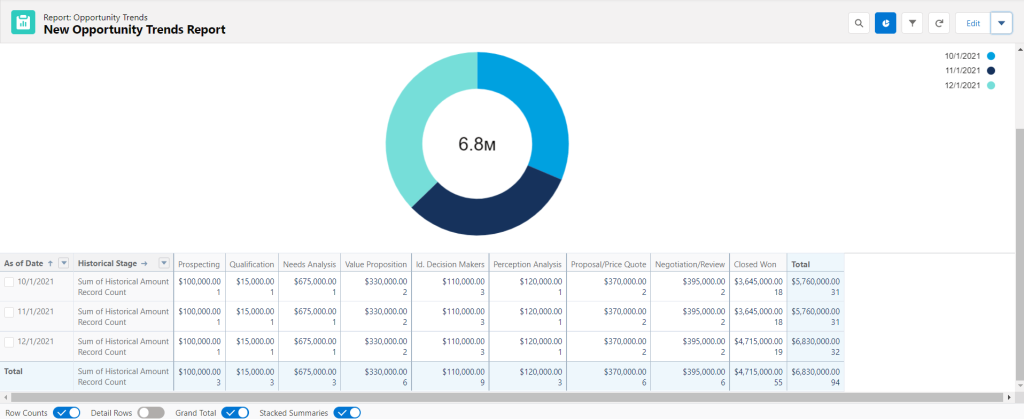
Each Salesforce report is a set of data displayed in rows and columns that you can group or filter by certain criteria. You can also visualize Salesforce reports as a chart, such as a bar chart, line chart, donut, etc. Here is what it may look like:
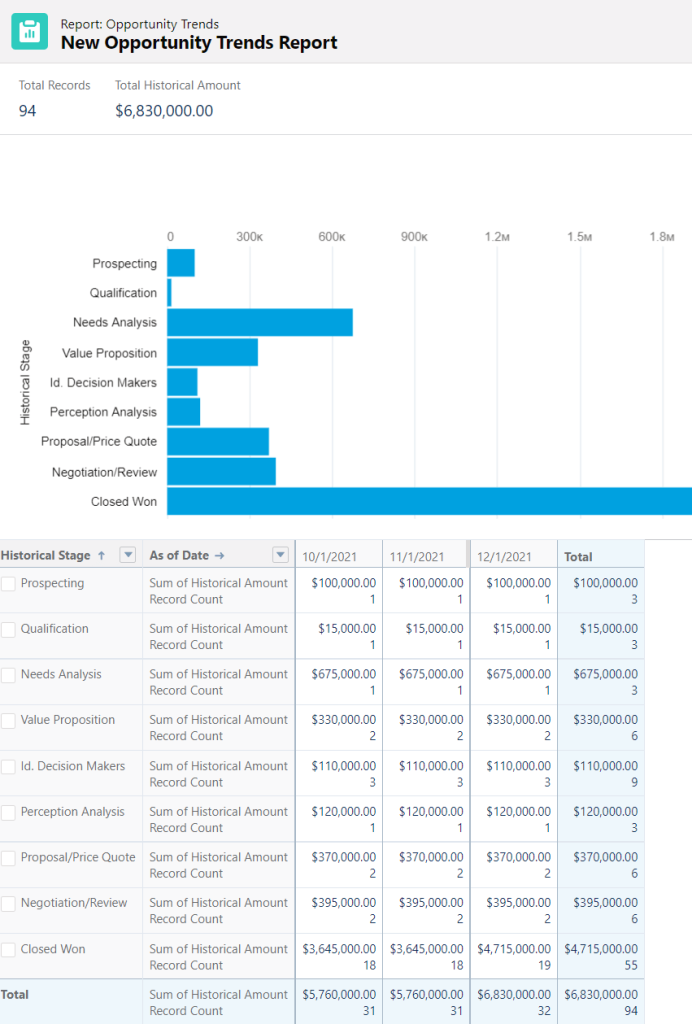
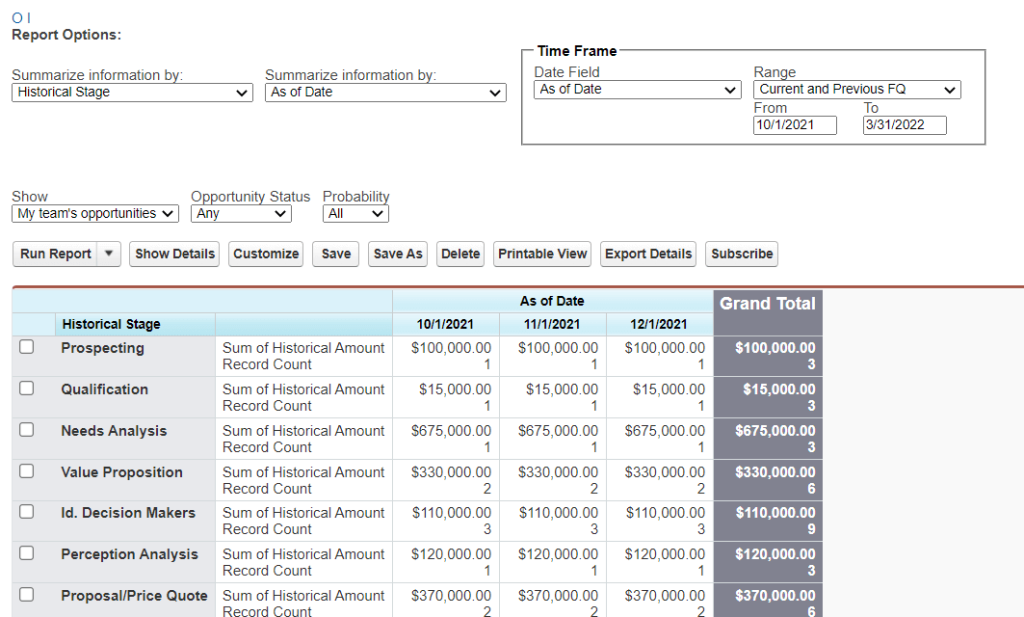
This is an example of a New Opportunity Trends report attached with a bar chart in Salesforce Lighting Experience. Angela is still using Salesforce Classic, so she should keep in mind that there are some differences between reporting in these UX versions. Here is what the same report looks like in Salesforce Classic:
Salesforce reports permissions and levels of access
An important thing that you should consider before working with reports in Salesforce is the level of access. It is a combination of user permissions to manage, create, customize, edit, run, and view reports and report folders. There are three levels of access: Manager, Editor, and Viewer.
| What it allows to do with reports in SF | Viewer | Editor | Manager |
|---|---|---|---|
| View reports in a folder | ? | ? | ? |
| See who has what level of access to the folder | ? | ? | ? |
| Save a report in the folder | ? | ? | |
| Rename a report in the folder | ? | ? | |
| Delete a report from the folder | ? | ? | |
| Manipulate the folder | ? |
Access levels determine access to the folders but not to the contents of them. For the latter, you need specific user permissions such as edit, run, etc. The level of access to a folder and permission set for the reports can be dissimilar.
For example, Angela has Manager access to the folder ‘Monthly Reports’, but her user permissions are limited to View Reports. So she can only view the reports in the folder. To edit a specific report in this folder, she would need the Edit Reports permission for this particular report.
How to create reports in Salesforce
Let’s go through the flow of creating a standard report in both Salesforce Classic and Lightning Experience. After that, we’ll also show you how to create a custom report type in Salesforce.
Salesforce reports example in Lightning Experience
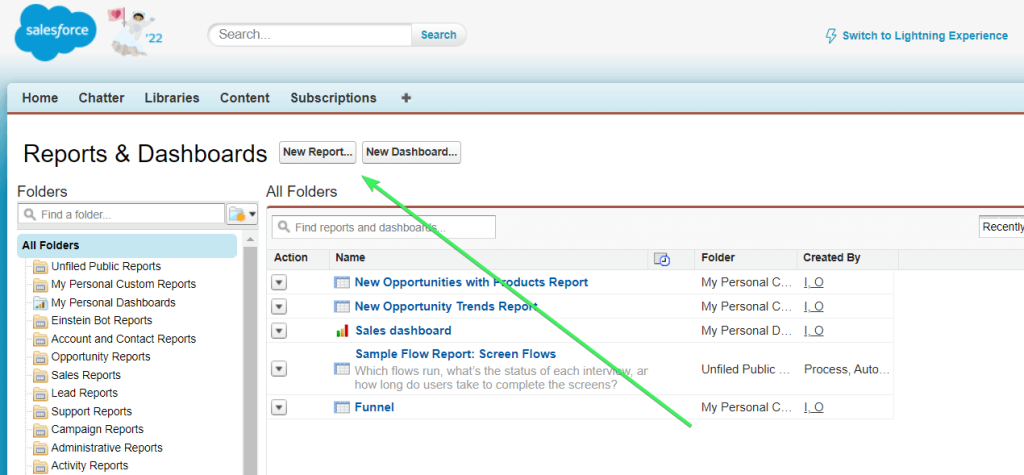
- Go to the Reports tab and click the New Report button.
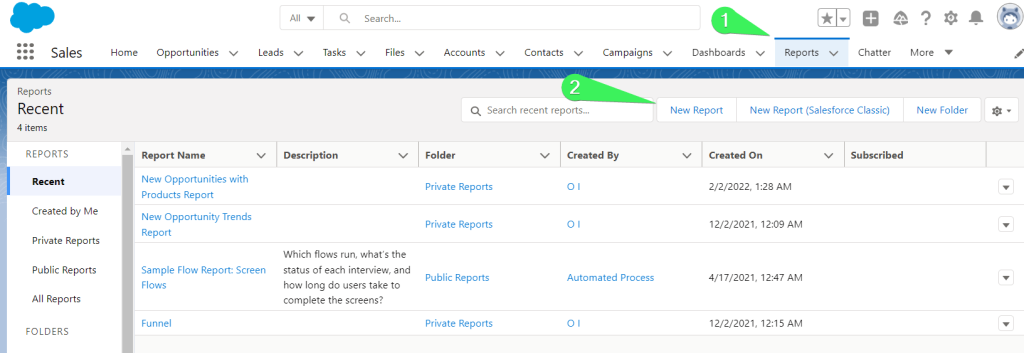
- Choose one of the standard report types and click Continue.
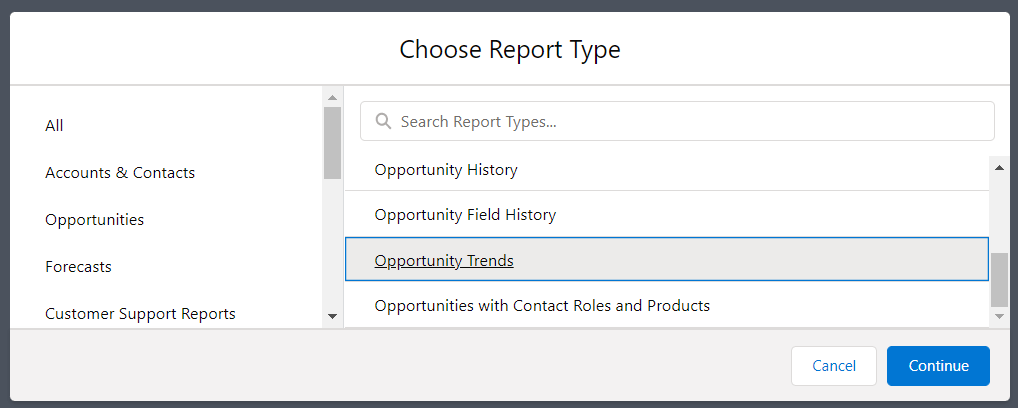
- The report editor with a draft of your report will open. You can configure the appearance of your report including:
- Add, remove, or edit filters
- Add or remove groups of data
- Add or remove columns
- Swap rows and columns
- Add a chart
- Toggle on/off row counts, detail rows, grand total, stacked summaries
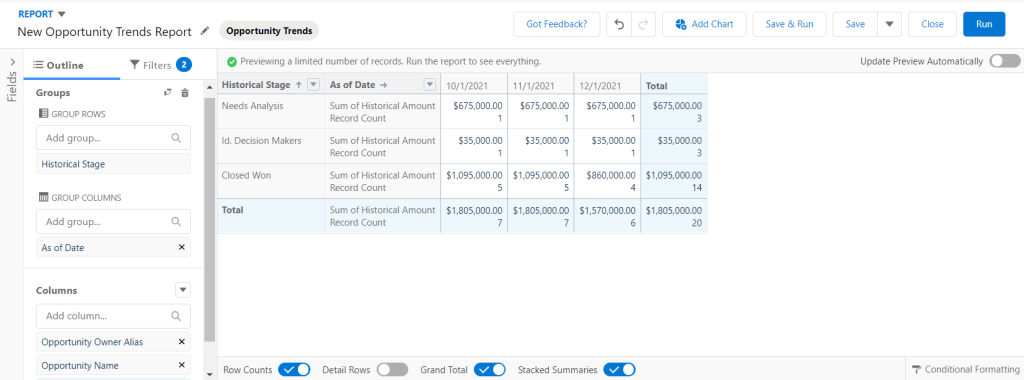
When the configuration is done, click Run. Your freshly baked Salesforce report is ready.
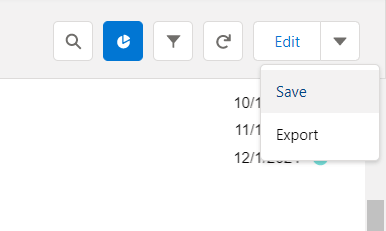
You can edit, save, or export it if necessary. These buttons are in the top right corner of the report.
Salesforce report in SF Classic
In Salesforce Classic, the flow is mostly the same.
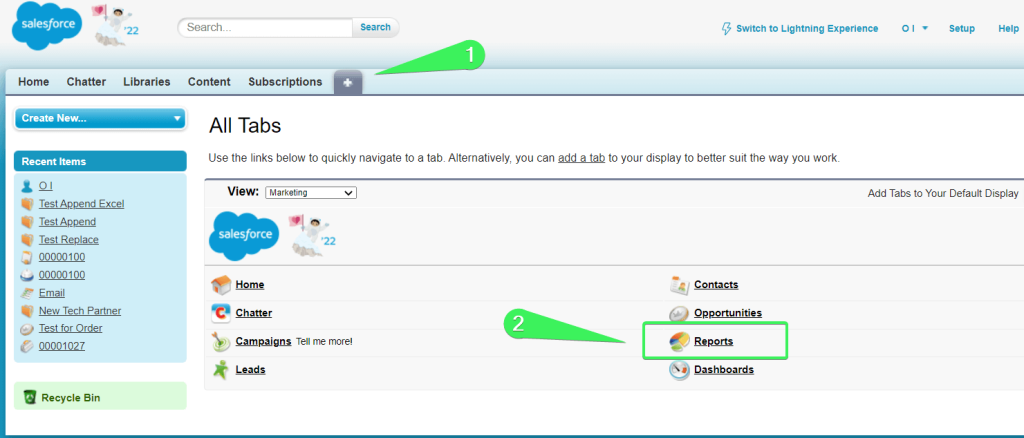
- Go to the Reports tab and click the New Report button.
Note: If you don’t see the tab on the tab bar, click + and scroll down till you find Reports.
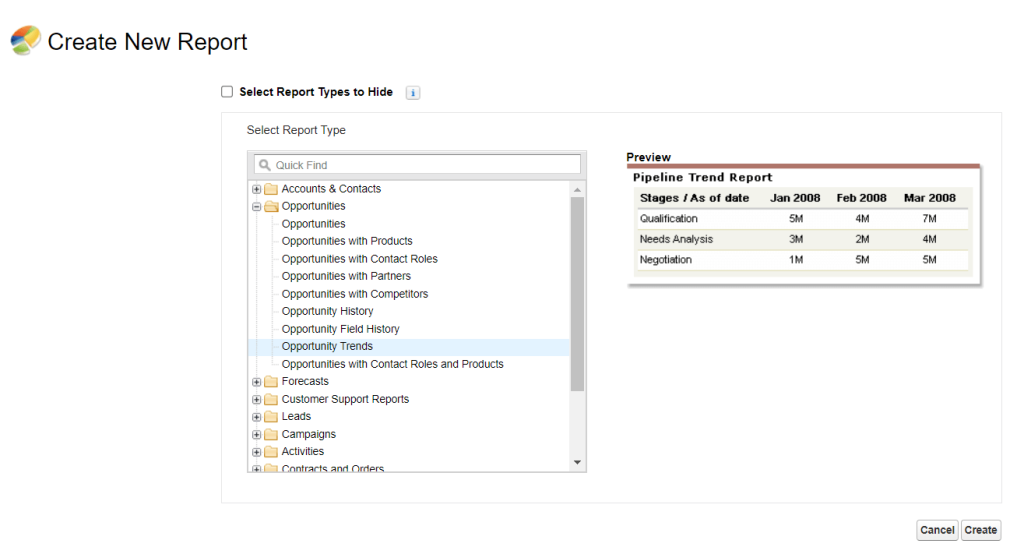
- Select the needed report type, then click Create.
- Here is what the report editor with a draft of your report looks like in Salesforce Classic.
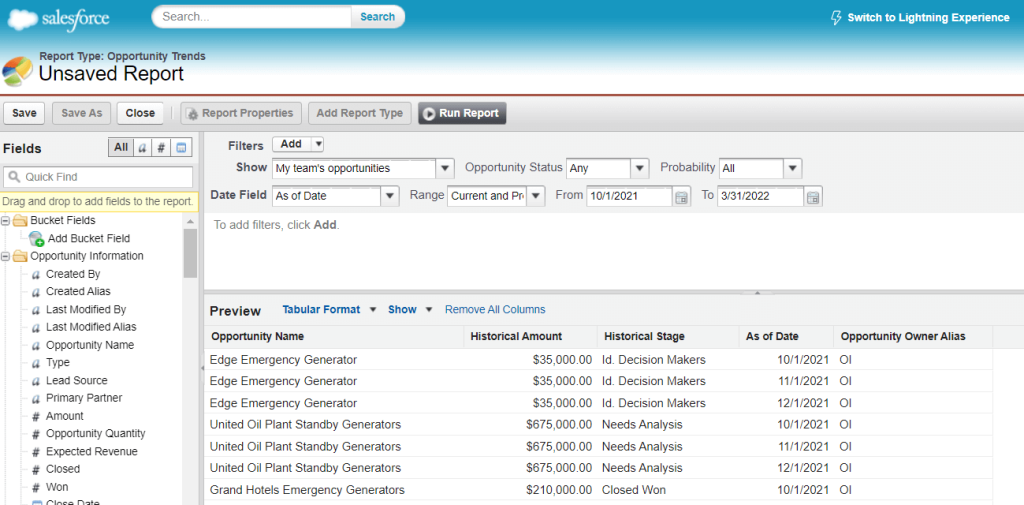
Compared to Lightning Experience, in Salesforce Classic report editor, you can choose the format for your report:
Eventually, you need to click Run Report. Here is what it may look like:
To edit the report, click Customize; to save it – click Save As; to export – choose either Printable View to export the formatted report or Export Details to export raw records.
Note: We explained the difference between these options and other information in our blog post on How to Export Salesforce Reports to Excel.
How to create custom reports in Salesforce
Now, let’s check out how you can create custom report types in Salesforce. There is not much difference in the flow between Lightning Experience and SF Classic. So, there you go:
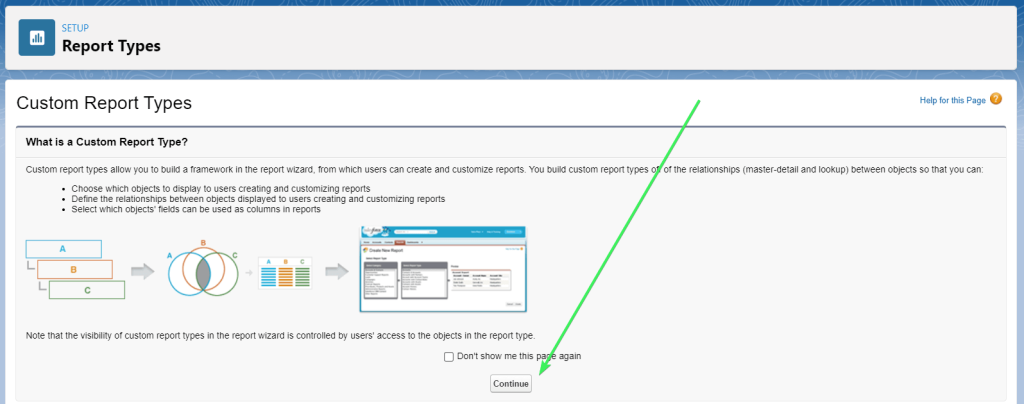
- Go to Salesforce Setup and enter Report Types in the Quick Find box.
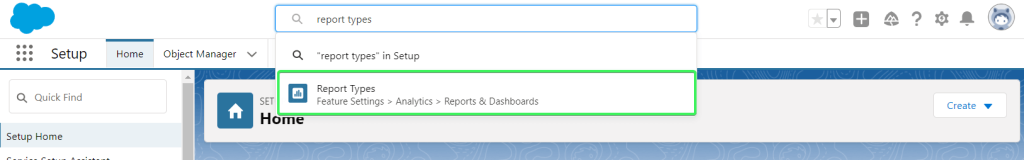
- Click Report Types, then click Continue on the Custom Report Type welcome page.
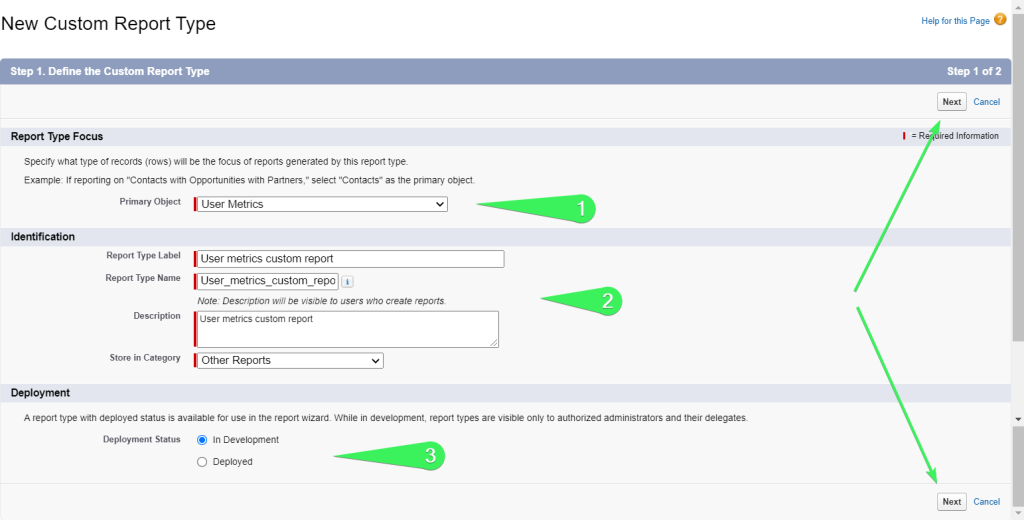
- Click New Custom Report Type, then configure it as follows:
- Define the primary object – which data will be the focus for this report type.
- Name your report type and add a description. Select the category for your custom report type
- Specify the status for your custom report type: deployed or in development.
Click next to proceed to the next step.
- Define other objects related to your primary object within this custom report type. It is okay if no related objects are available for your primary object. However, it’s possible to build a tree of multiple related objects like this:
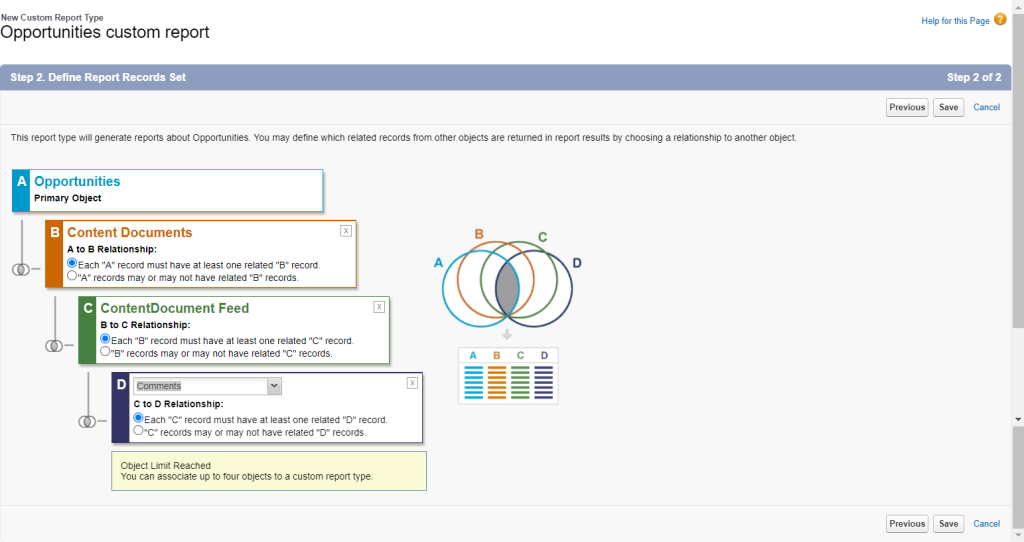
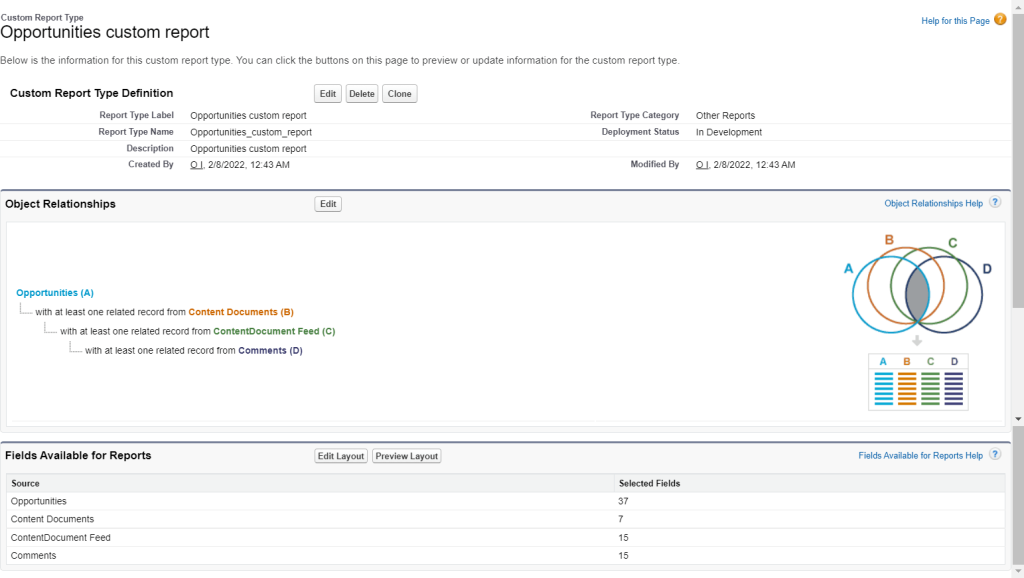
In the end, click Save – you’ll see the information for your custom report type.
If the customization offered by Salesforce is not enough for your needs, try external reporting using templates or reports built in spreadsheets or BI tools.
What are Salesforce report formats available?
When building reports in the Lightning Experience, the report format is updated automatically.
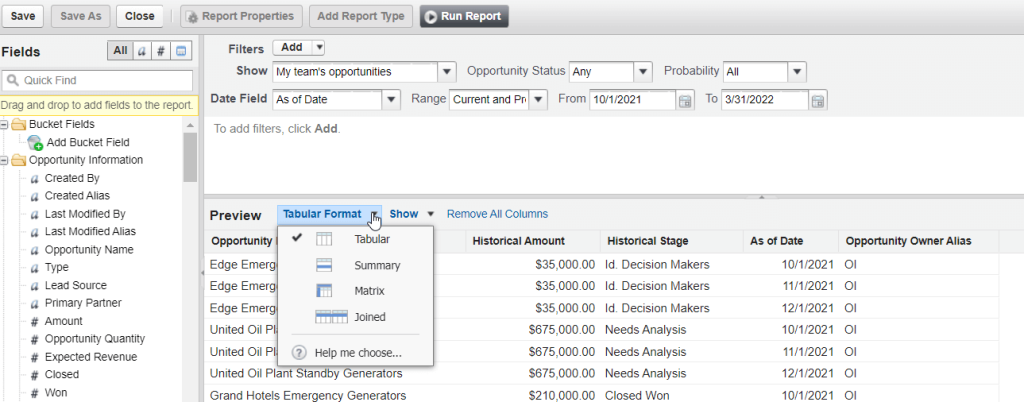
However, in Salesforce Classic, you need to choose the report format from the following options:
- Tabular
- Summary
- Matrix
- Joined
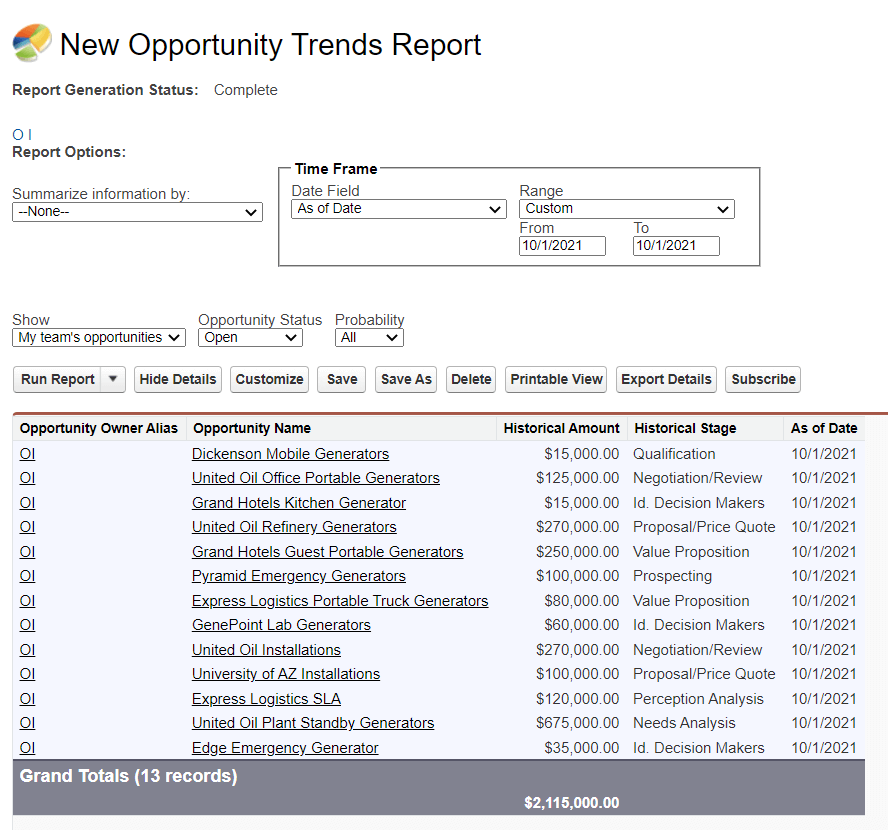
Tabular report Salesforce
The tabular format is an ordered set of columns and rows like a regular spreadsheet. You can’t use tabular reports to group data, create charts, or in dashboards unless there is a limited number of rows.
Here is an example of the New Opportunity Trends report in tabular format.
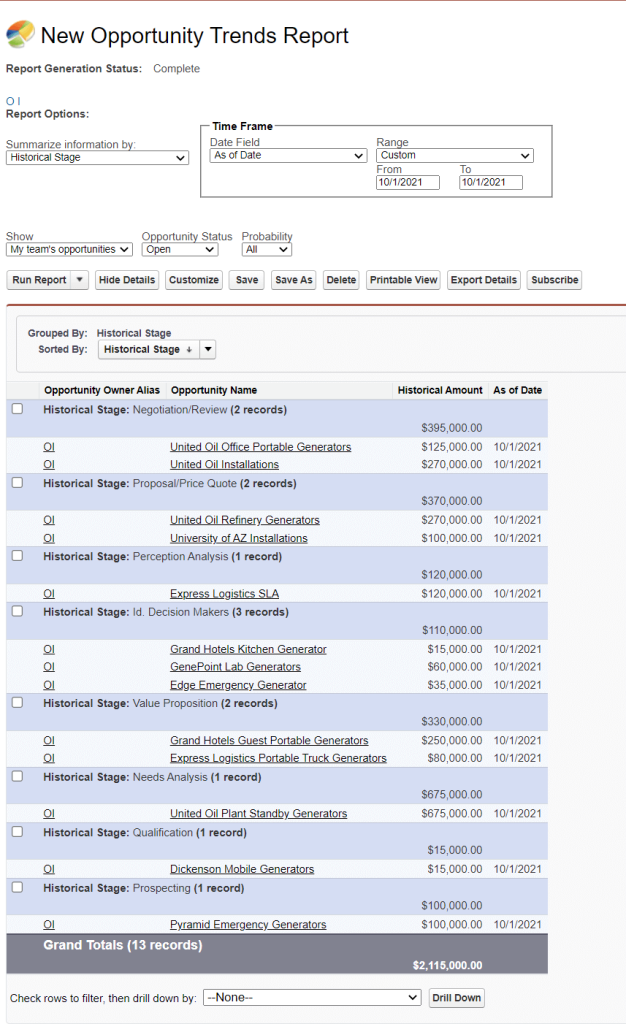
Summary report Salesforce
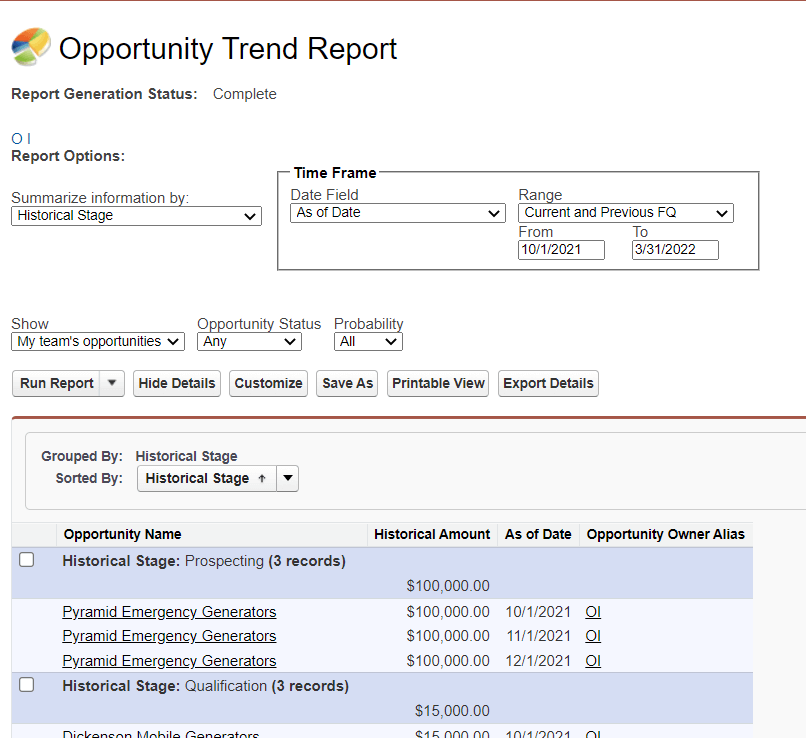
The summary format is an enhanced tabular format that allows you to group rows of data, show subtotals, and even create charts.
Here is an example of the New Opportunity Trends report in summary format with the data grouped by Historical Stage.
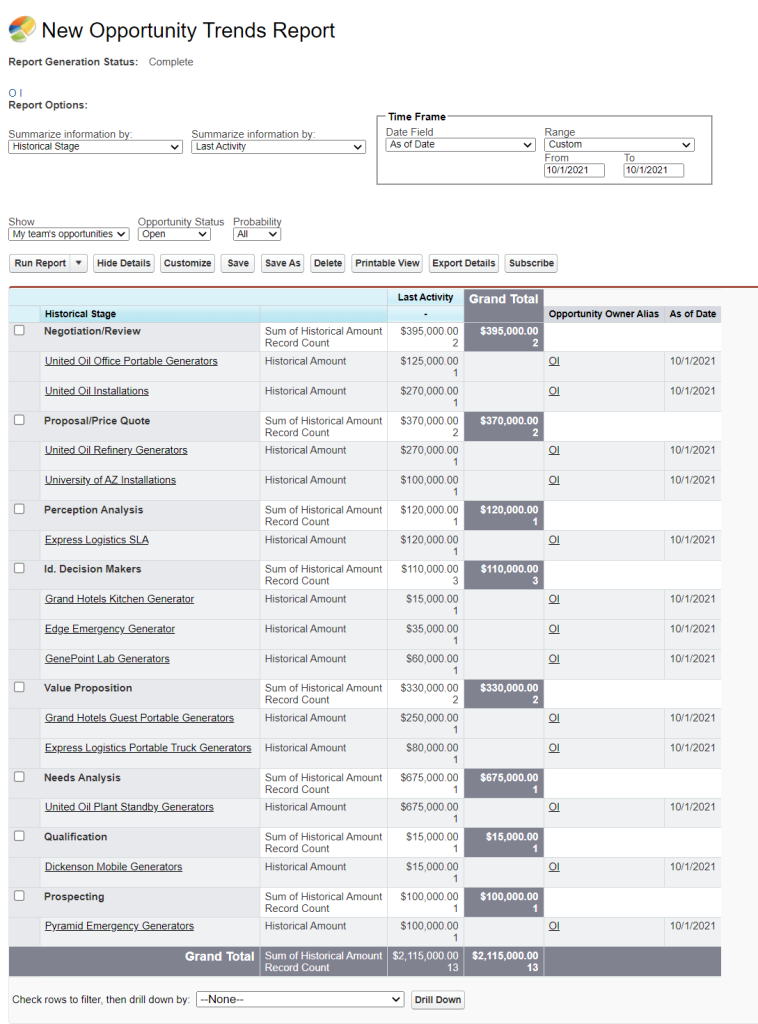
Matrix report Salesforce
The matrix format is an enhanced summary format 🙂 The enhancement is that matrix reports allow you to group data by rows and columns.
Here is an example of the New Opportunity Trends report in a matrix format with the data grouped by Historical Stage and Last Activity.
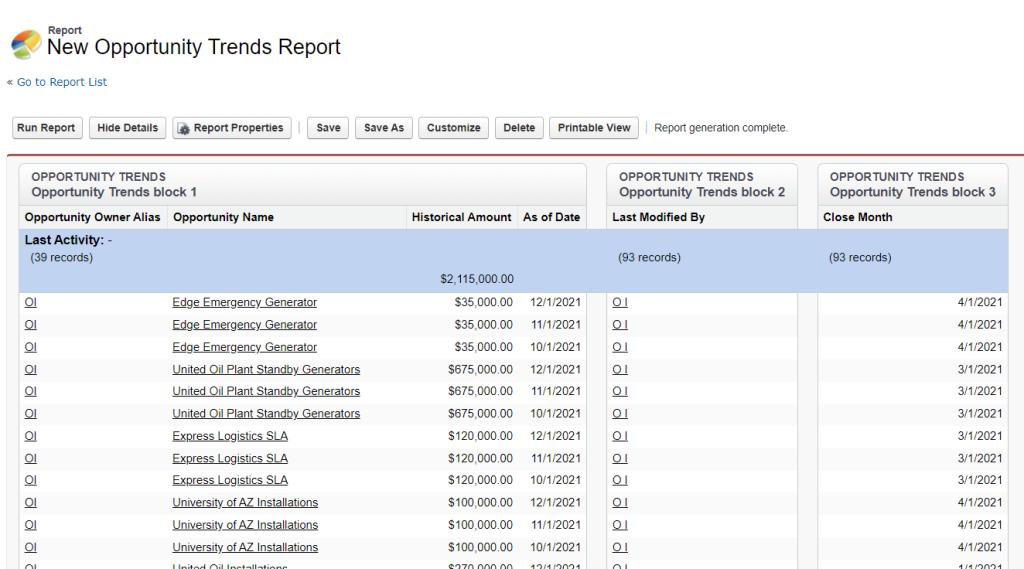
Salesforce joined reports
Note: Available only for Enterprise, Performance, Unlimited, and Developer Editions.
The joined format of reports in Salesforce allows you to add multiple blocks to your report. Each block has its fields, columns, sorting, and filtering. Joined reports can even contain data from different report types.
Here is an example of the New Opportunity Trends report in the joined format.
Just to remind you that choosing reports formats is only possible in Salesforce Classic. For the Lightning Experience, your report format will be assigned automatically. On the other hand, the type of report is what you’ll need to select regardless of the UI version you use.
What Salesforce report types you can consider
Standard reports in Salesforce
Salesforce offers out-of-the-box templates for reporting called report types. Each template corresponds to a particular set of data and columns to order this data. There are different types of reports grouped into several categories:
| Category | Salesforce standard report types |
|---|---|
| Accounts & Contacts | – Accounts – Contacts & Accounts – Accounts with Partners Other Salesforce Account & Contacts reports– Account with Account Teams– Accounts with Contact Roles – Accounts with Assets – Contacts with Assets – Account History – Contact History – D&B Company with and without Accounts |
| Activities | – Tasks and Events – Events with Invitees – HTML Email Status Other Salesforce activity reports– Activities with Accounts– Activities with Contacts – Activities with Opportunities – Activities with Leads – Activities with Campaigns – Activities with Cases – Activities with Solutions – Activities with Contracts – Activities with Products – Activities with Emotions |
| Administrative Reports | – Users – Reports – Documents Other Salesforce administrative reports– New Login Locations– Identity Verification Methods – Collaboration Group Report – Collaboration Group Feed Posts Report |
| Campaigns | – Campaigns – Campaigns with Contacts – Campaigns with Leads Other Salesforce campaign reports– Campaigns with Opportunities– Campaigns with Campaign Members – Campaigns with Leads and Converted Lead Information – Campaigns with Influenced Opportunities |
| Contracts and Orders | – Contracts – Contract History – Contracts with Orders Other Salesforce contracts and orders reports– Contracts with Orders and Products– Contracts with Contact Roles – Orders – Orders with Products – Orders History |
| Customer Support Reports | – Cases – Case Lifecycle – Cases with Contact Roles Other Salesforce customer support reports– Cases with Assets– Cases with Solutions – Case History – Cases with Milestones – Solutions – Solution Categories – Solution History |
| File and Content Reports | – Content Report – Library and User Report – File and Content Report |
| Forecasts | You can add custom Salesforce Forecast reports. |
| Individuals | – Individual – Individual History |
| Leads | – Leads – Leads with converted lead information – Lead History |
| Opportunities | – Opportunities – Opportunities with Products – Opportunities with Contact Roles Other Salesforce opportunity reports– Opportunities with Partners– Opportunities with Competitors – Opportunity History report Salesforce – Opportunity Field History – Opportunity Trends – Opportunities with Contact Roles and Products |
| Price Books, Products, and Assets | – Products – Products with Opportunities – Price Books with Products Other Salesforce price books, products, and assets reports– Products with Assets– Assets – Assets with Cases |
| Other Reports (Screen Flows) | – Emotions – Screen Flows |
Note: The exact collection of standard Salesforce report types may differ.
Salesforce custom report type
A custom report type is an option to customize reporting in Salesforce. It’s rather helpful if a standard report type does not provide you with the columns you need, or if you want to have a custom view of standard objects. We’ll explain how you can create custom report types in Salesforce in the following sections.
How you can make scheduled reports in Salesforce
Report scheduling in Salesforce allows you to:
- Set up a run frequency of your reports on a daily, weekly, or monthly basis
- Email reports to your Salesforce users on a set schedule
Note: Manage, Create, and Edit user permissions allow you to schedule reports.
How to schedule reports in Lightning Experience
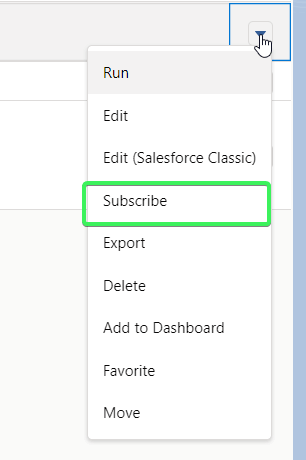
- Go to the Reports tab, click on the More Action arrow, and select Subscribe.
- Configure the schedule and add recipients and conditions if required.
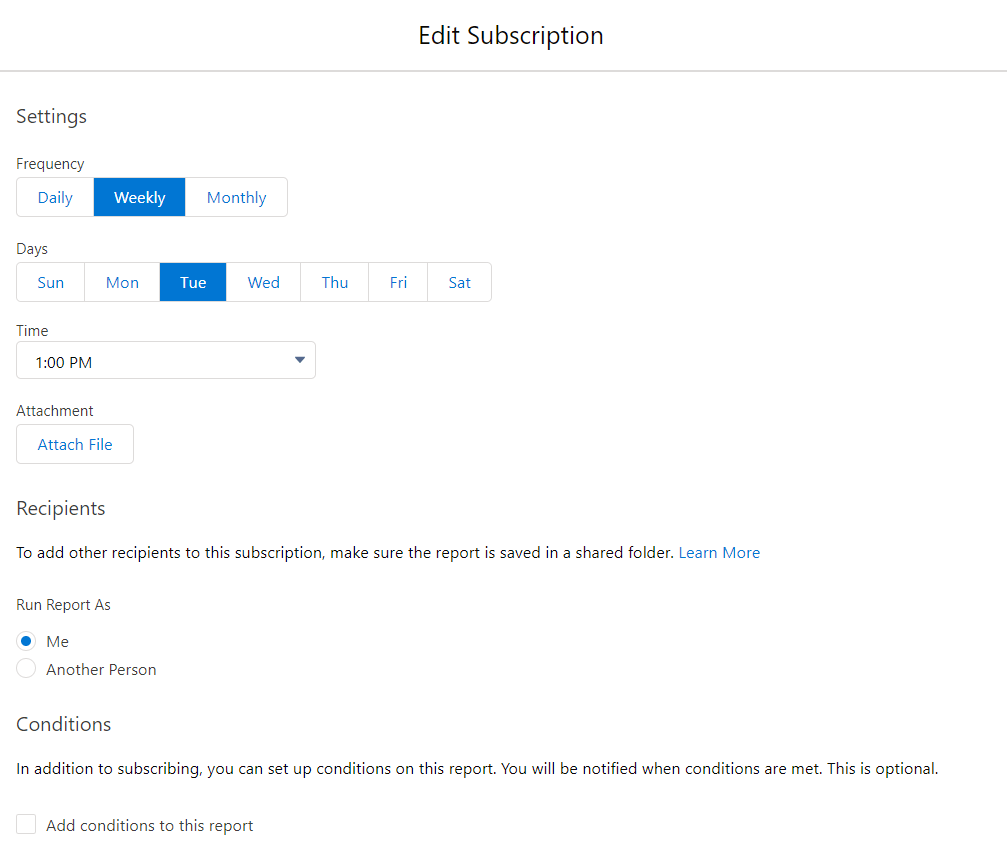
To be able to email a report to recipients, it must be:
- Stored in a shared folder
- The folder with the report must be shared with the required recipients
- Recipients are Salesforce users authorized to your account
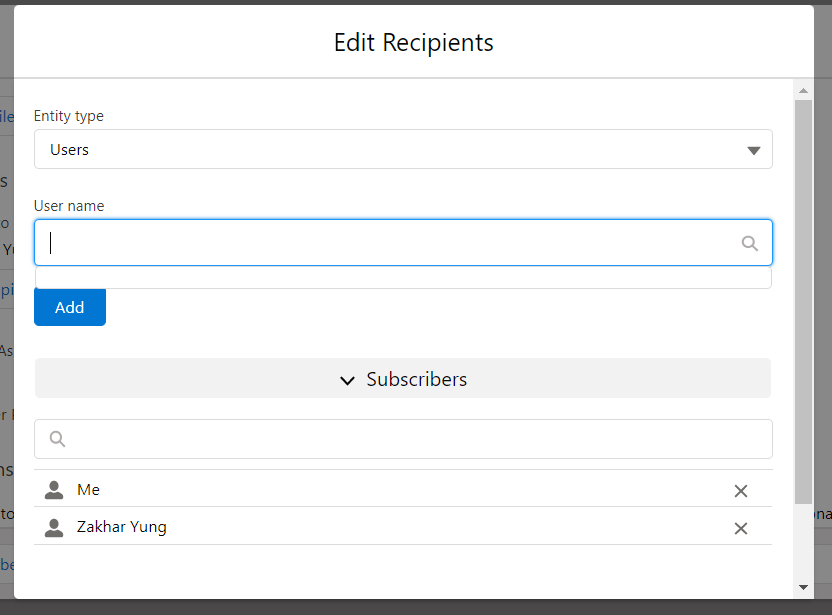
If these conditions are met, you’ll have the Edit Recipients button active and be able to add and remove recipients.
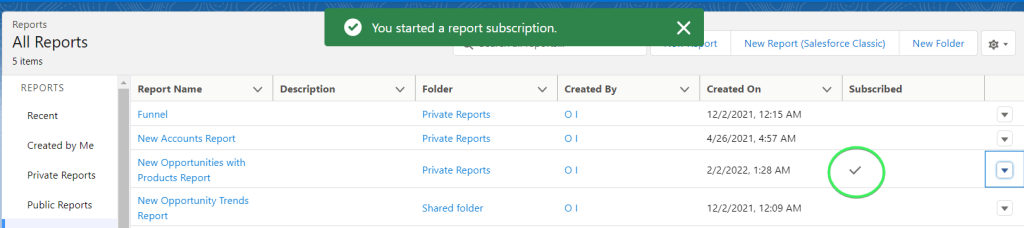
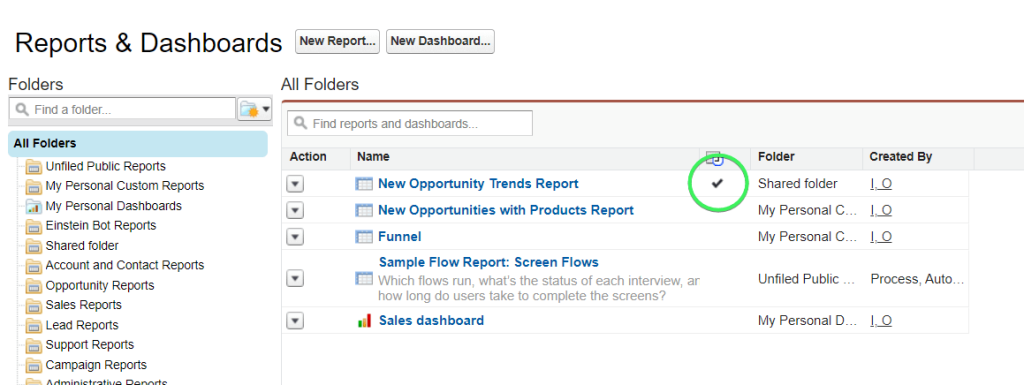
Once you have configured the schedule for your report, click Save. You’ll see a checkmark under the Subscribed column.
How to schedule reports in Salesforce Classic
- To enable scheduling in Salesforce Classic, first, you need to run your report. After that, you’ll have the Schedule Future Runs… option under the Run Report button. Click on it.
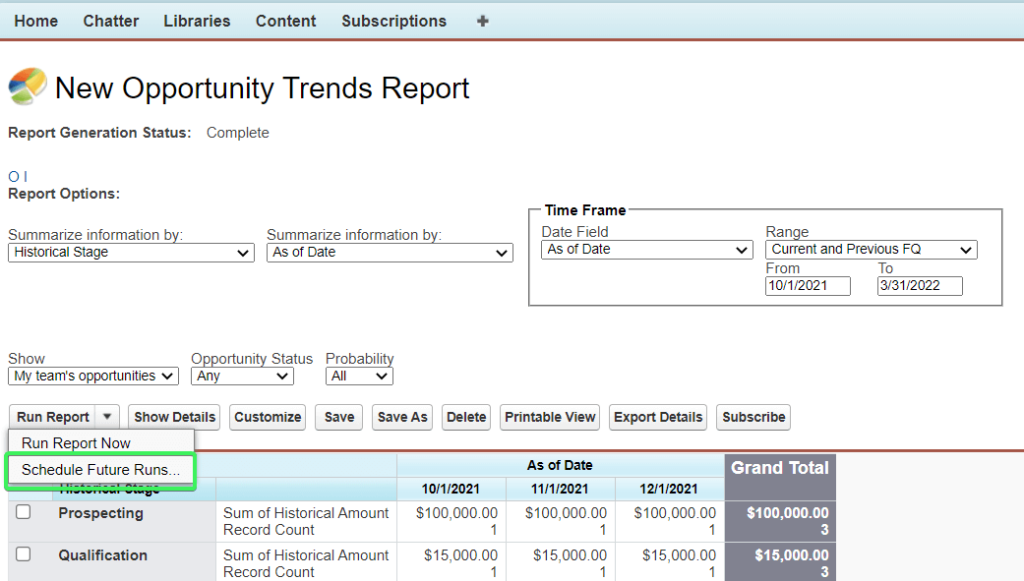
- Set up the schedule for your report and add the recipients for it. Click Save Report Schedule.
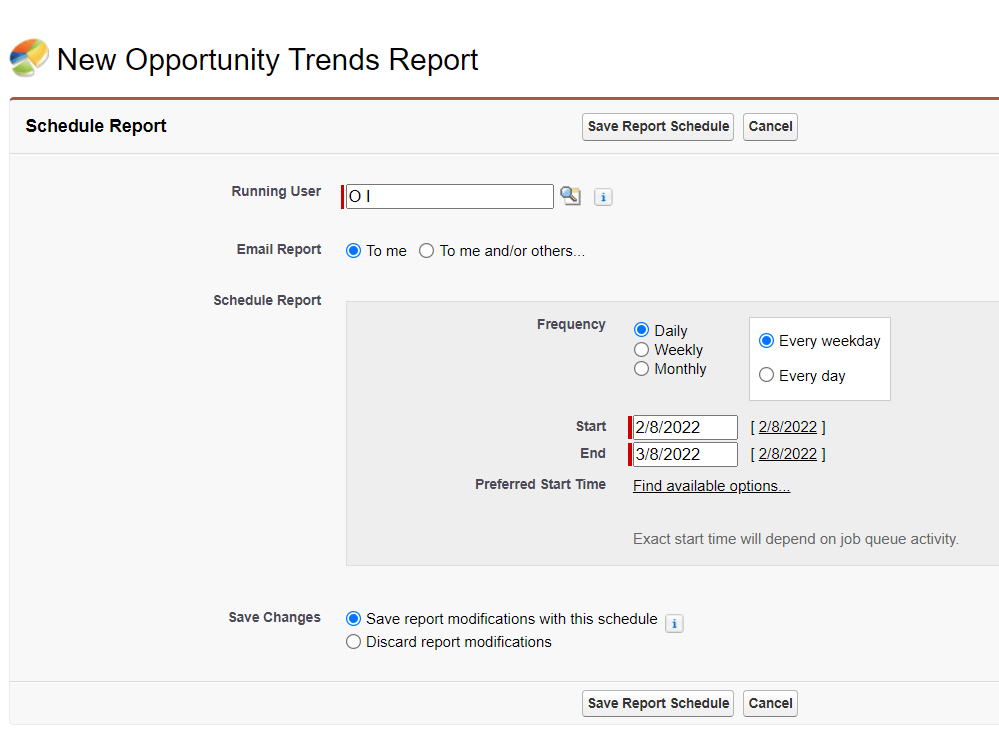
Scheduling has been enabled!
How you can create custom reports outside Salesforce
The custom report templates that we’ve introduced at the beginning of the article are equipped with the connector by Coupler.io. It’s a reporting automation platform that lets you turn raw business data into meaningful reports. Using it, you can export Salesforce data to spreadsheets and BI tools where you want to build your custom reports.
Try it yourself right away! Select the desired destination app in the form below and click Proceed. You’ll be offered to create a Coupler.io account for free. Then complete three simple steps:
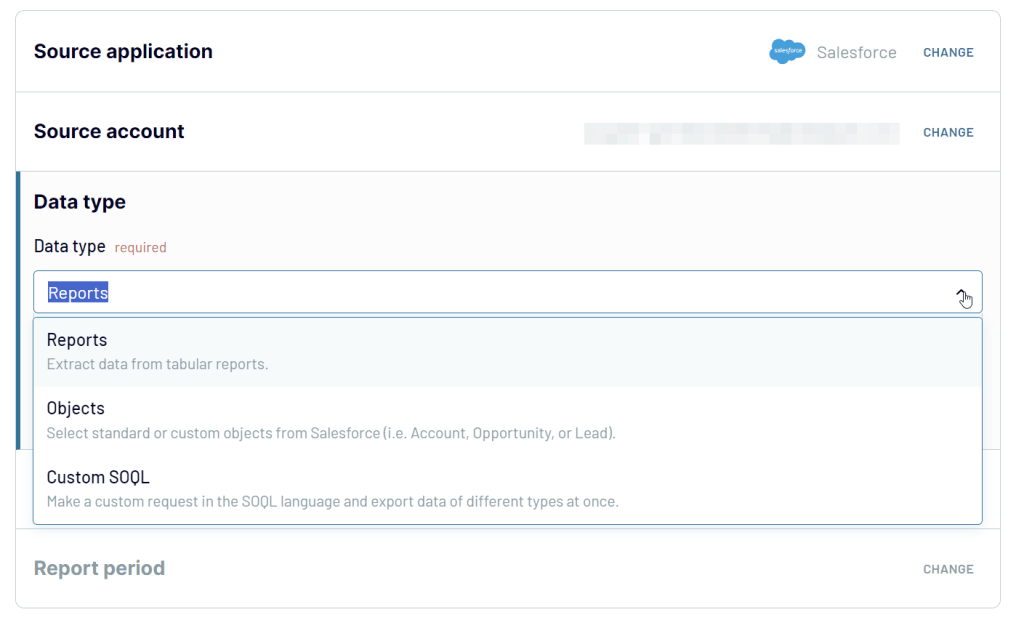
1. Collect data
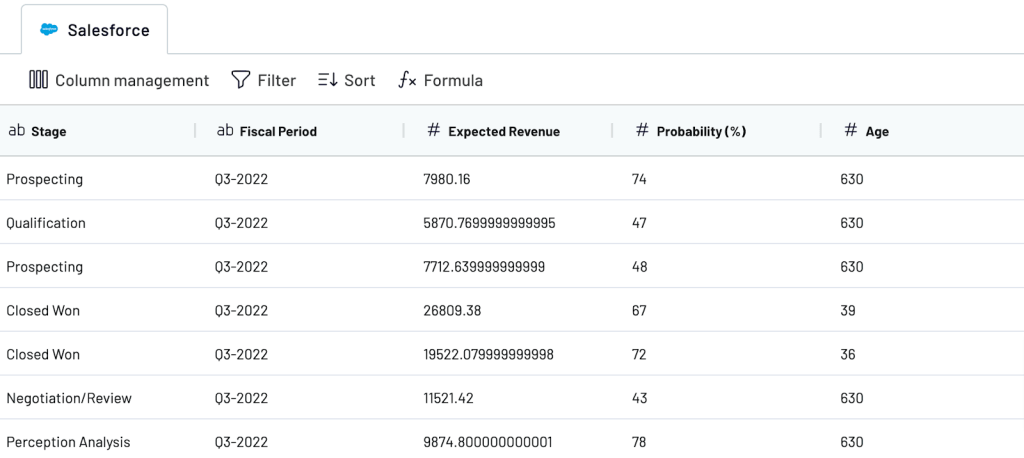
Connect your Salesforce account, and select the preferred data type: Reports, Objects, or Custom SOQL.
- Reports – you can extract data from tabular reports including the Accounts report, Orchestration runs, etc.
- Objects – you can select any of the predefined Salesforce objects such as Account, Opportunity, Account Feed, Account History, Asset Feed, Business Hours, Calendar, Campaign, Cart Item, Change Request, Lead, etc.
- Custom SOQL – you can fetch precise data or unlock the ability to export two or more data types simultaneously.
2. Organize data
Before loading your data to the destination app, you can organize it as follows:
- Edit, rearrange, hide, or add columns.
- Apply filters and sort data in the desired order.
- Create new columns with custom formulas.
- Combine data from different accounts or apps.
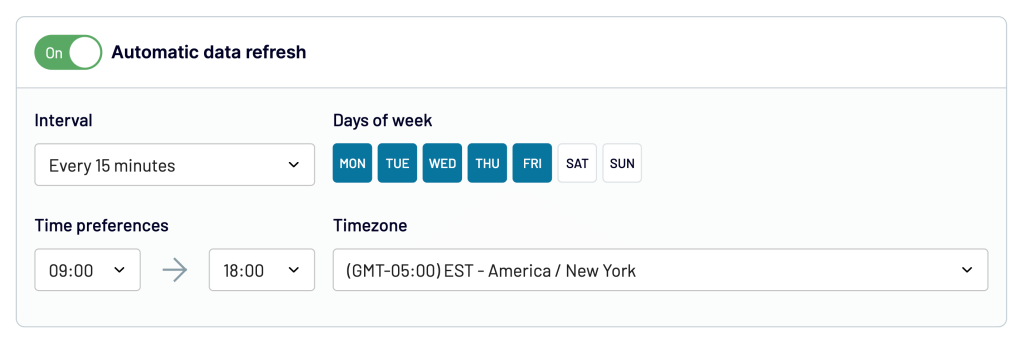
3. Load and schedule refresh
Connect your destination app following the instructions and load your Salesforce data. You can also enable the Automatic data refresh and configure the schedule. This way you ensure your Salesforce report always shows the up-to-date information.
With the data loaded to your spreadsheet or BI tool, you can build custom reports, pivot tables, Salesforce dashboards and share them easily with your teammates, partners, and third parties.
Is the built-in Salesforce reporting any good?
There cannot be an exact definition of good or bad for Salesforce reports. You can use them for your basic reporting needs, and they are good for that. At the same time, Salesforce reports are limited in functionalities compared to spreadsheet apps like Google Sheets or Microsoft Excel, where you can implement complex calculations. Not to mention progressive data visualization tools like Tableau or Looker Studio where the real magic happens 🙂
So, if you feel that native reports are more than enough for your reporting, then you’re all good. If they are not, it’s time to go beyond Salesforce and consider external reporting as a go-to option. Coupler.io will help you implement this hassle-free!
Automate Salesforce reporting with Coupler.io
Get started for free