What is the ROI of SEO?
SEO’s ROI (return on investment) is the percentage of revenue generated from conversions – such as sales or leads – via the organic search channel compared to the costs spent on this channel.
This figure, typically calculated monthly, quarterly, and yearly, highlights the profitability of your SEO campaigns. If you’re an agency, it also shows the value of your services from your customer’s perspective. Therefore, it’s crucial to understand how to calculate and track this metric. Let’s explore this process step by step, and before that, delve deeper into its importance.
Why you should measure SEO ROI for informed decision-making
Here are key reasons to measure the ROI of your search engine optimization efforts:
- Communicating success: The ROI metric provides tangible evidence of boosts in website traffic, leads, or sales so you can communicate how they contribute to business growth.
Imagine SEO return on investment rising alongside increased organic search traffic over a specific period. This demonstrates to stakeholders the monetary impact of your traffic-driving efforts.
- Allocating resources: SEO ROI helps you identify which efforts yield the best returns and which underperform, then optimize your resource allocation accordingly.
For example, you can make data-driven decisions to direct more of your budget toward strategies that succeed and reduce or stop investment in those that don’t.
- Benchmarking: Return on SEO investment allows you to set realistic expectations and identify areas for improvement by comparing current performance with past results or industry standards.
Suppose you’re running a B2B SaaS business. In that case, a 700% return is achievable within the industry. However, if your ROI lags behind this benchmark, it indicates the need to investigate what’s not working well and make optimizations.
Since you understand the strategic value of SEO ROI, let’s go into the variables and calculations required to measure this metric.
How to measure SEO ROI
The ROI formula for SEO is similar to that of any other investment. It looks like this:
SEO ROI (%) = (SEO revenue ? SEO costs) ÷ SEO costs × 100
According to this formula, you’ll need to ensure two variables are available:
- Determine SEO revenue – the total revenue resulting from the organic search channel, based on data typically found in Google Analytics.
- Estimate SEO costs – the overall investment in search engine optimization. You can gather the figures for this calculation from your accounting system (Xero, QuickBooks) or CRM (Pipedrive, HubSpot).
To get both total revenue and total cost, organize the data into a report and calculate the sums. For example, use Coupler.io to build a report based on the data from the sources above and prepare both variables. Then, calculate the ROI of your SEO efforts directly within the report and export it for further tracking into tools like Google Sheets, Excel, or Looker Studio.
Let’s now look at an example of measuring return on investment. We’ll use Google Analytics for revenue figures, Xero for expense data, and Coupler.io to build the report and perform the calculations.
Determine your SEO revenue
For this step, we’ll first go to Google Analytics to track and view revenue from organic search, then arrange this data into the Coupler.io report for later use in the final ROI calculation.
Set up revenue tracking in Google Analytics
Revenue is generated from conversions – the desired actions that the customer performs on your website. However, the types of conversions and the values assigned to them vary for each business.
If organic search is the only marketing channel in your business, it gets credit for all your conversions, and your total revenue is considered SEO revenue. In that case, it will be enough to add events to your website using Google Tag Manager.
But what do you do if you’re, say, a SaaS subscription service with no direct sales and multiple channels, making it difficult to attribute revenue to SEO? Set clear goals – such as MQLs (marketing qualified leads) with at least some website engagement and SQLs (sales qualified leads) who, for example, scheduled a demo. Then, assign dollar values to these goals. So, let’s see how to do this using Google Analytics.
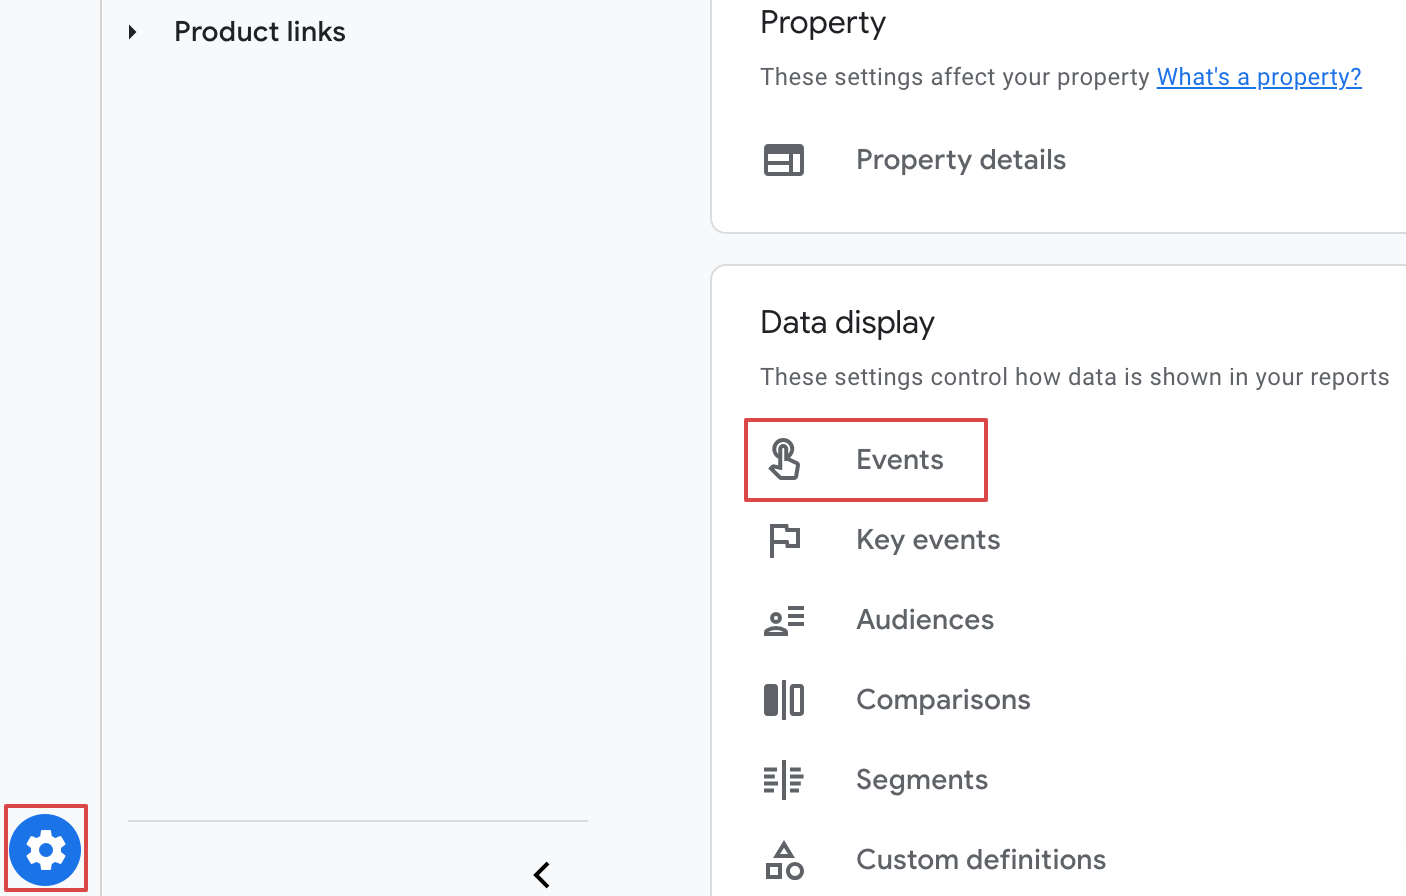
Once you sign in, click the bottom left icon, then Admin and Events.

Now, click the Create event button.

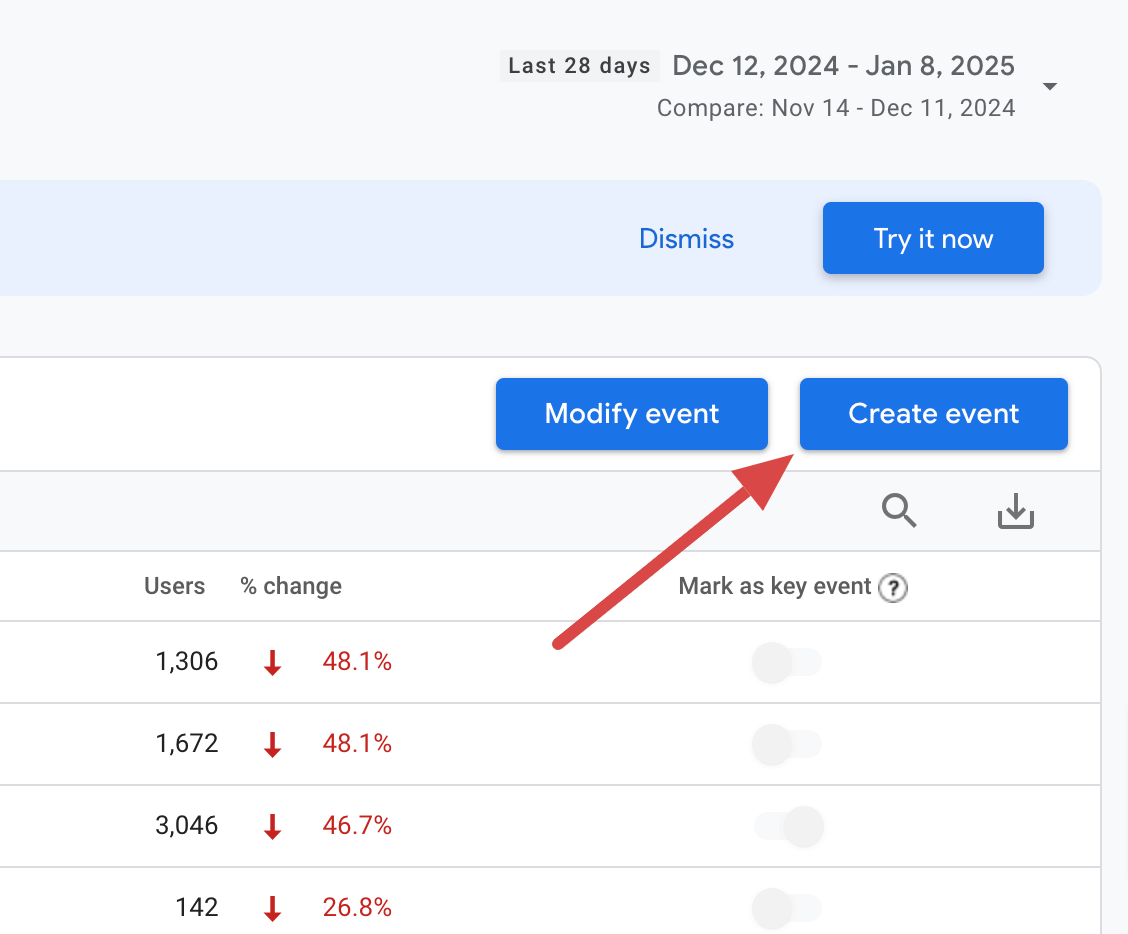
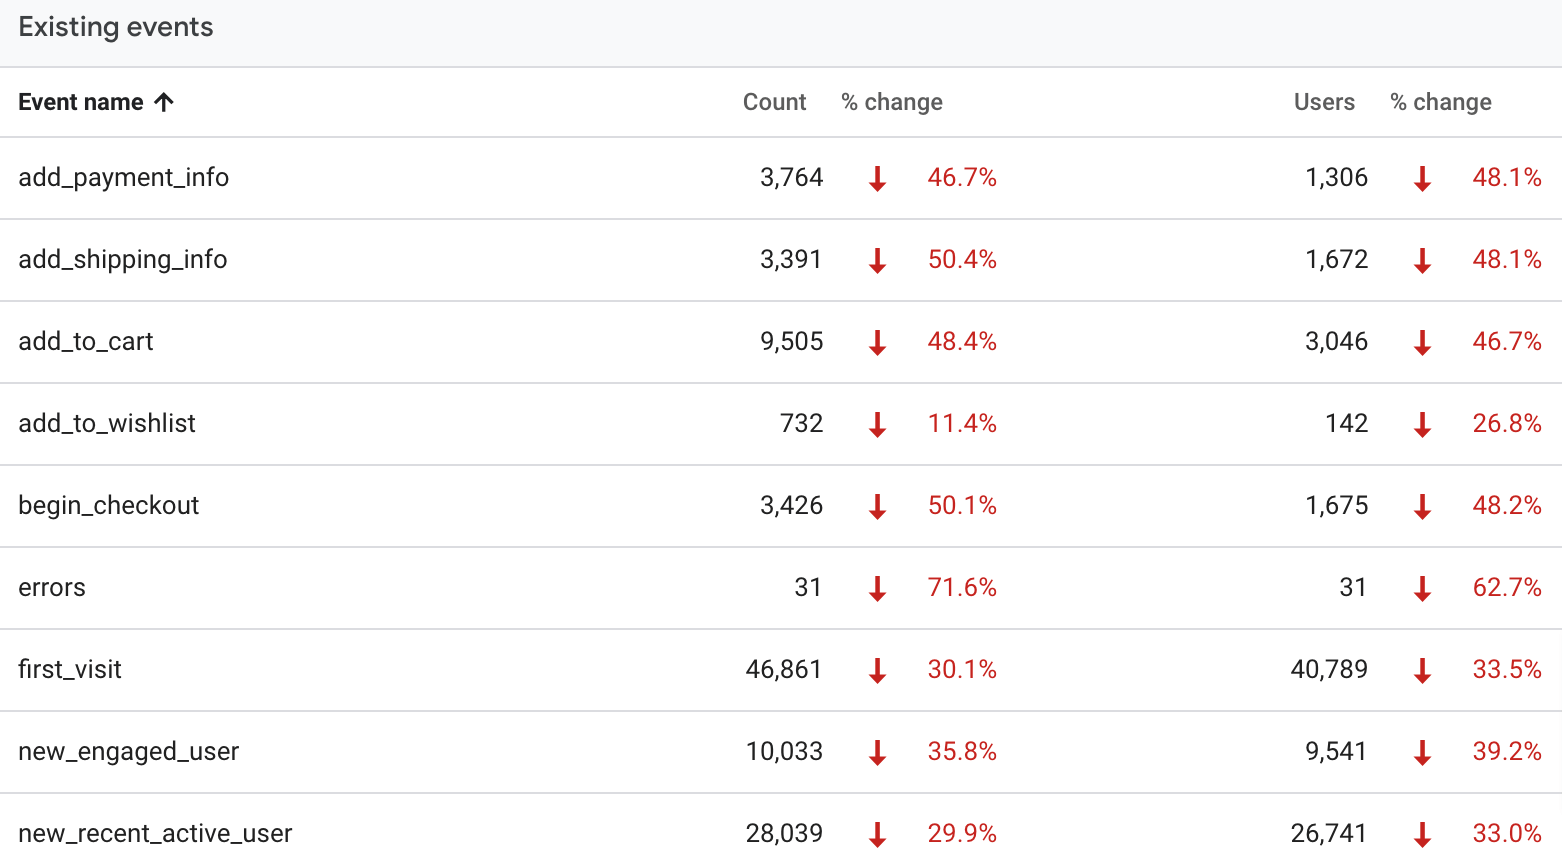
After creating conversion events, mark them as key events. These can include actions that contribute to your business’s success, such as form submissions, free trial signups, or visits to a specific page. For example:

Next, select Modify event and assign monetary values to each. Calculate these values using the formula:
Customer lifetime value (CLV) × Lead conversion rate
Where:
- CLV is the amount a customer is expected to spend with your business over the average duration of your relationship.
- Lead conversion rate is the percentage of leads who convert into paying customers.
For example, if your average CLV is $2,000 and your lead conversion rate is 10%, the event monetary value would be:
2,000 × 0.1 = $200
Every time the event is triggered, its value is counted and then included in the total revenue.
View your revenue in Google Analytics reports
Revenue, once set to track, can be reviewed in the native reports available in Google Analytics. Navigate to the left sidebar, click Reports, and view reports under Acquisition, Engagement, or Monetization – depending on your business type and the conversions tracked for revenue calculation.

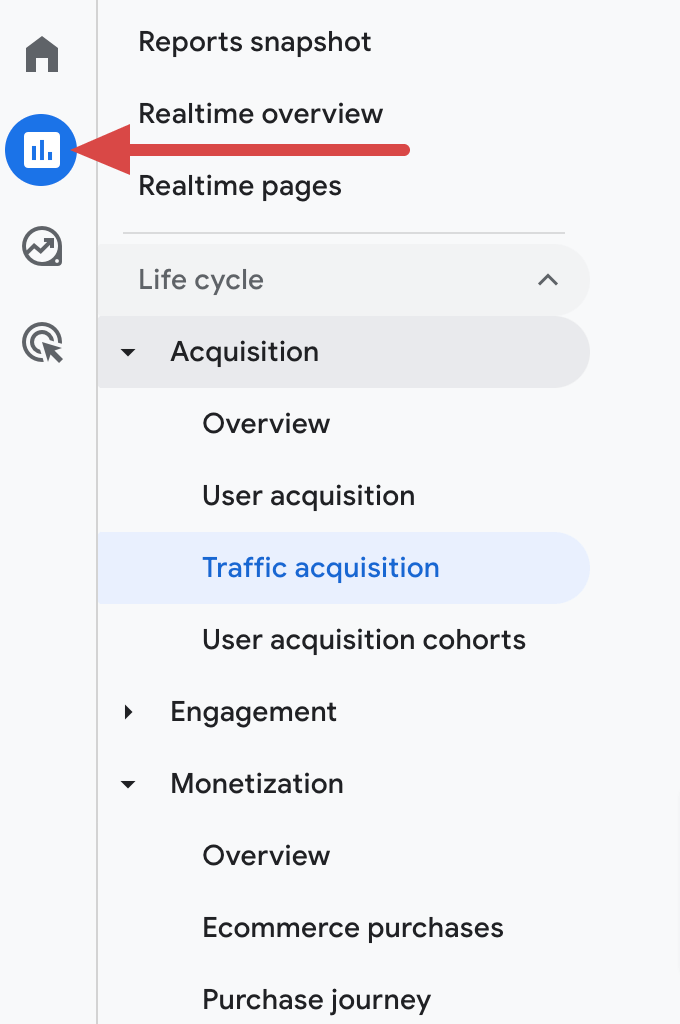
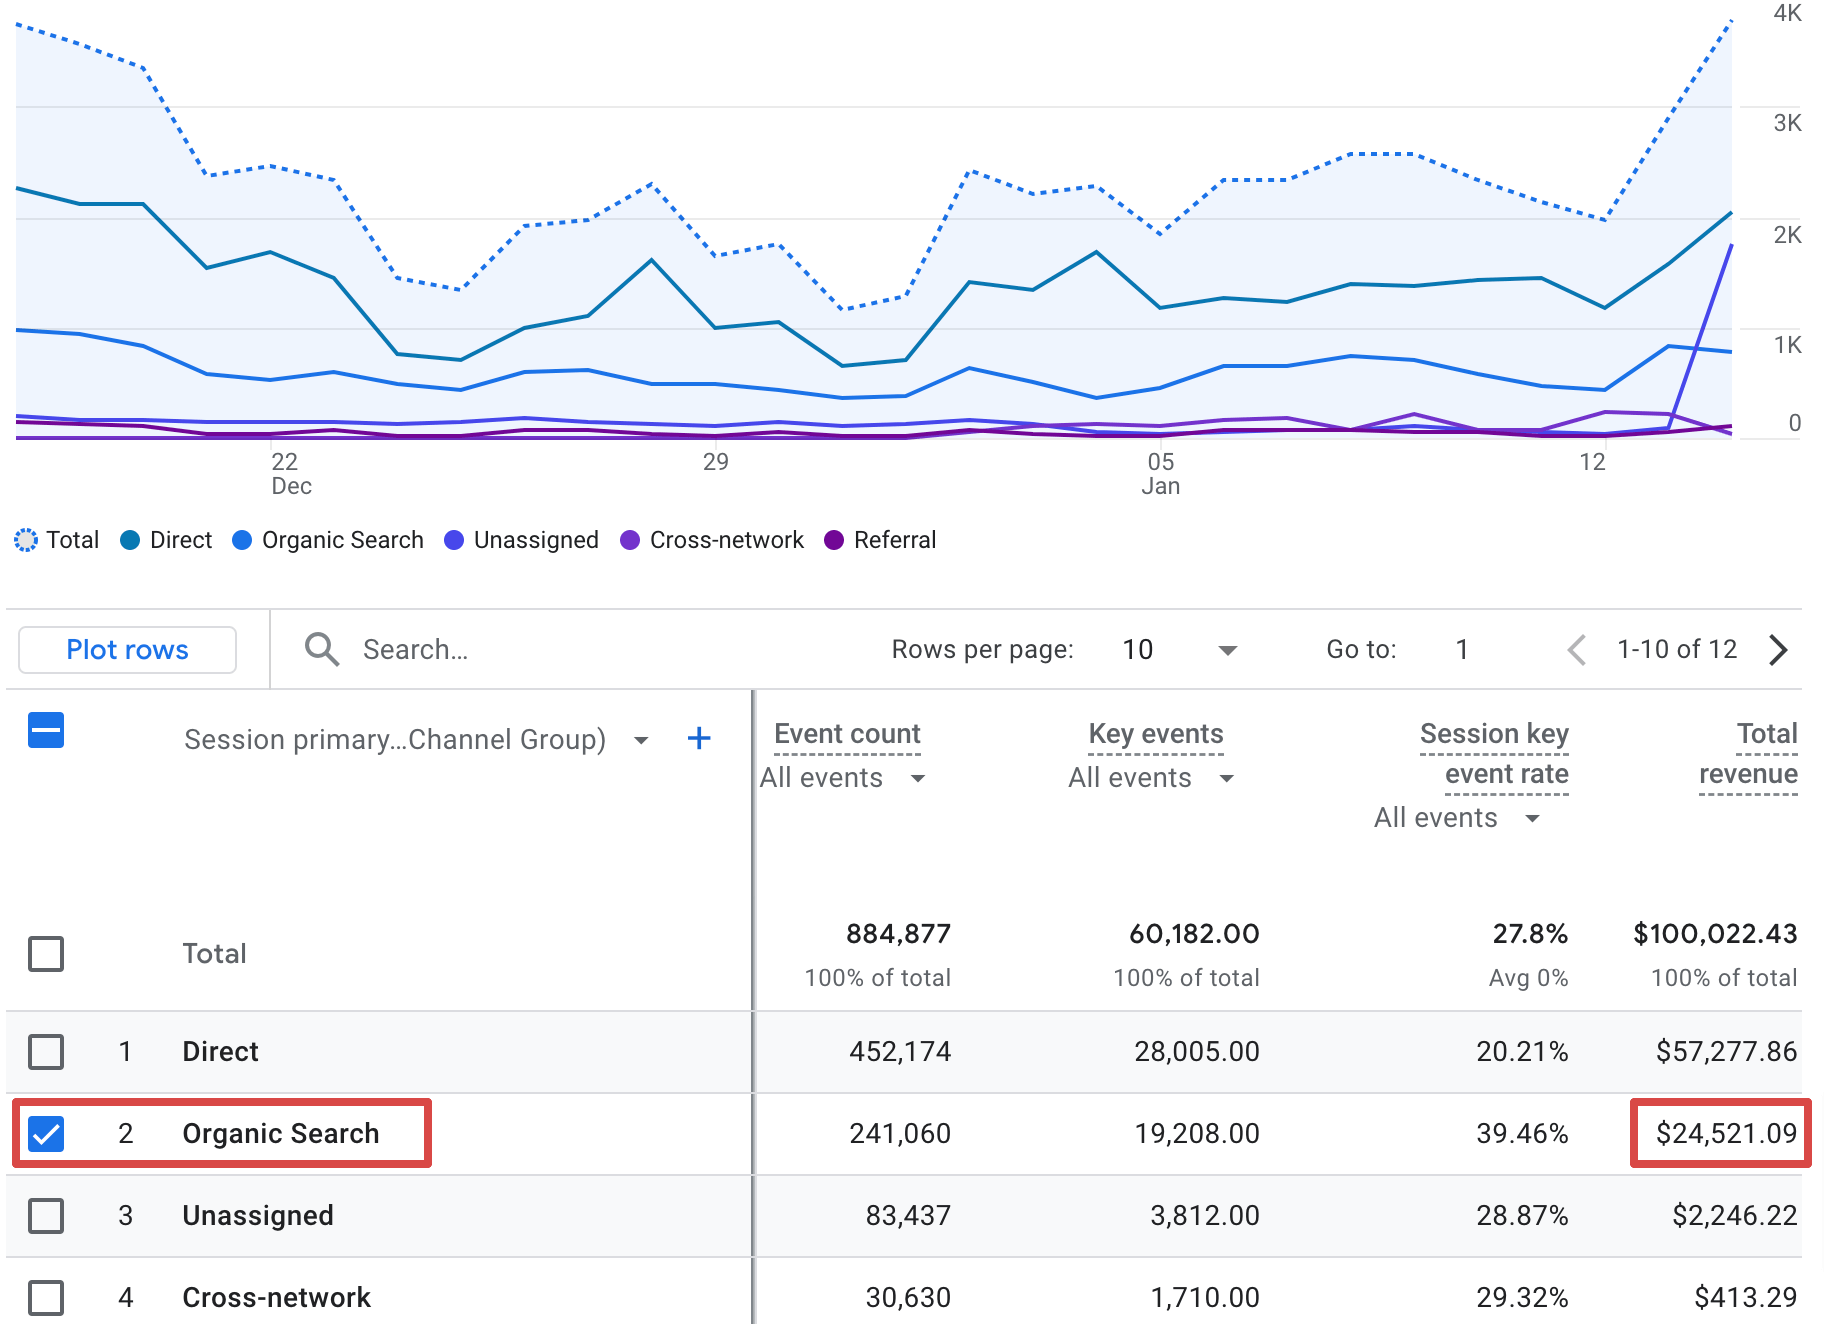
For instance, let’s look at the total revenue from organic search in the Traffic acquisition report:

Although not commonly relied upon, you might want to consider associated conversions influenced by organic search, even though it wasn’t the final touchpoint before those. For example, SEO often contributes to initial brand awareness or later research stages.
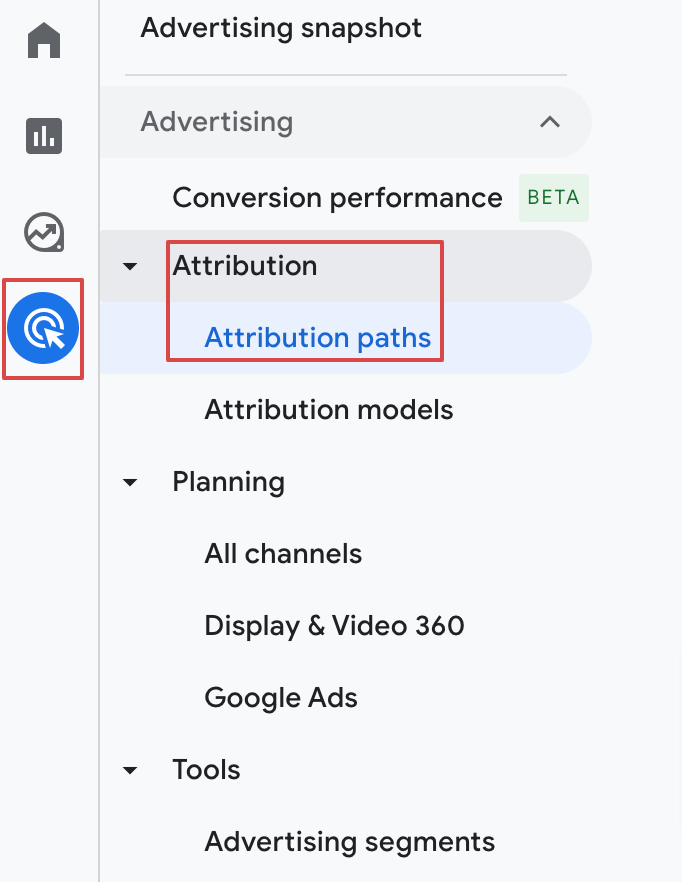
To check revenue from associated conversions, go back to Google Analytics, click Advertising in the left sidebar, Attribution, and then Attribution paths.

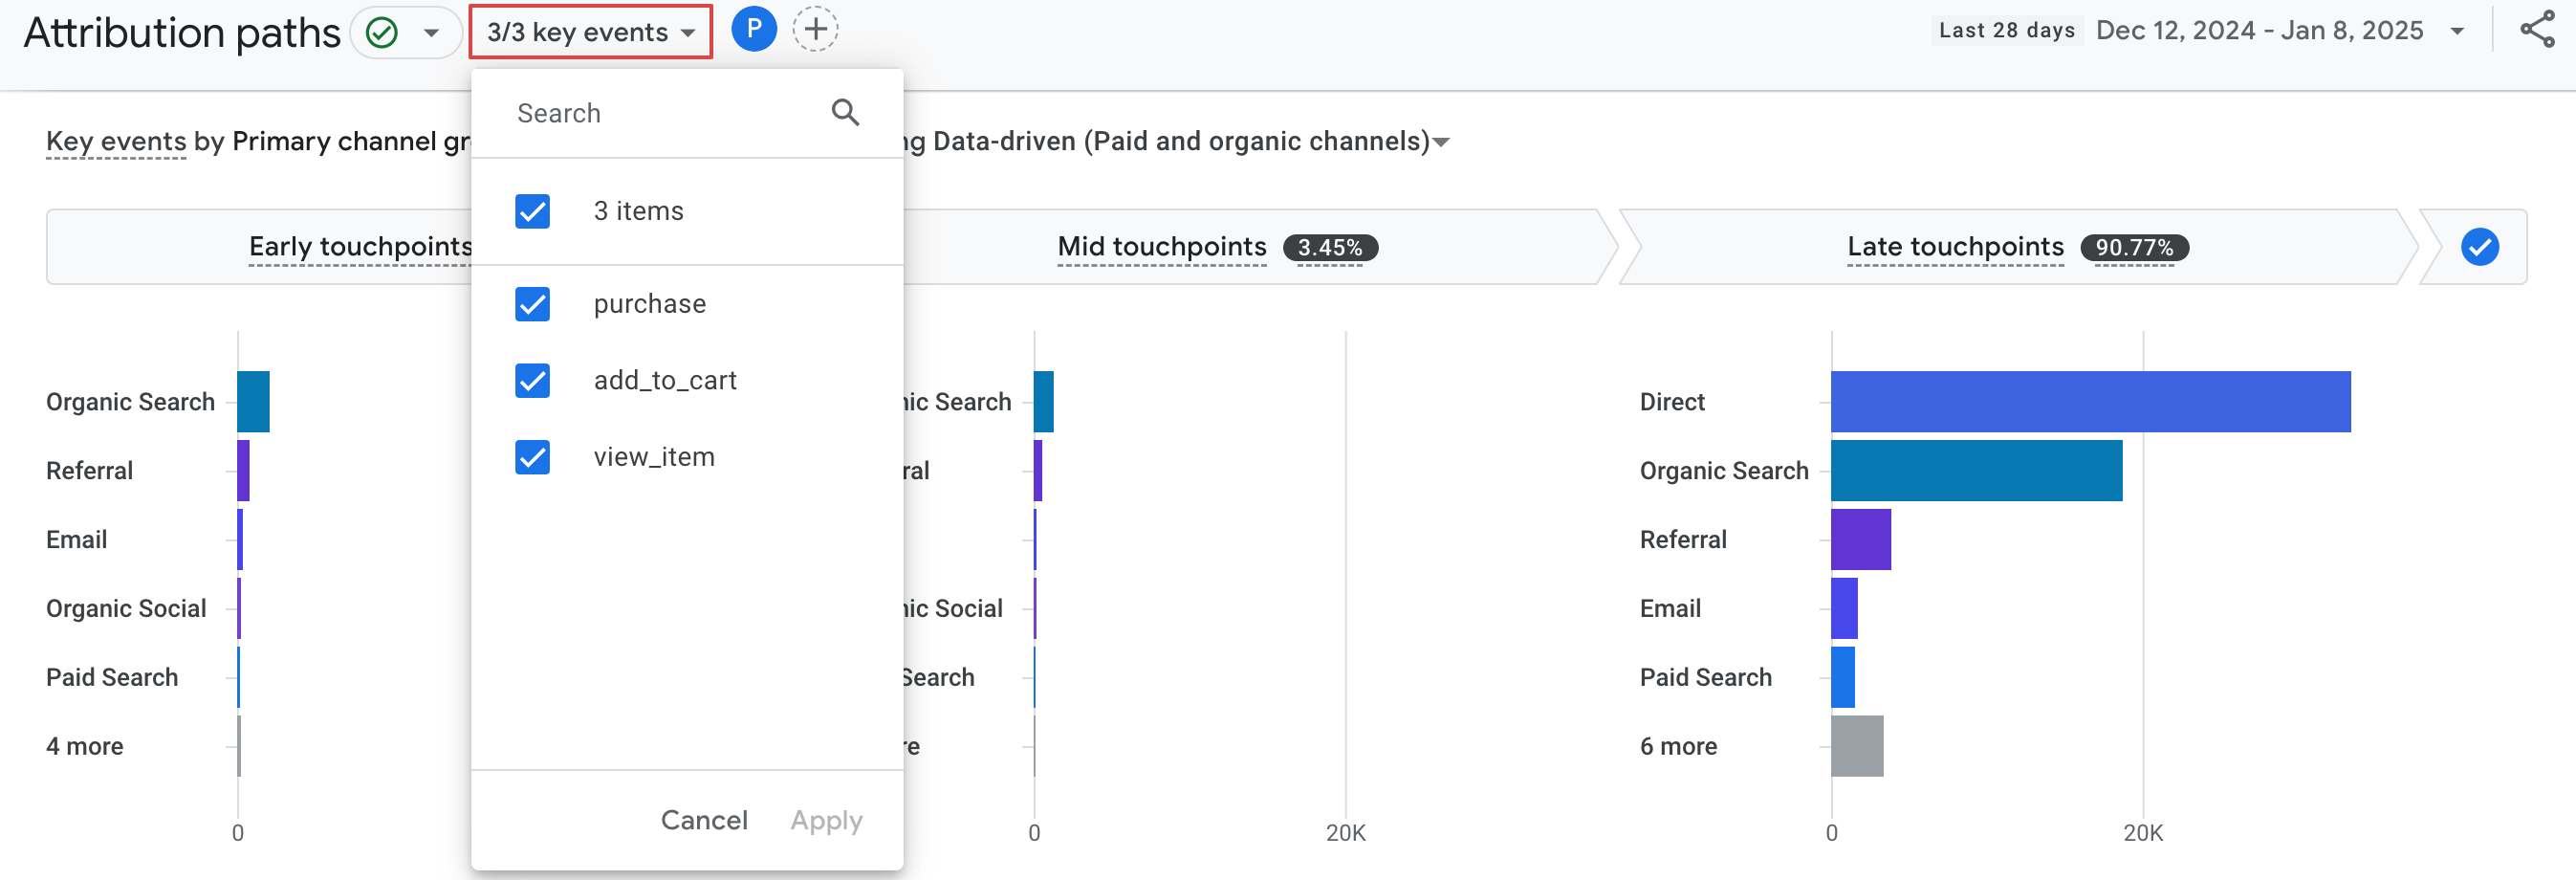
Choose the key event you need to analyze by clicking the event number button at the top.

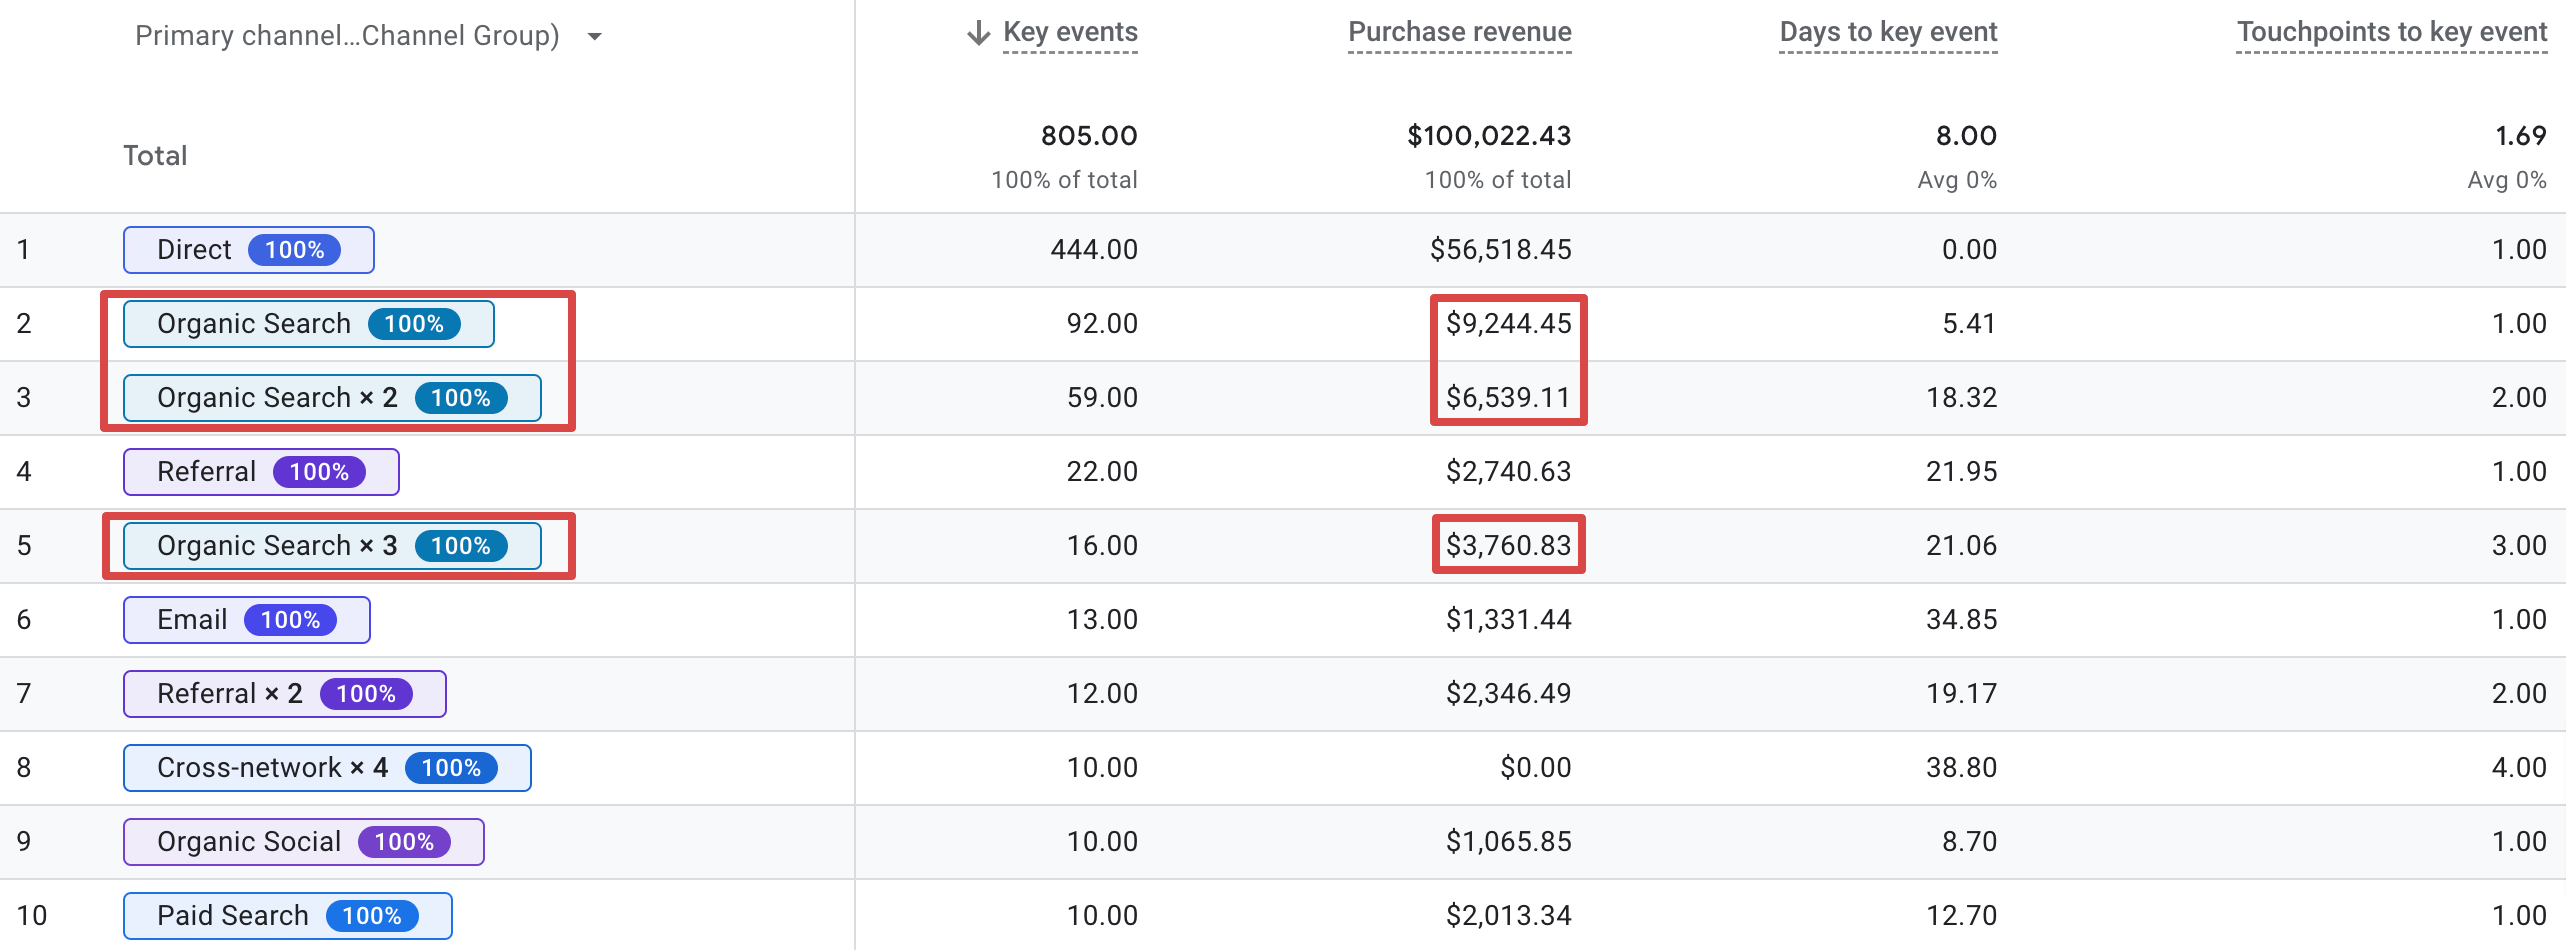
This way, you’ll see purchase revenue from conversions associated with the organic search channel.

Now, let’s plug revenue data into the Coupler.io report.
Add revenue data to the Coupler.io report
To get started, use the form below to select a destination for Google Analytics data, and then click Proceed:

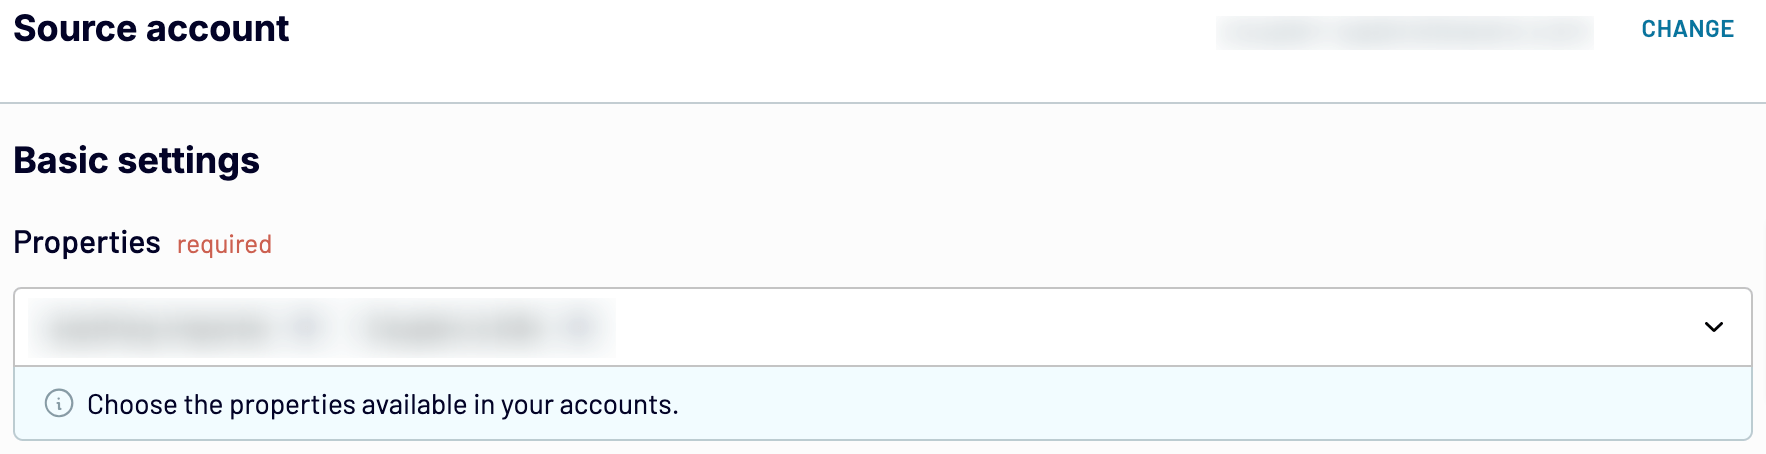
If you’re new to Coupler.io, you’ll be asked to sign up for free (no credit card is required). If you’re already a user, you’ll be taken directly to the data flow. Next, connect your GA account and select the Properties for export.

Specify the report period and select the metrics to include in your report, which are basically total users, key events, and total revenue.

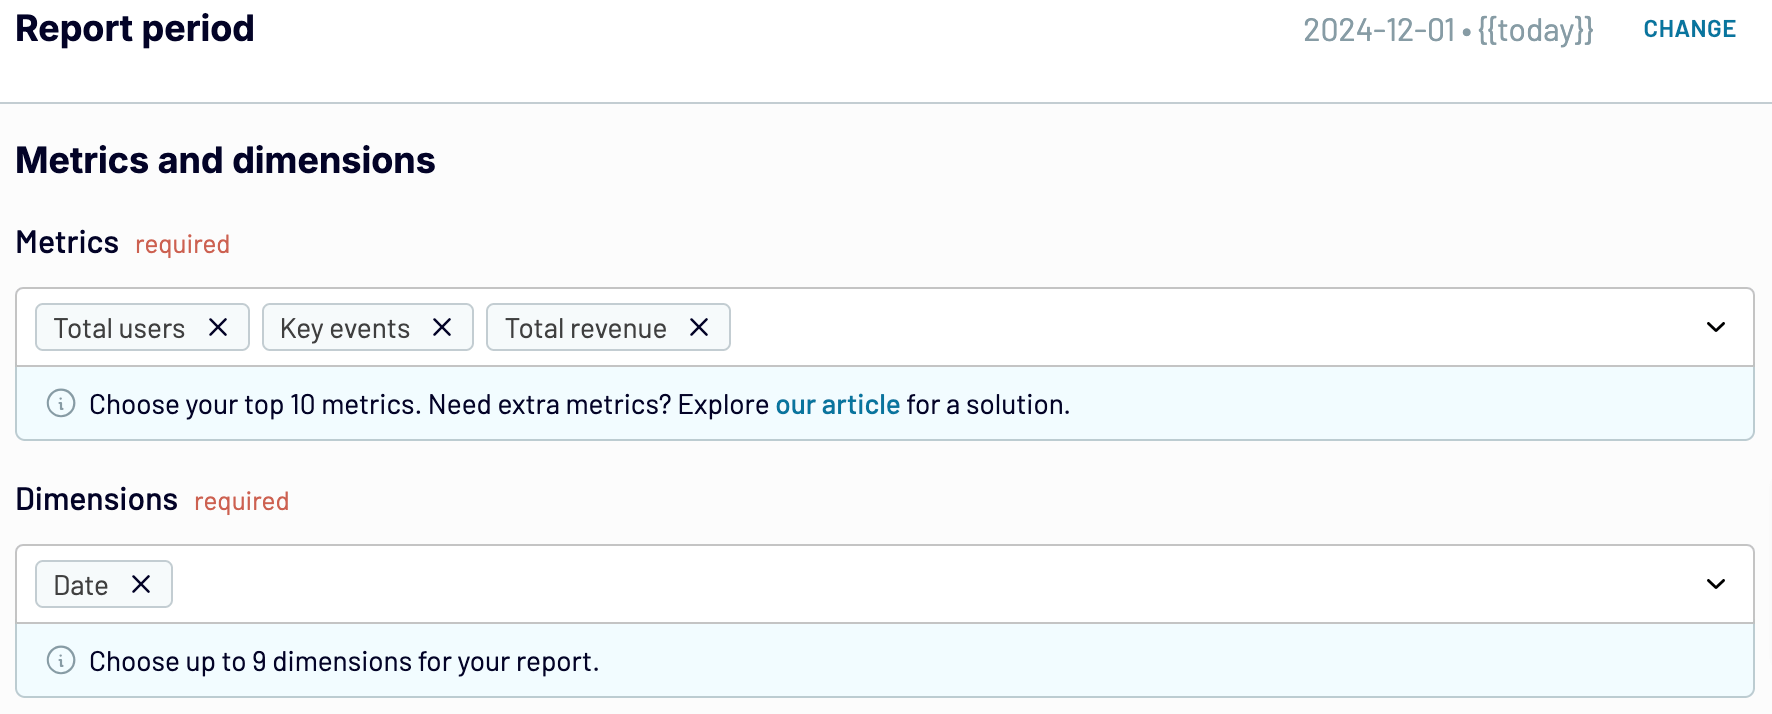
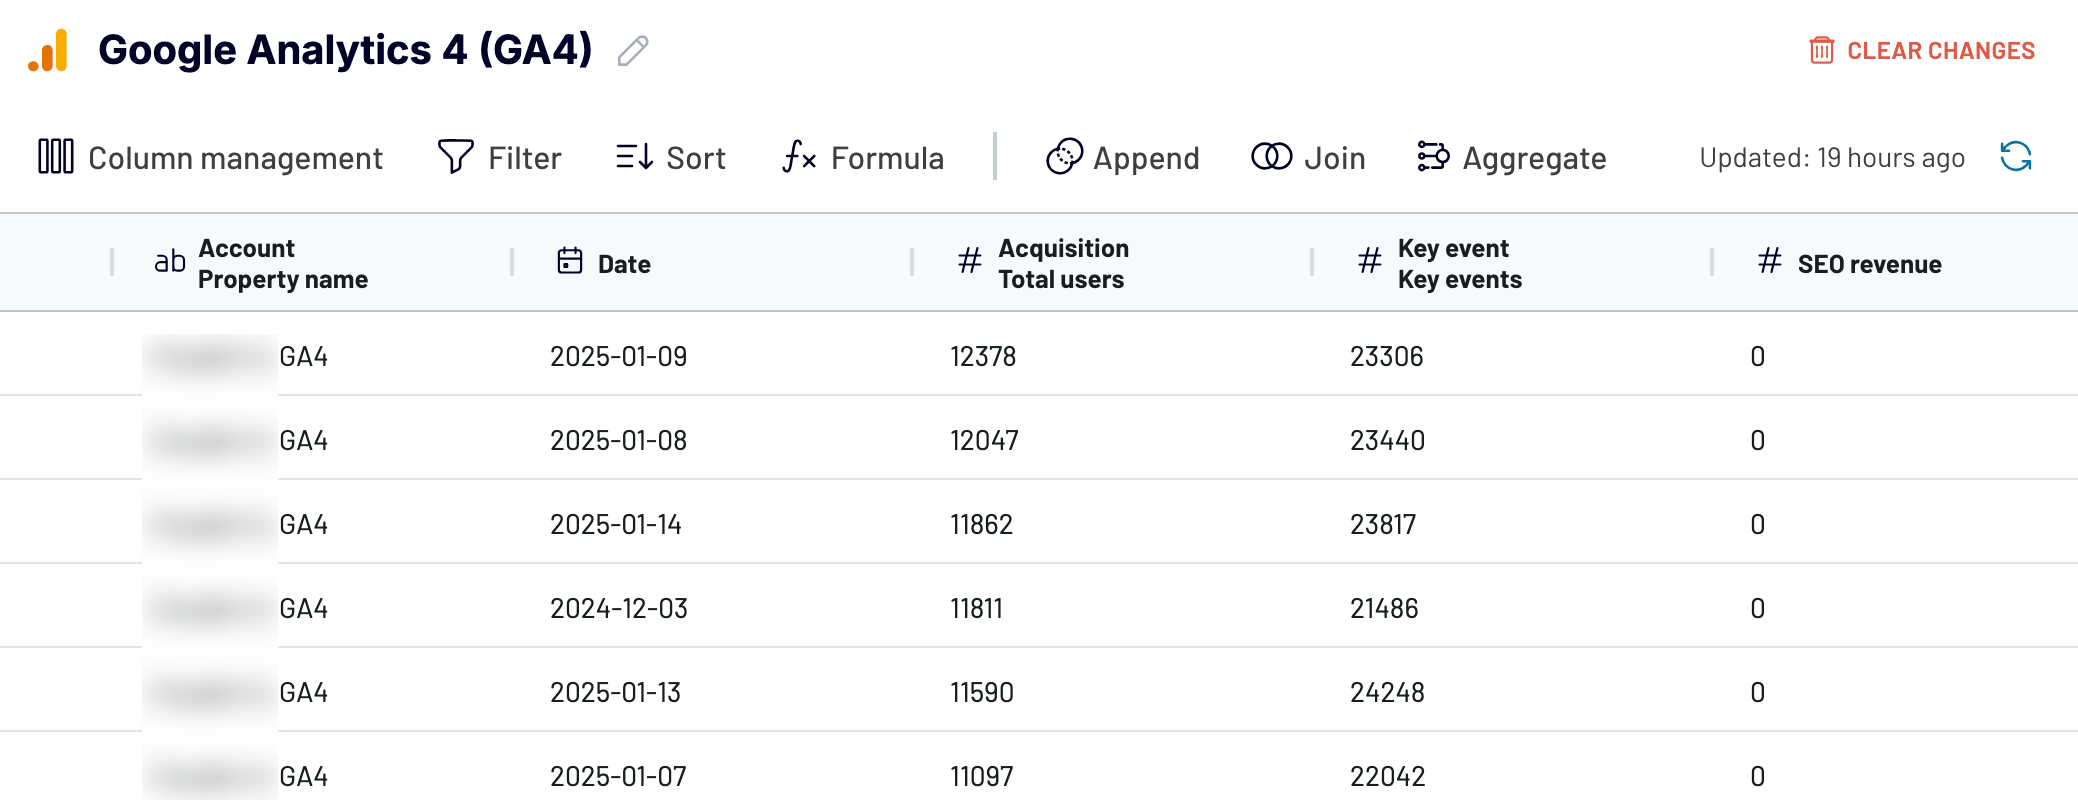
Once you’ve completed the source settings, proceed to have your SEO revenue data in the report.
Note: For convenience, we’ve renamed the column with revenue numbers to SEO revenue. To do this, hover over the field with the column name, click the triple bar, select Edit column, enter a new name, and press Apply.

Let’s now move on to the next step.
Estimate your SEO costs
To measure your SEO costs, you must clearly define all the relevant expenses, collect data on them, and calculate the total.
Define relevant expenses
Typically, costs associated with SEO include the following:
- In-house resources: These costs cover the salaries or compensation of your internal team: SEO specialists, content creators, and web developers responsible for the ongoing optimization of your site. If some team members only occasionally work on SEO tasks, break down their costs into hourly or daily rates, track their time, and add it to your calculation.
- Freelancers and agencies: Freelancers are commonly hired for specific SEO tasks, such as keyword research, and charge either on an hourly or project basis, depending on the scope. In contrast, agencies usually offer end-to-end SEO services, from strategy development to technical execution, with a fixed monthly fee.
- Tools: Apps like Semrush, Ahrefs, Moz for SEO analytics, and Coupler.io for data reporting operate on a subscription-based pricing model, typically charged monthly or yearly. If you pay for a tool annually but need to calculate the monthly cost, divide the yearly fee by 12. If your team uses tools shared with other departments, include only a portion of the price and total everything.
- Content distribution: These expenses involve paid promotion of your content across social media – such as advertising for boosted posts or influencer marketing fees – email marketing, and content syndication on third-party websites.
- Link-building: Associated costs include outreach campaigns, hiring guest post writers, or purchasing premium backlinks. Some businesses invest in link-building agencies, while others manage this process in-house. Calculate and sum these expenses based on your specific case.
Remember that these costs may vary each month, which is perfectly normal. Just be sure to account for any fluctuations when measuring your SEO ROI.
Collect your expense data
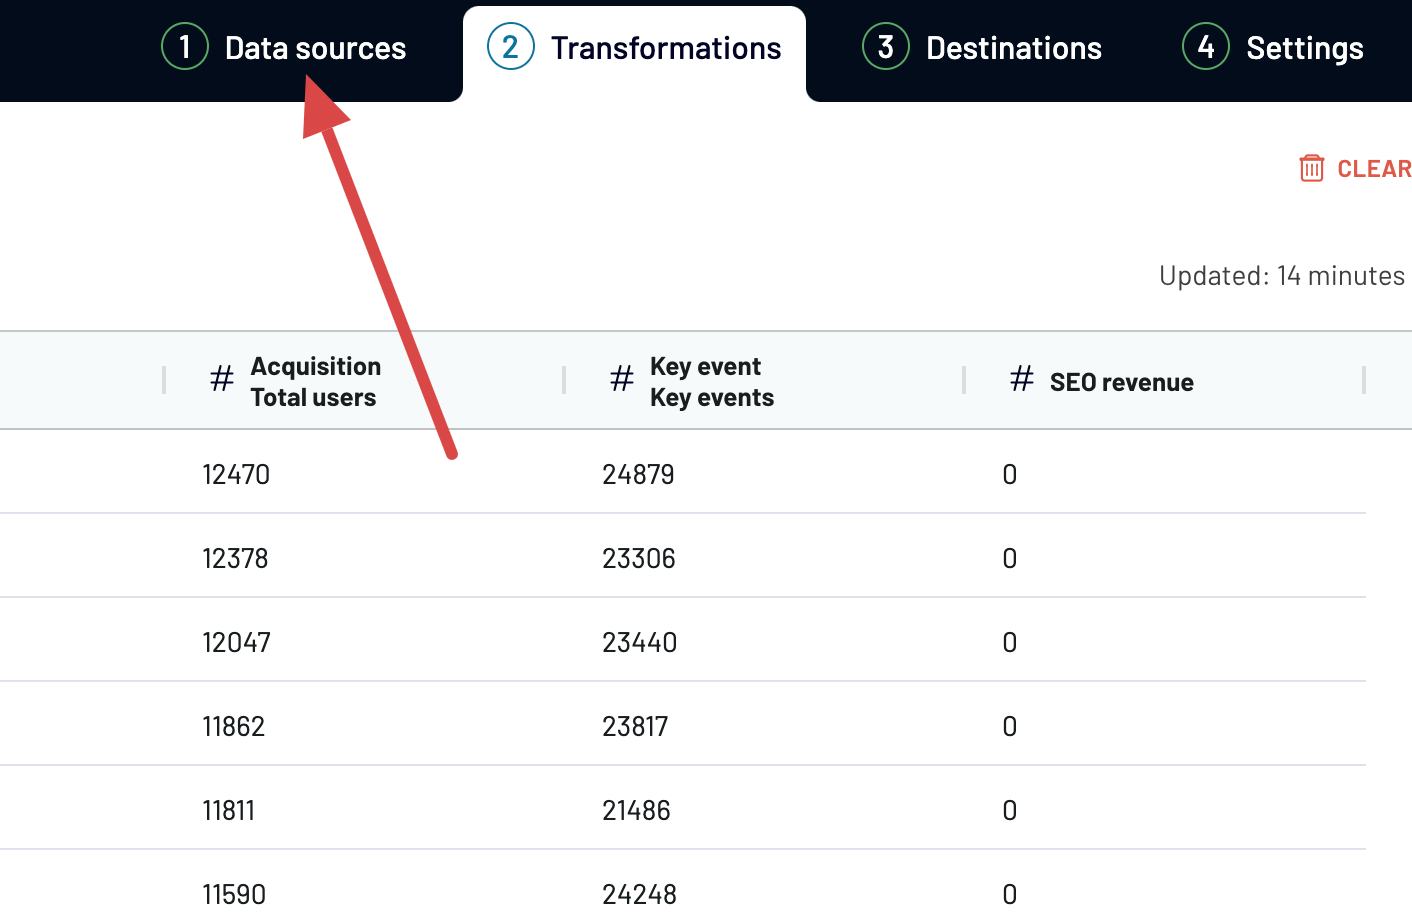
Let’s now gather your expenses and include them in the report we’ve already started. In our example, this data is collected from the accounting app Xero. Go back to the Coupler.io report and navigate to the Data sources tab.

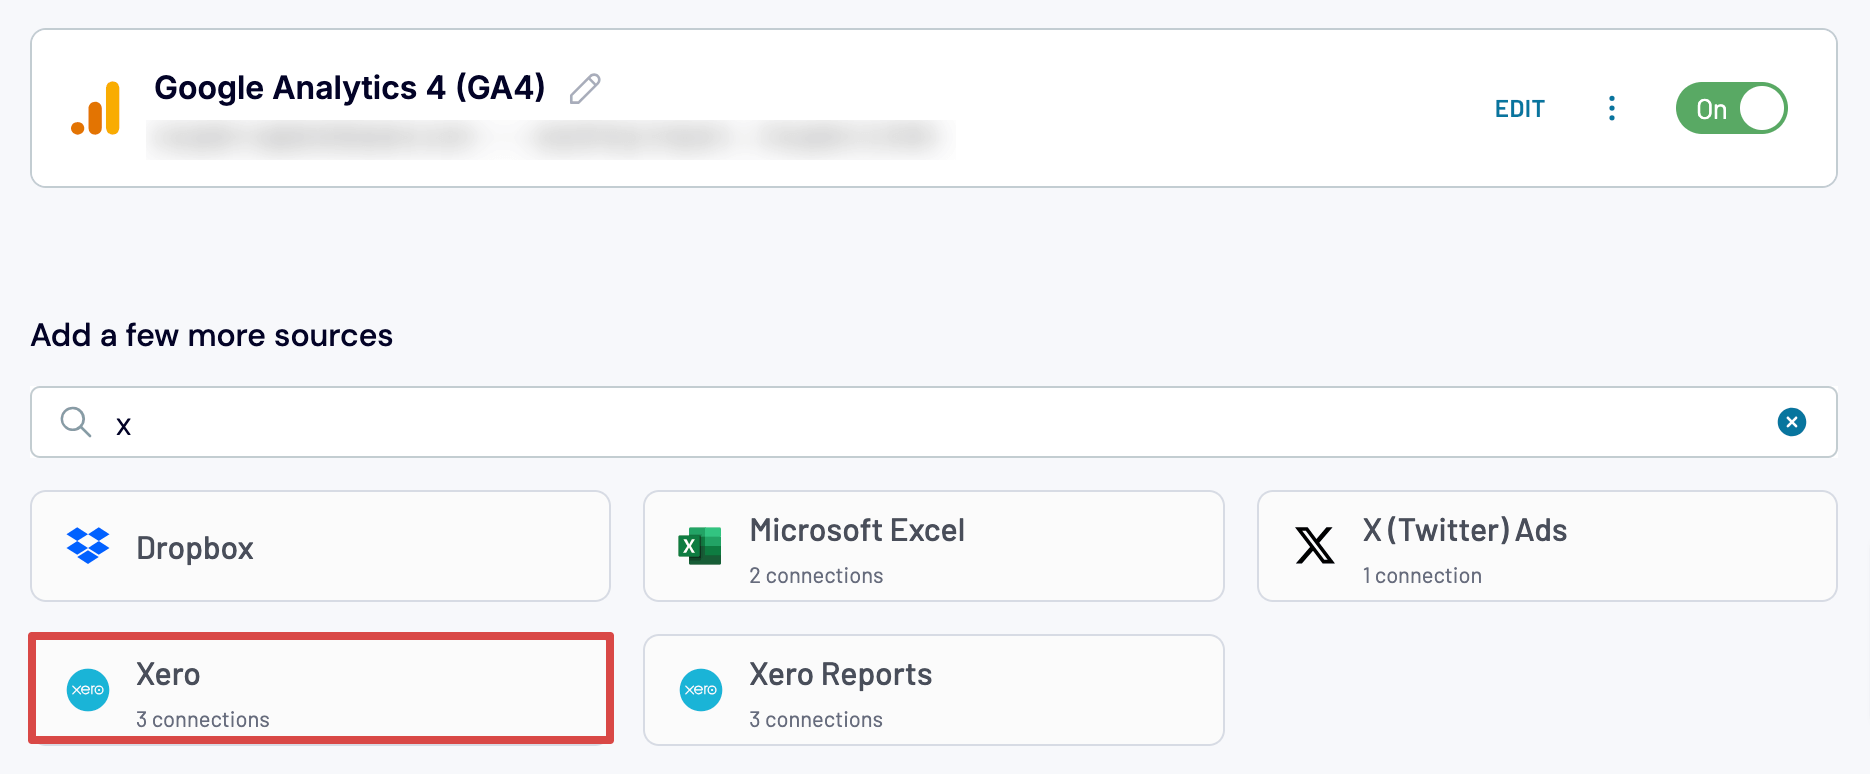
Add Xero as an extra source by searching for it in the app gallery.

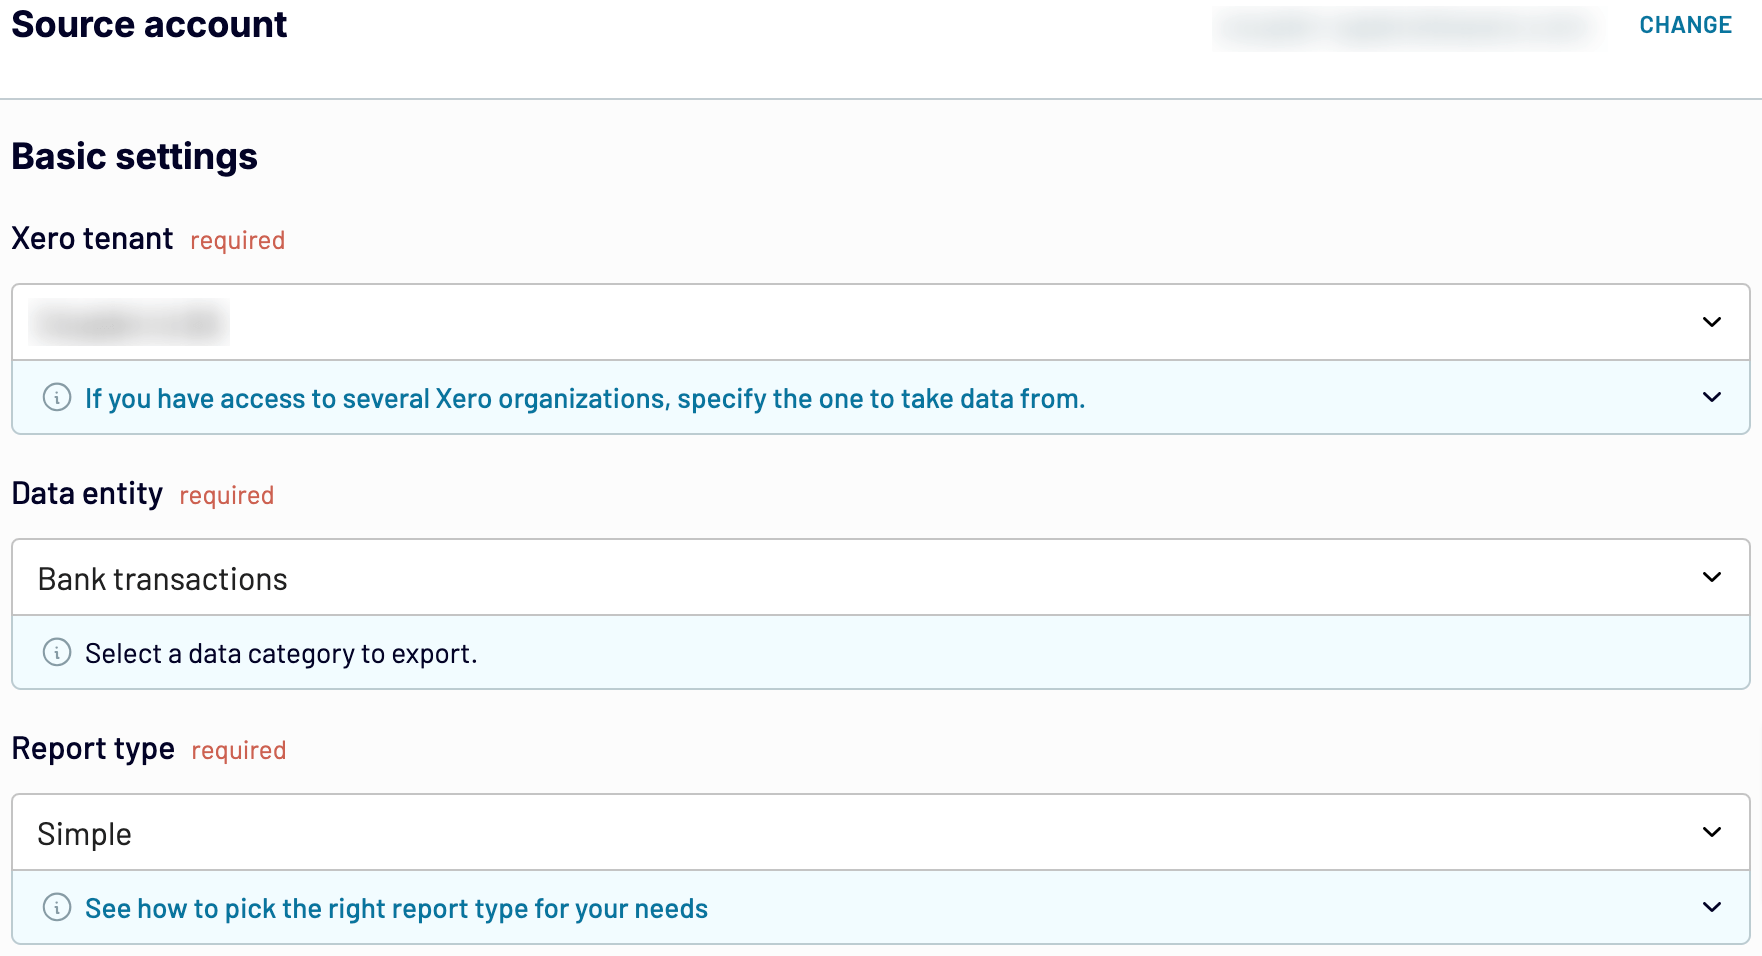
After that, connect your source account, select the Xero tenant and data entity from where you’ll export data, and then proceed.

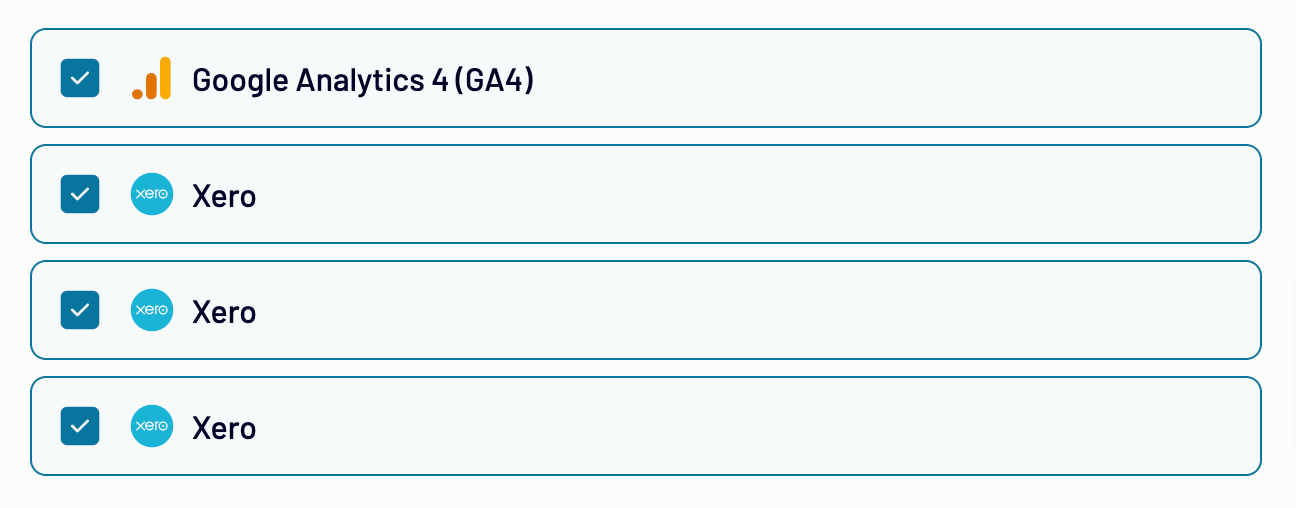
If you need to extract multiple data entities, you can’t do this simultaneously for Xero. In that case, now add Xero as an extra source again, select the required data entity, adjust the settings as you’ve just done before, and proceed. In our example, we have added three Xero entities.
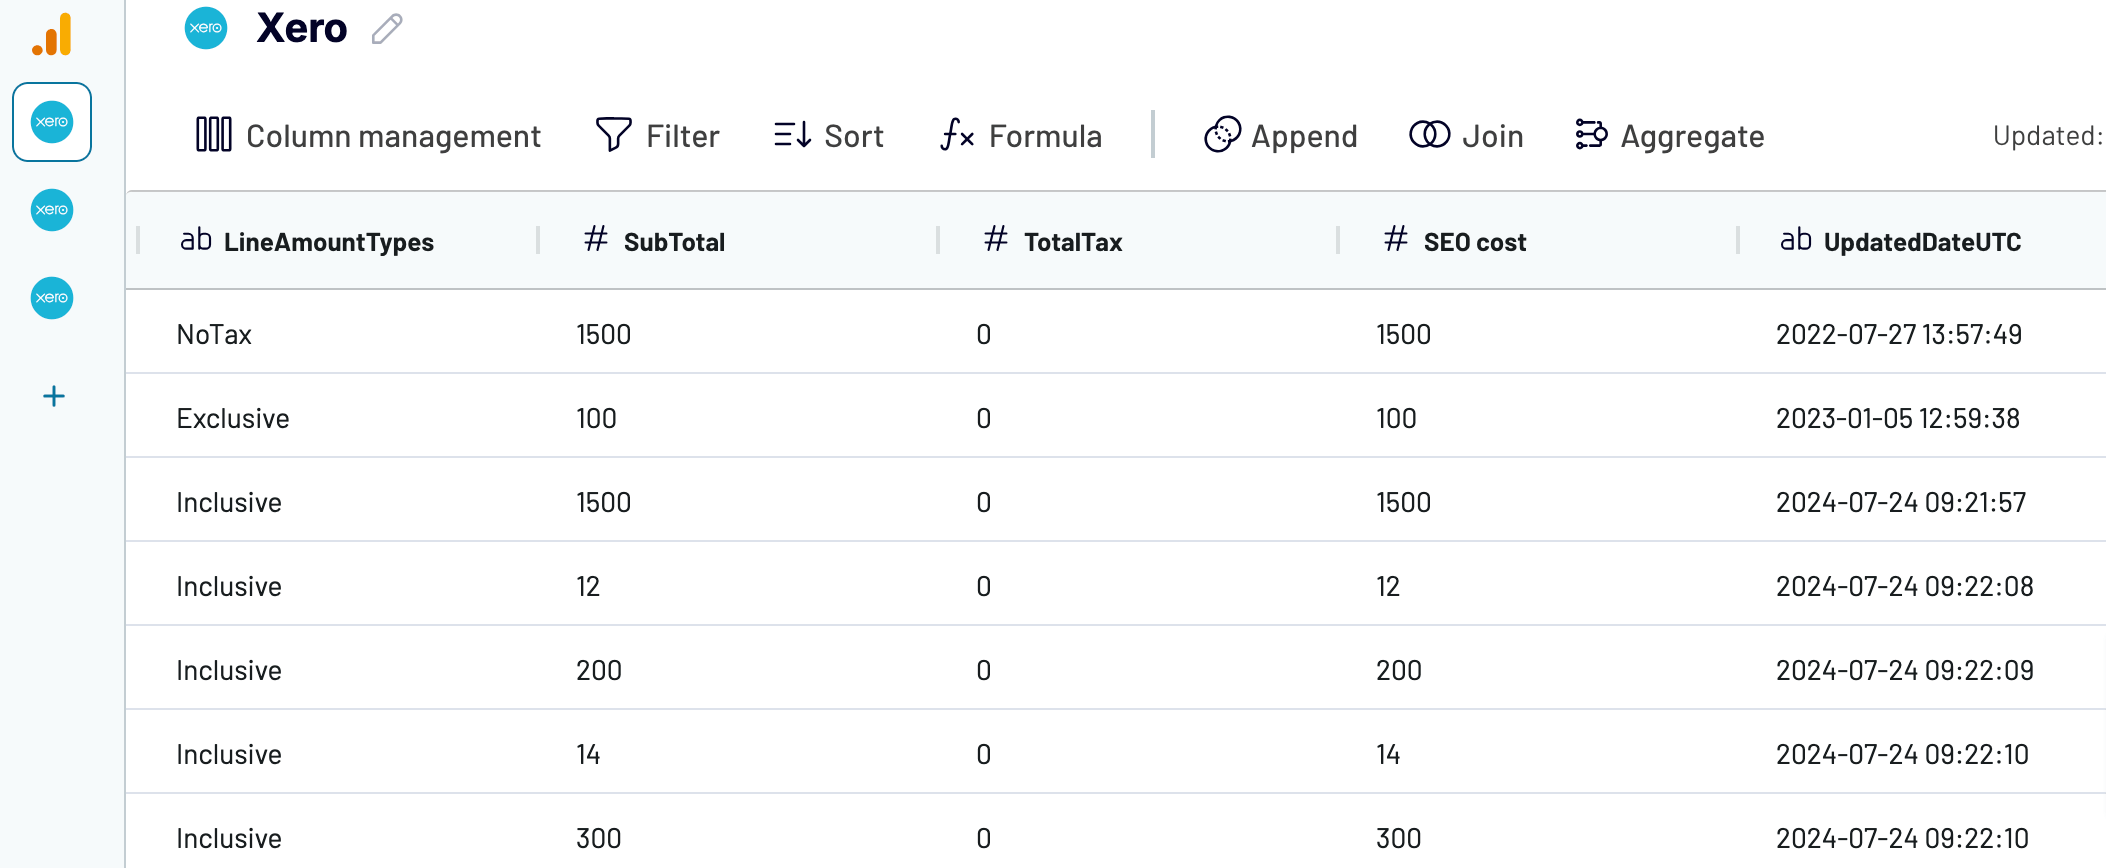
Note: For convenience, we’ve renamed the column with expenses to SEO cost.

Calculate expenses using data transformations
It’s time to perform the necessary data transformations to calculate your SEO costs.
Before that, you need to append the Google Analytics and Xero datasets into a single view for the later ROI calculation. Click the Append button on the toolbar and select all the connected sources.

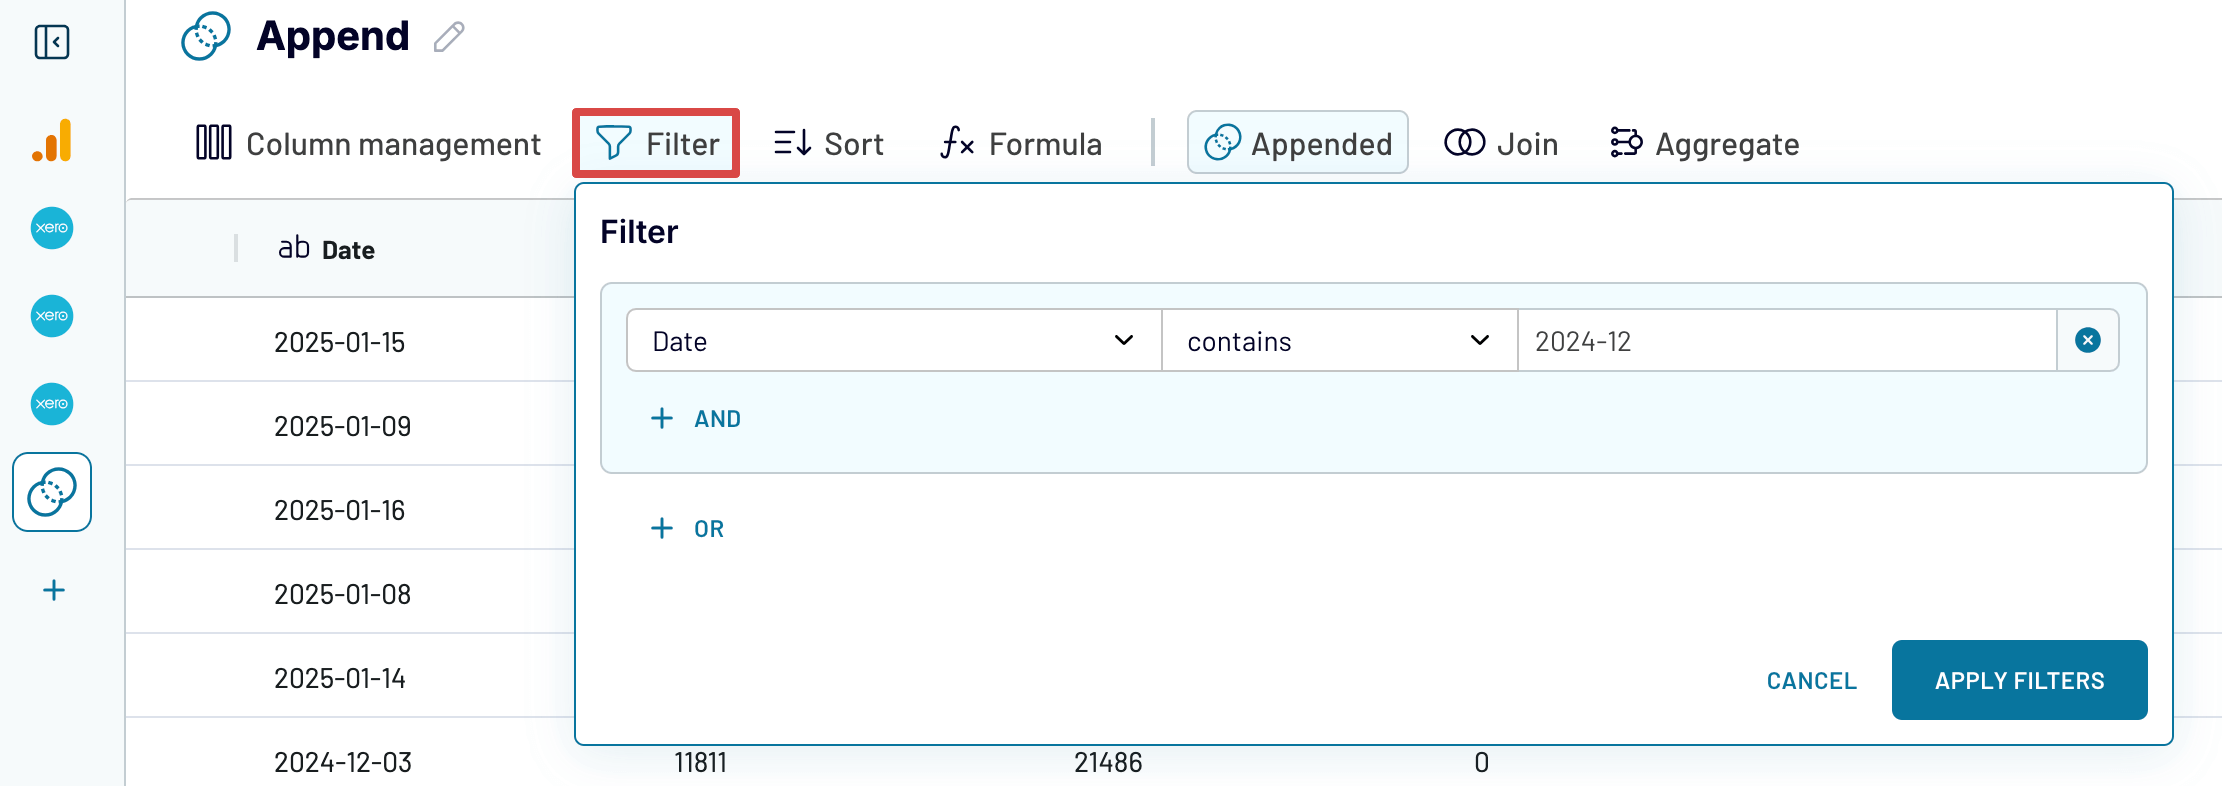
Now, you can use filtering, for instance, to narrow down your appended data to the specified month, as shown in the example below.

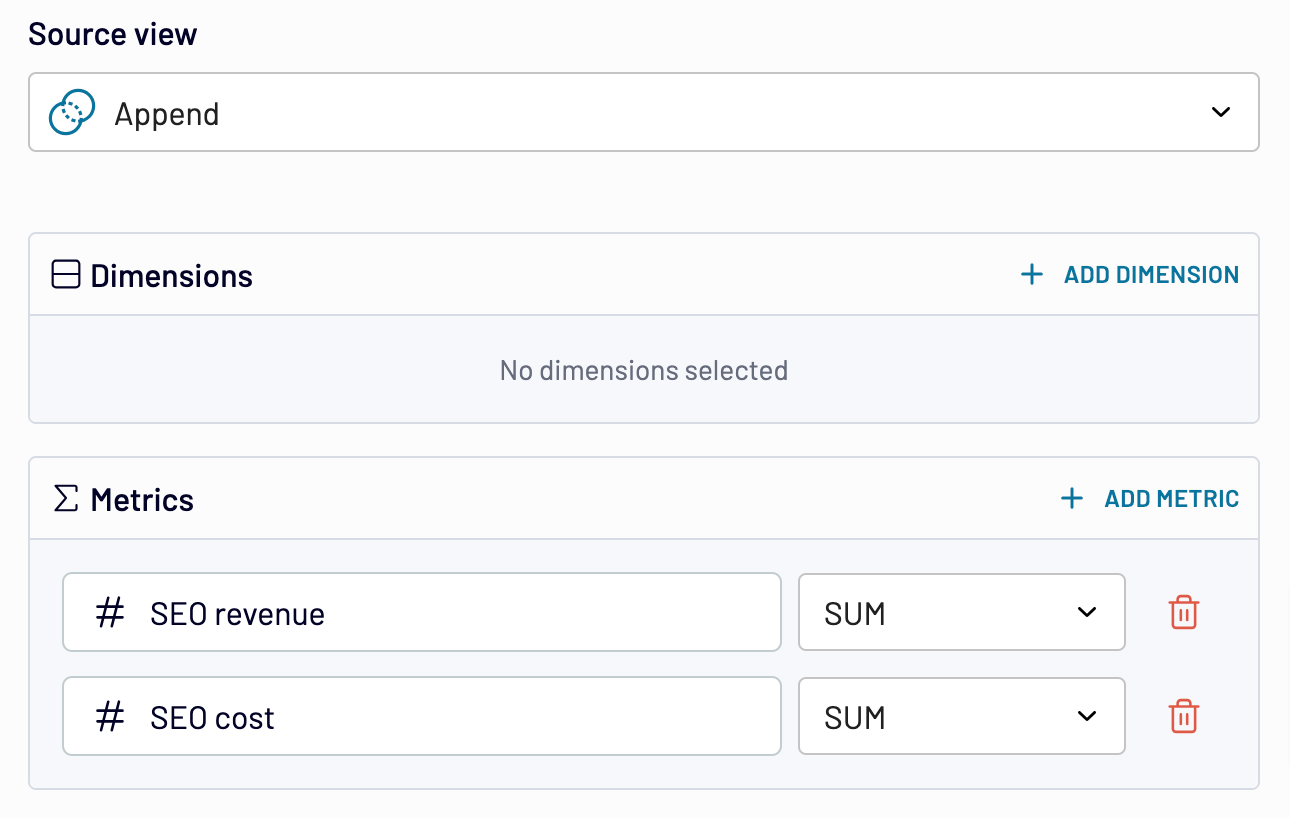
Next, use Aggregate to sum the expense numbers alongside revenue data, placing them side by side for the final calculation step.

As soon as you’re ready, move forward.
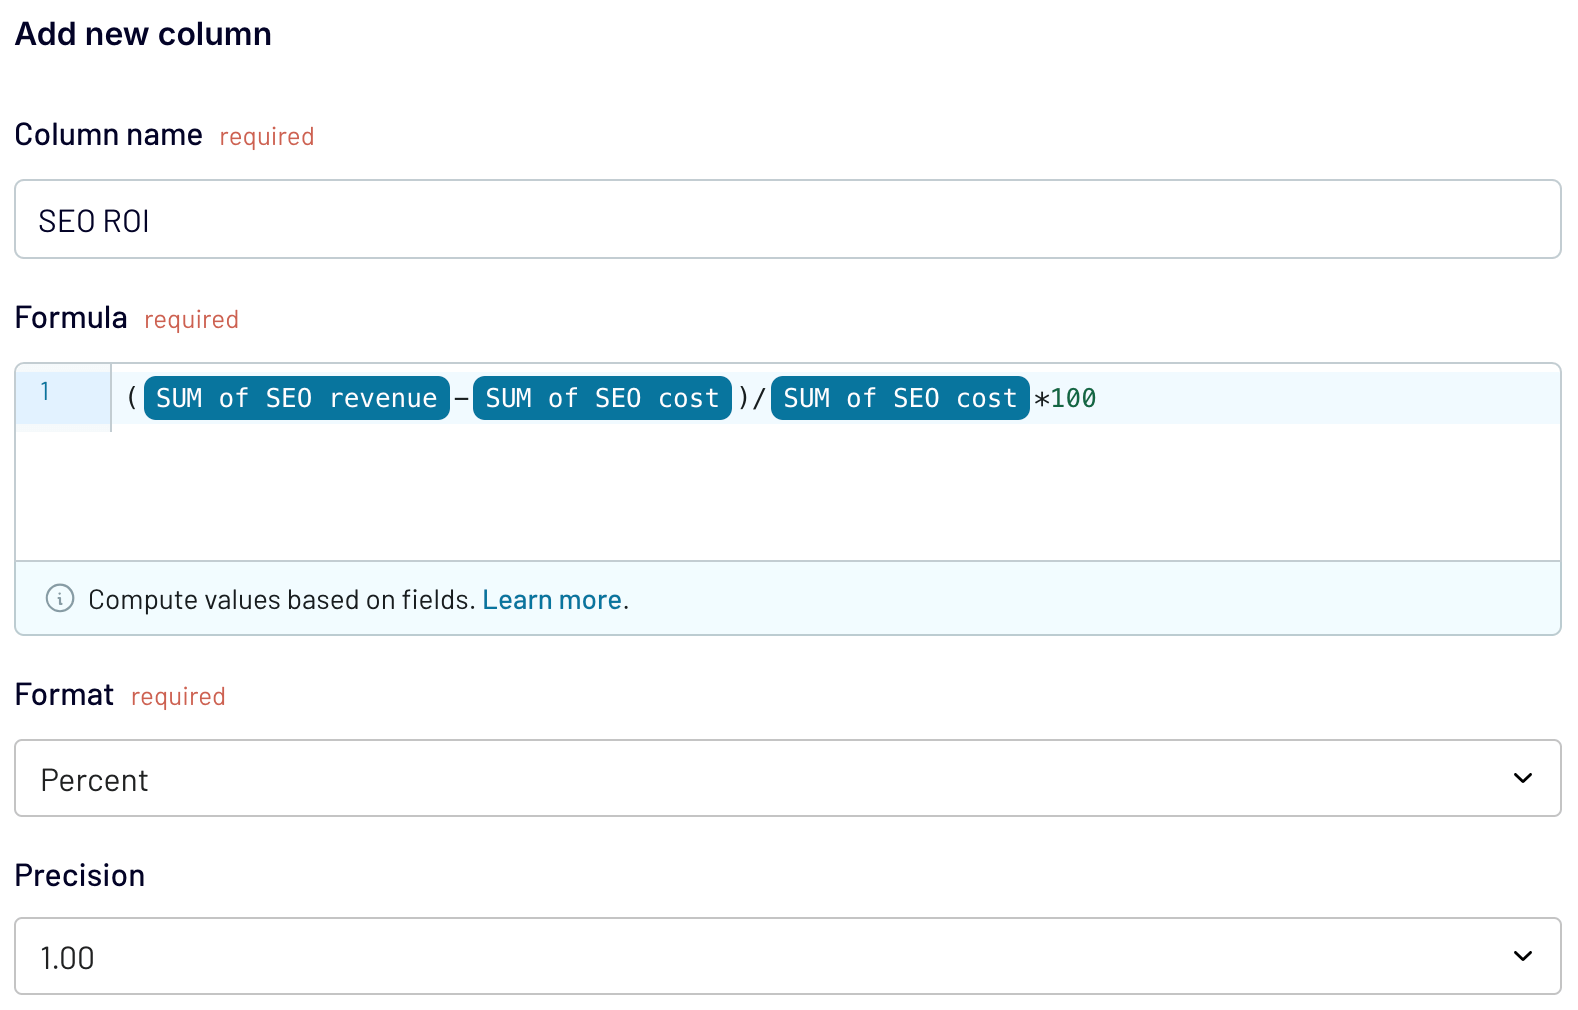
Calculate your return on investment
Navigate to Formula to create a calculable column that will return the SEO ROI. Apply the formula for this metric, but use your column names respectively:
SEO ROI (%) = (SEO revenue – SEO costs) ÷ SEO costs × 100

Suppose your SEO campaign generated $150,000 in revenue over the course of one month, with an investment cost of $30,000. The calculation would look like this:
(150,000 – 30,000) ÷ 30,000 × 100 = 400%
Your ROI is 400%, meaning that for every $1 spent on SEO, you’ve earned $4 in return.
Once you’ve finished the calculation, proceed to choose your destination for data export and set it up following the in-app instructions. Next, configure a schedule for automated data refresh to keep your report in sync with any changes to the source. The available intervals range from monthly to as frequent as every 15 minutes.

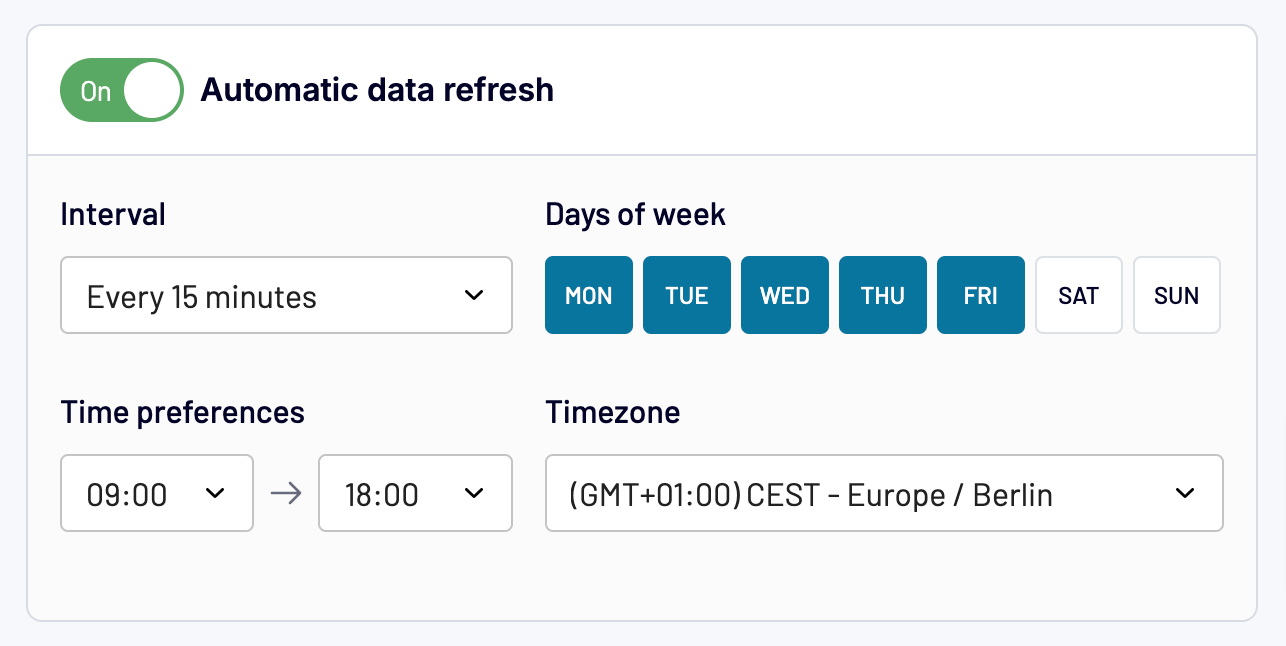
Finally, save the settings and run the data export.
SEO ROI benchmarking and the data to use for it
So, you’ve calculated your ROI to be 400%. But how do you know if it’s up to standard? To answer this, you need to compare your return on SEO efforts with industry benchmarks. This allows you to determine whether your strategy is succeeding, staying on track, or (hopefully not) underperforming. The data you need for this is the latest industry-specific SEO ROI statistics. For example, check out this one, with numbers averaged over a three-year period:
| Industry | ROI |
|---|---|
| Addiction treatment | 736% |
| B2B SaaS | 702% |
| Biotech | 788% |
| Construction | 681% |
| E-commerce | 317% |
| Financial services | 1,031% |
| Higher education and college | 994% |
| HVAC services | 678% |
| Industrial IoT | 866% |
| Commercial insurance | 758% |
| IT staffing | 612% |
| Legal services | 526% |
| Manufacturing | 813% |
| Medical device | 1,183% |
| Oil and gas | 906% |
| PCB design and manufacturing | 1,101% |
| Pharmaceutical | 826% |
| Real estate | 1,389% |
| Solar energy | 770% |
Benchmarking is frequently mistaken with forecasting, which is about predicting future outcomes based on historical data and other factors. Let’s break it down for better understanding.
What is SEO ROI forecasting, and what data does it require?
Whether you’re handling search engine optimization in-house or as an agency, you must know how to allocate resources, prioritize SEO efforts, and adjust your campaigns. Therefore, it’s necessary to forecast the growth and revenue you expect to generate.
Key forecasting components include:
- Accurate data
- Market size and dynamics
- Goals and KPIs based on business needs
- The forecasting method you select
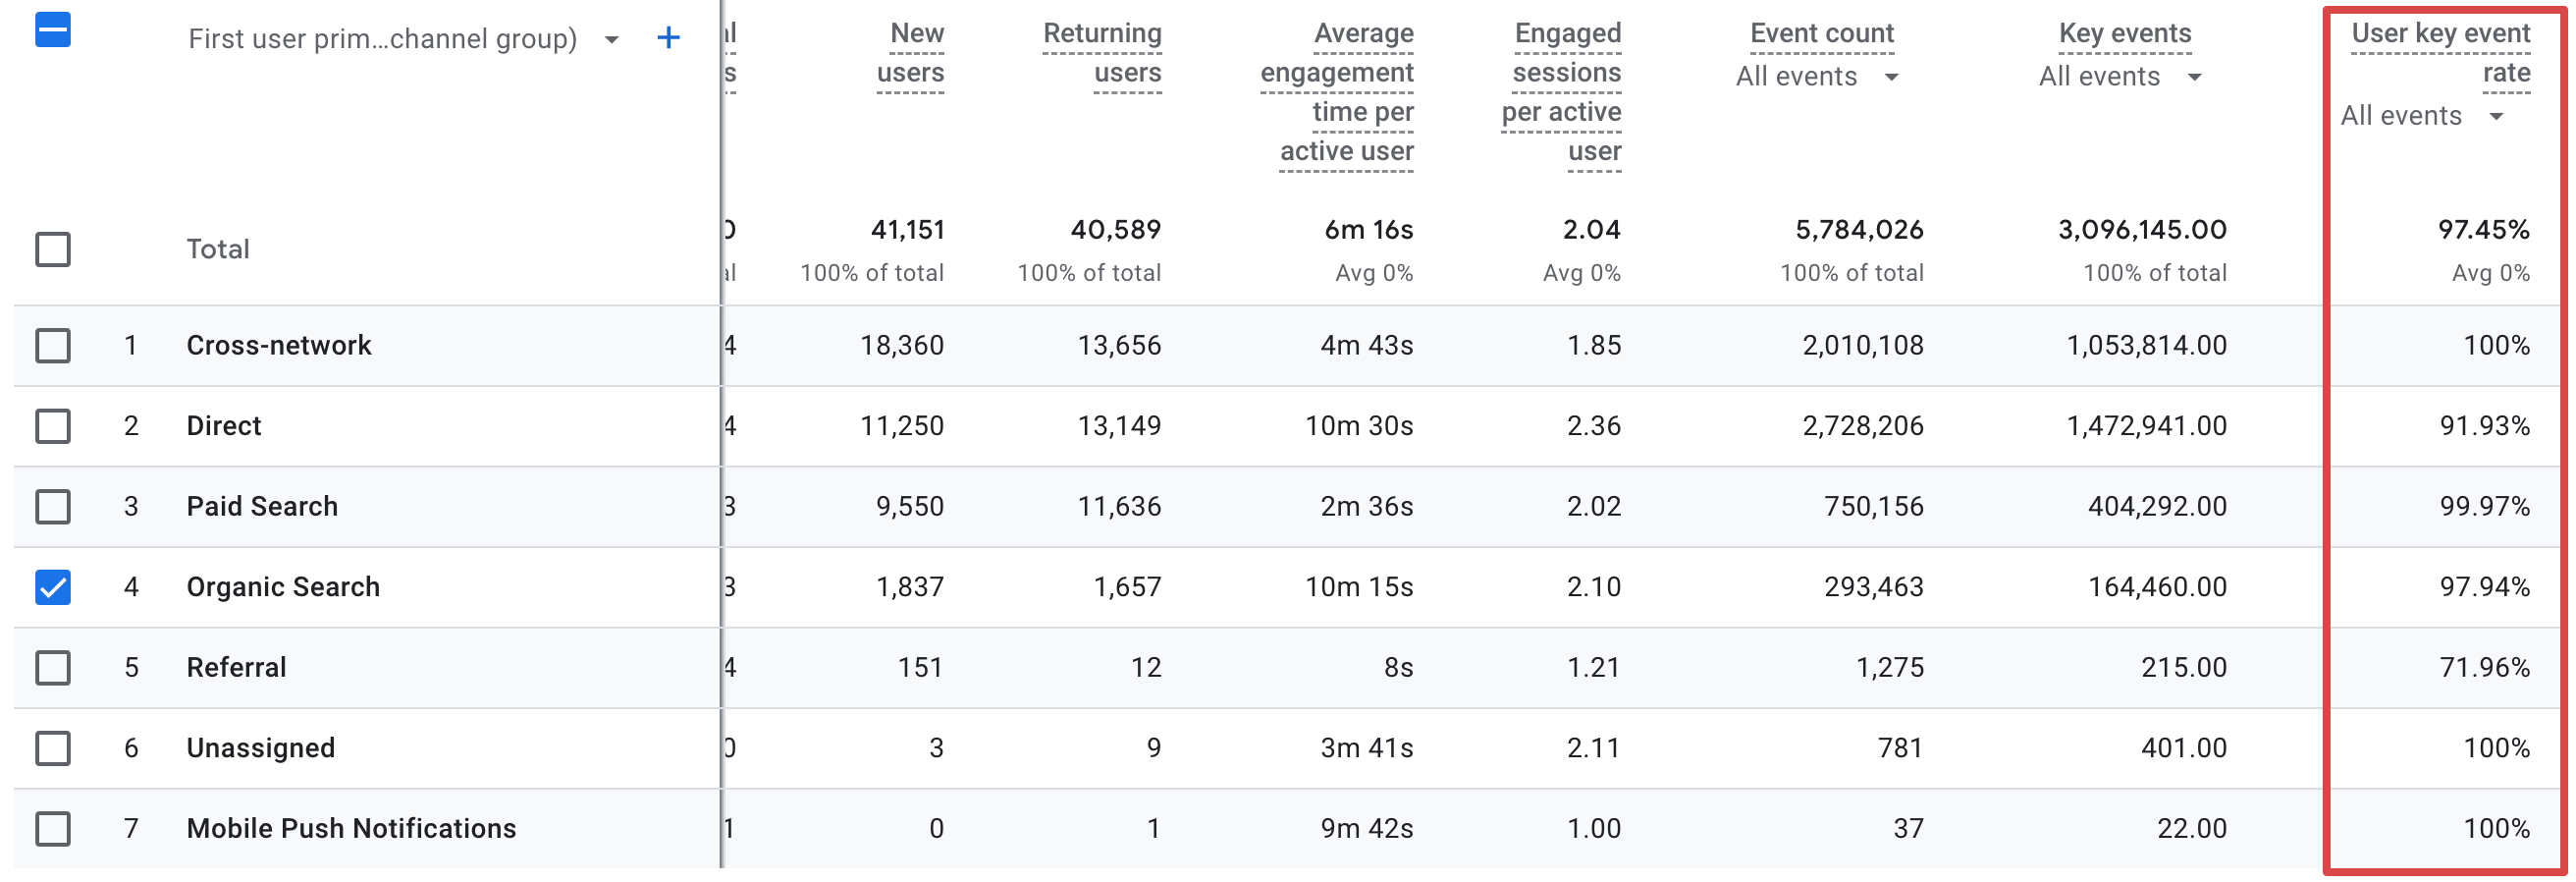
As for the data required, the first thing to consider when projecting returns is the average conversion rate, available in Google Analytics reports as the key event rate. This metric directly impacts forecasting because it shows how effectively your SEO efforts translate into desired outcomes.

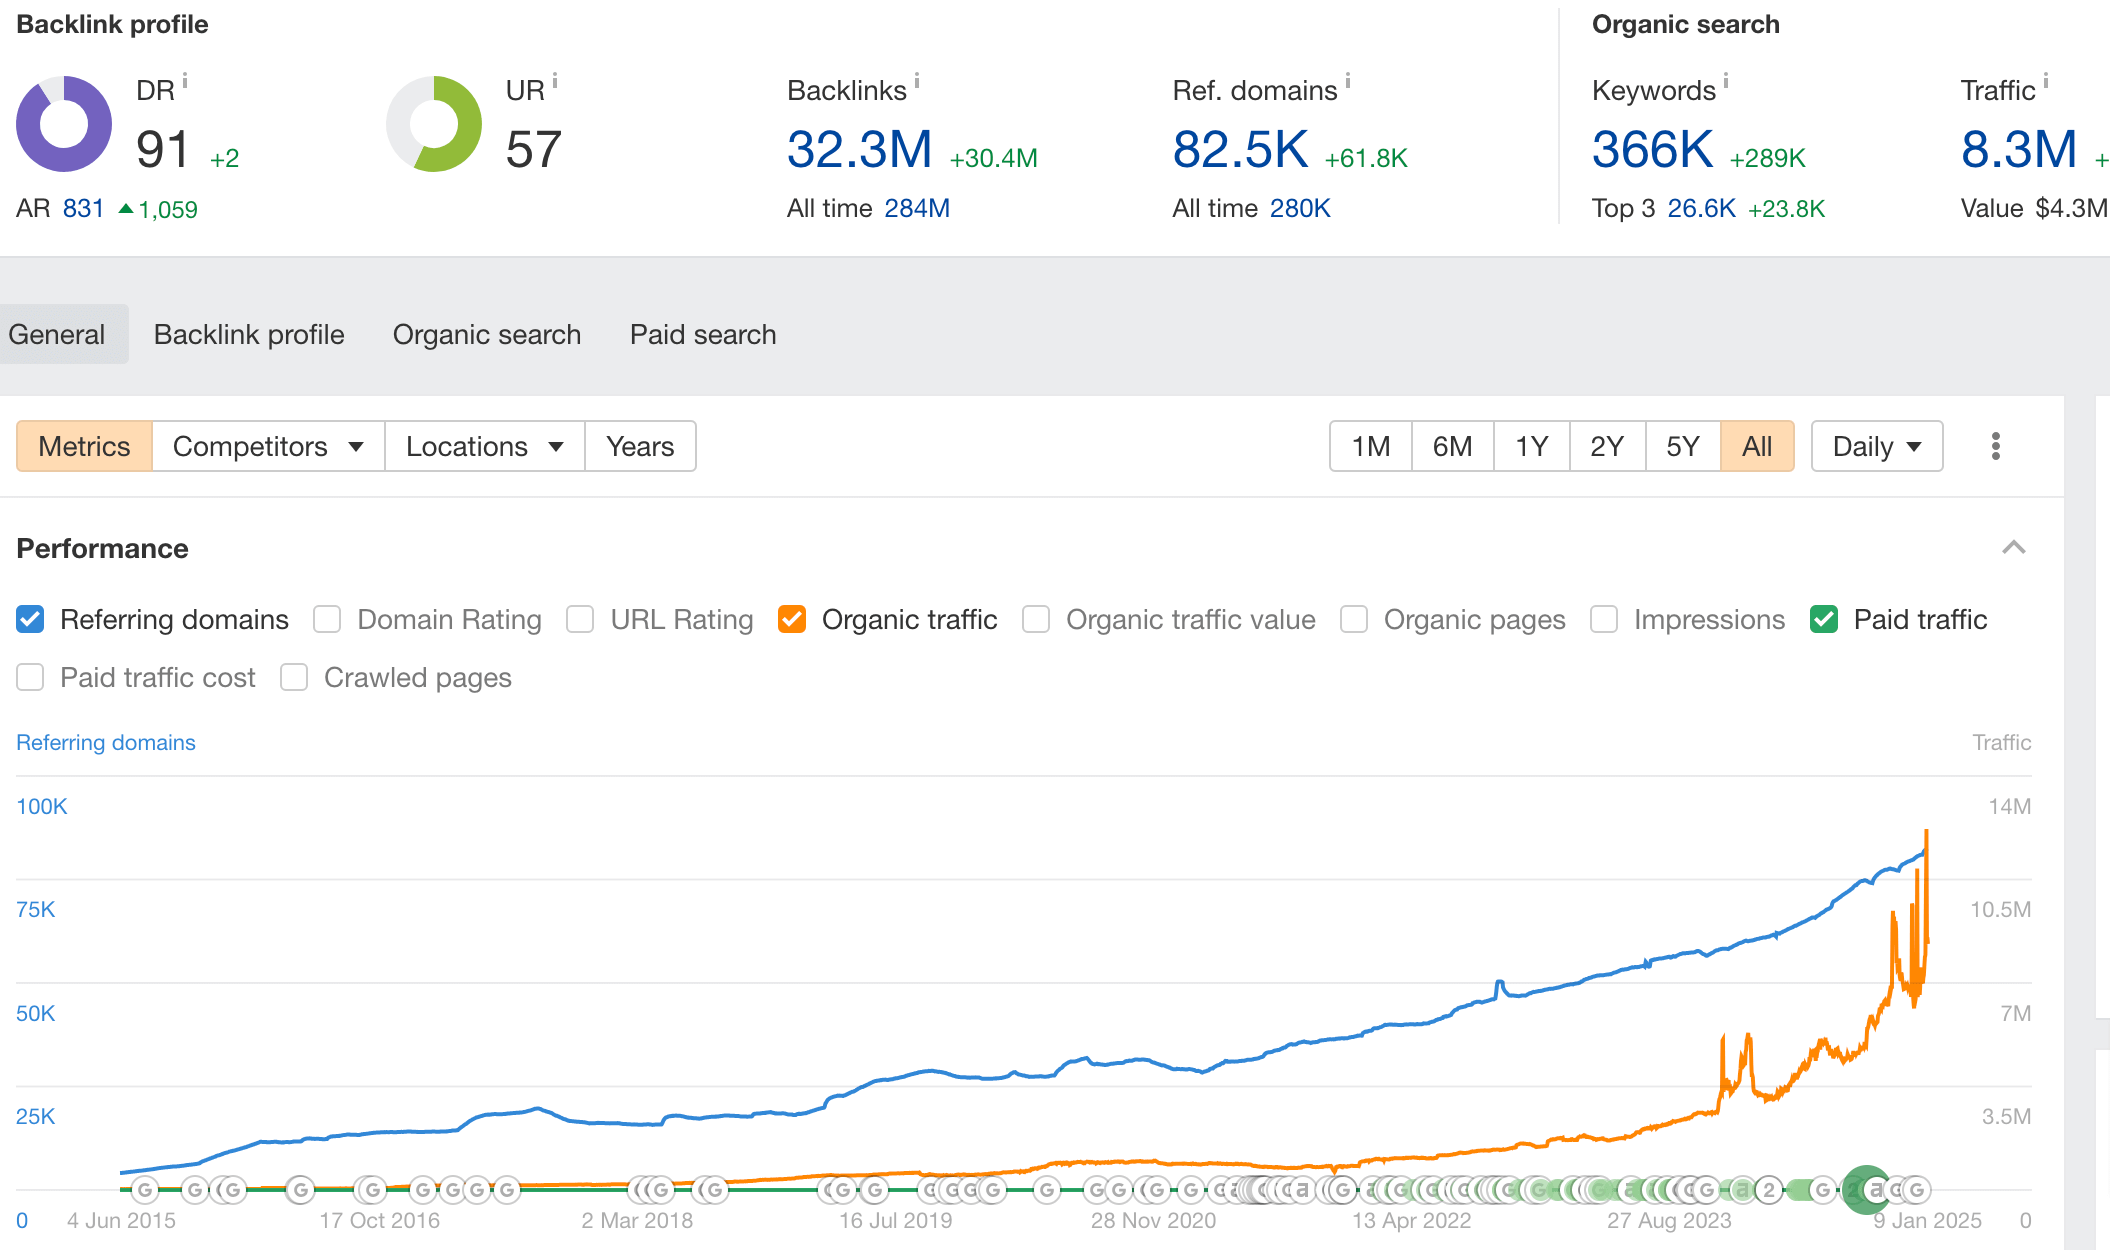
Next, dive deeper into your historical performance, which is easily observable with specialized SEO tools like Ahrefs. For example, go to Ahrefs’ Site Explorer and enter your website’s domain. This way, you’ll receive a detailed overview of your organic search channel performance and be able to compare it with past results.

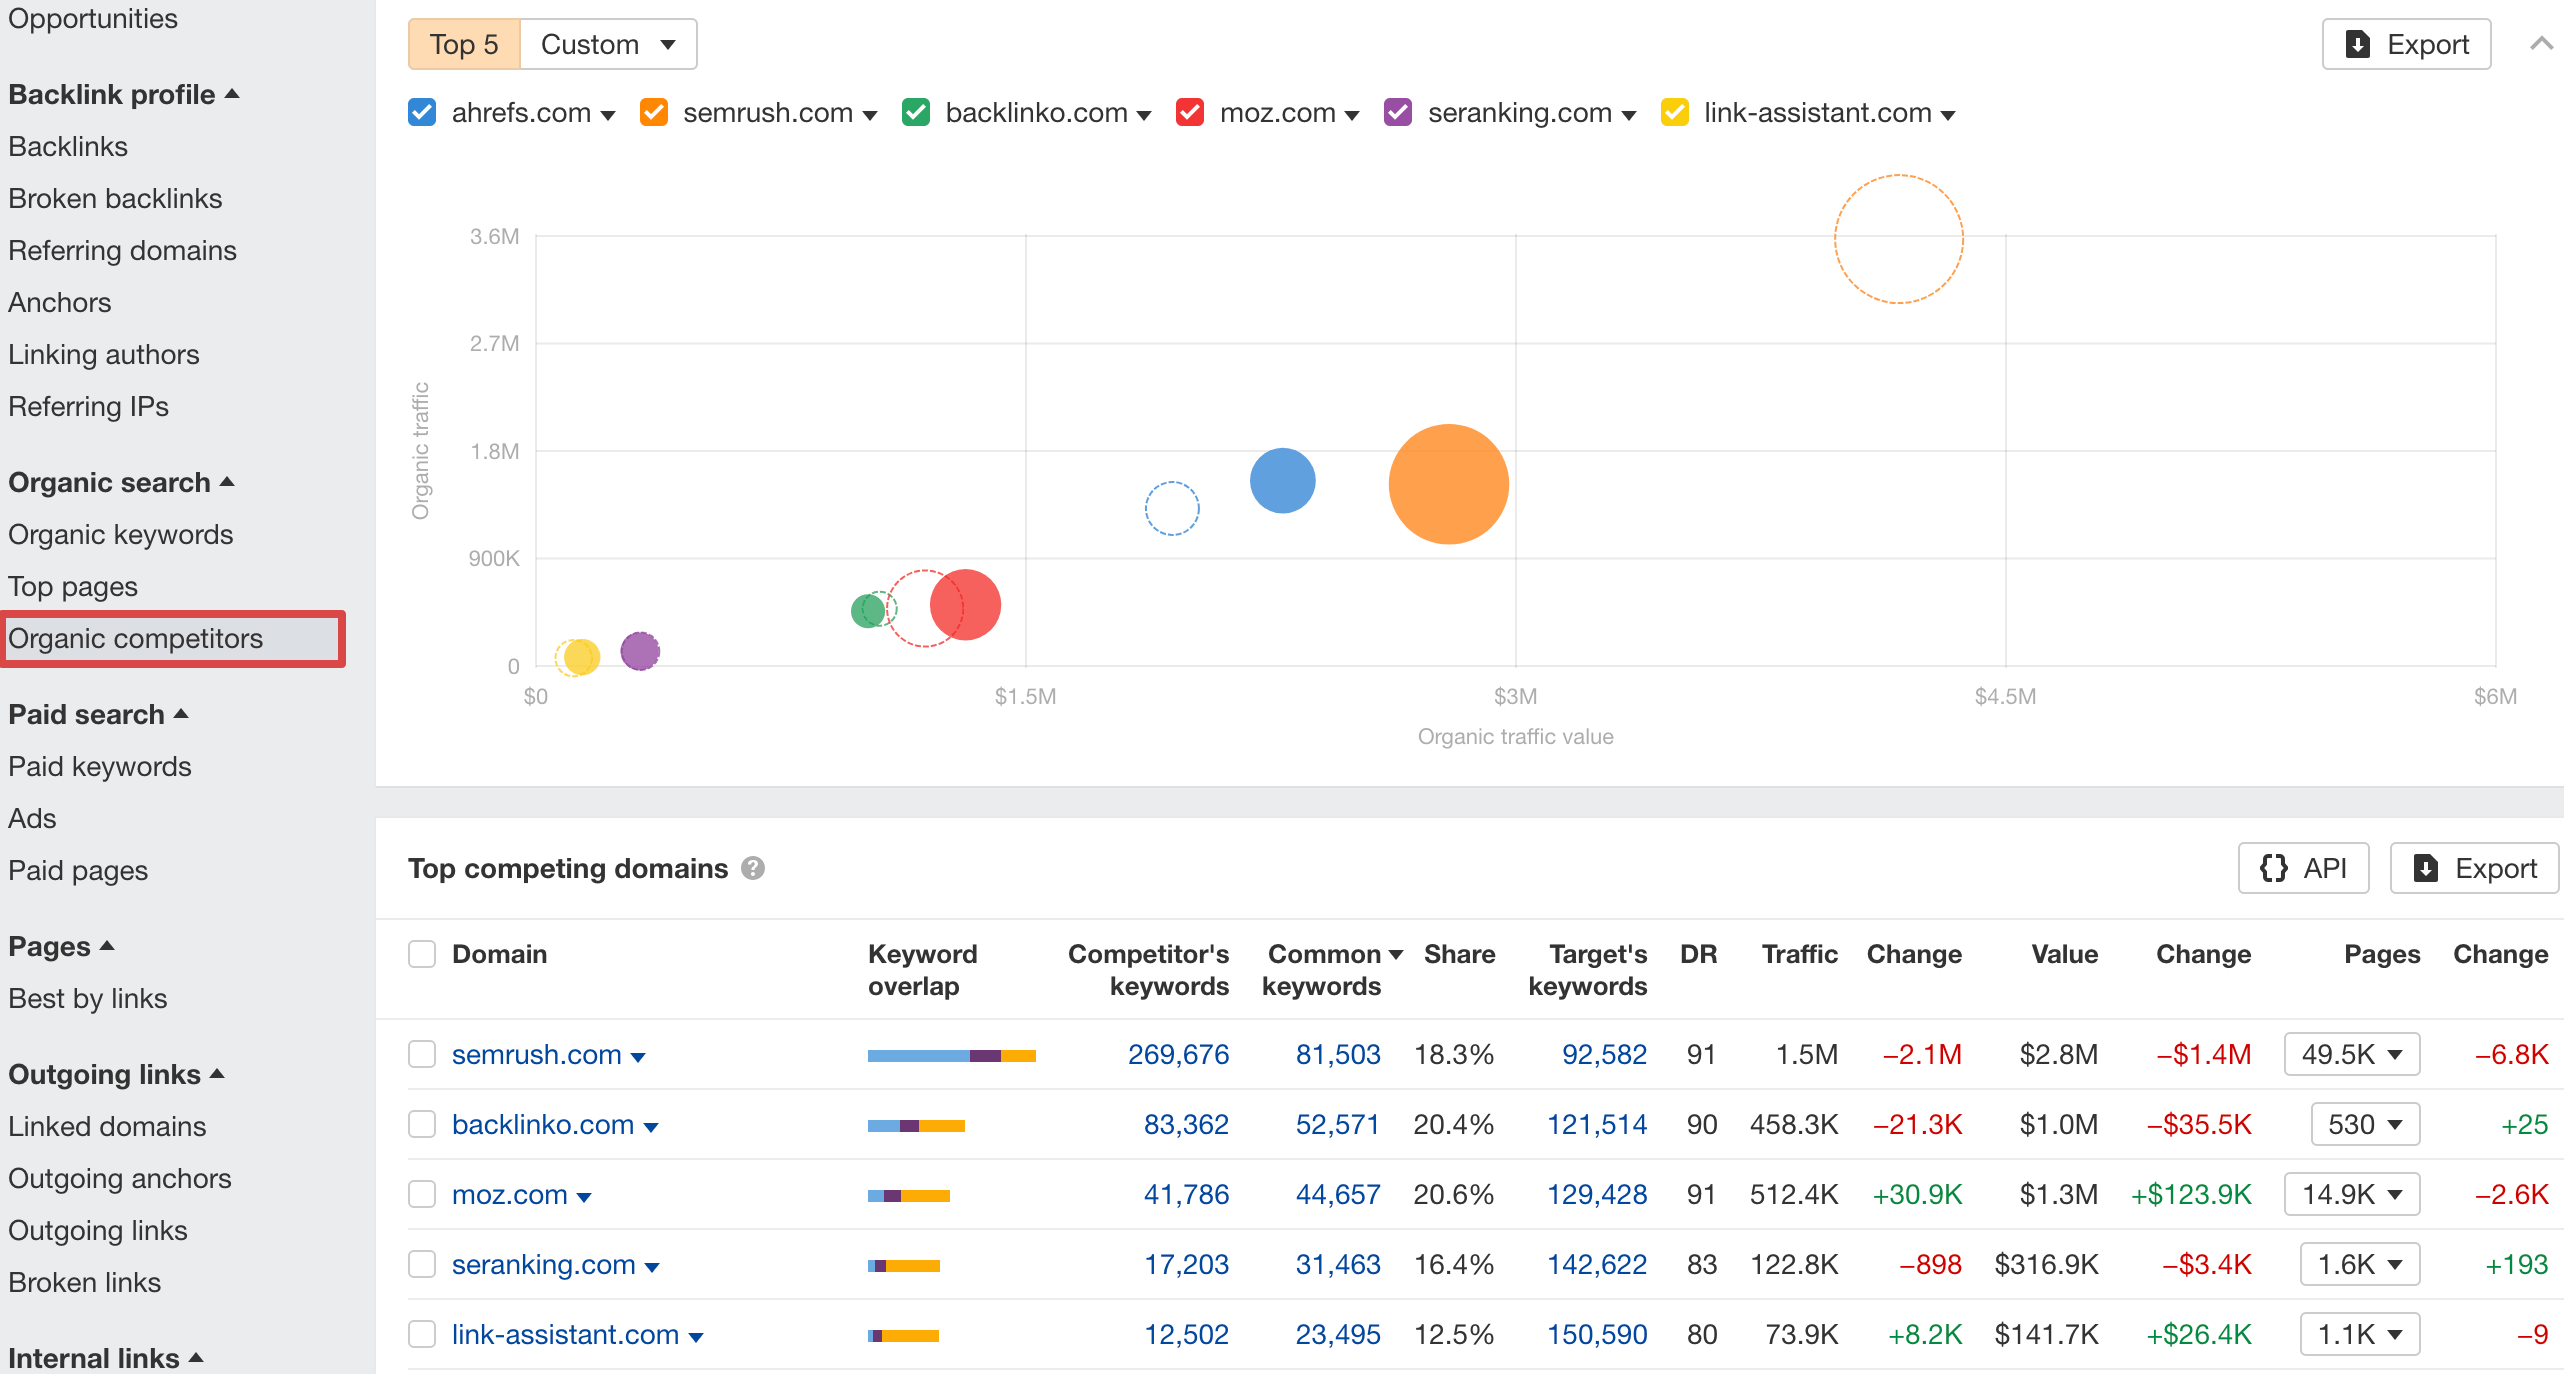
Next, you need to assess your traffic potential by analyzing your competitors in the market. In Ahrefs’ Site Explorer, go to Organic competitors and look at the overlap of keywords. This will show the connection between organic traffic, industry content, and competitors’ performance, including their search traffic, its value, and trends over time.

For more insights, go back to Overview in the left sidebar, scroll down to the Top organic competitors graph, click the Open in button under the competitor list, and select Overview 2.0.

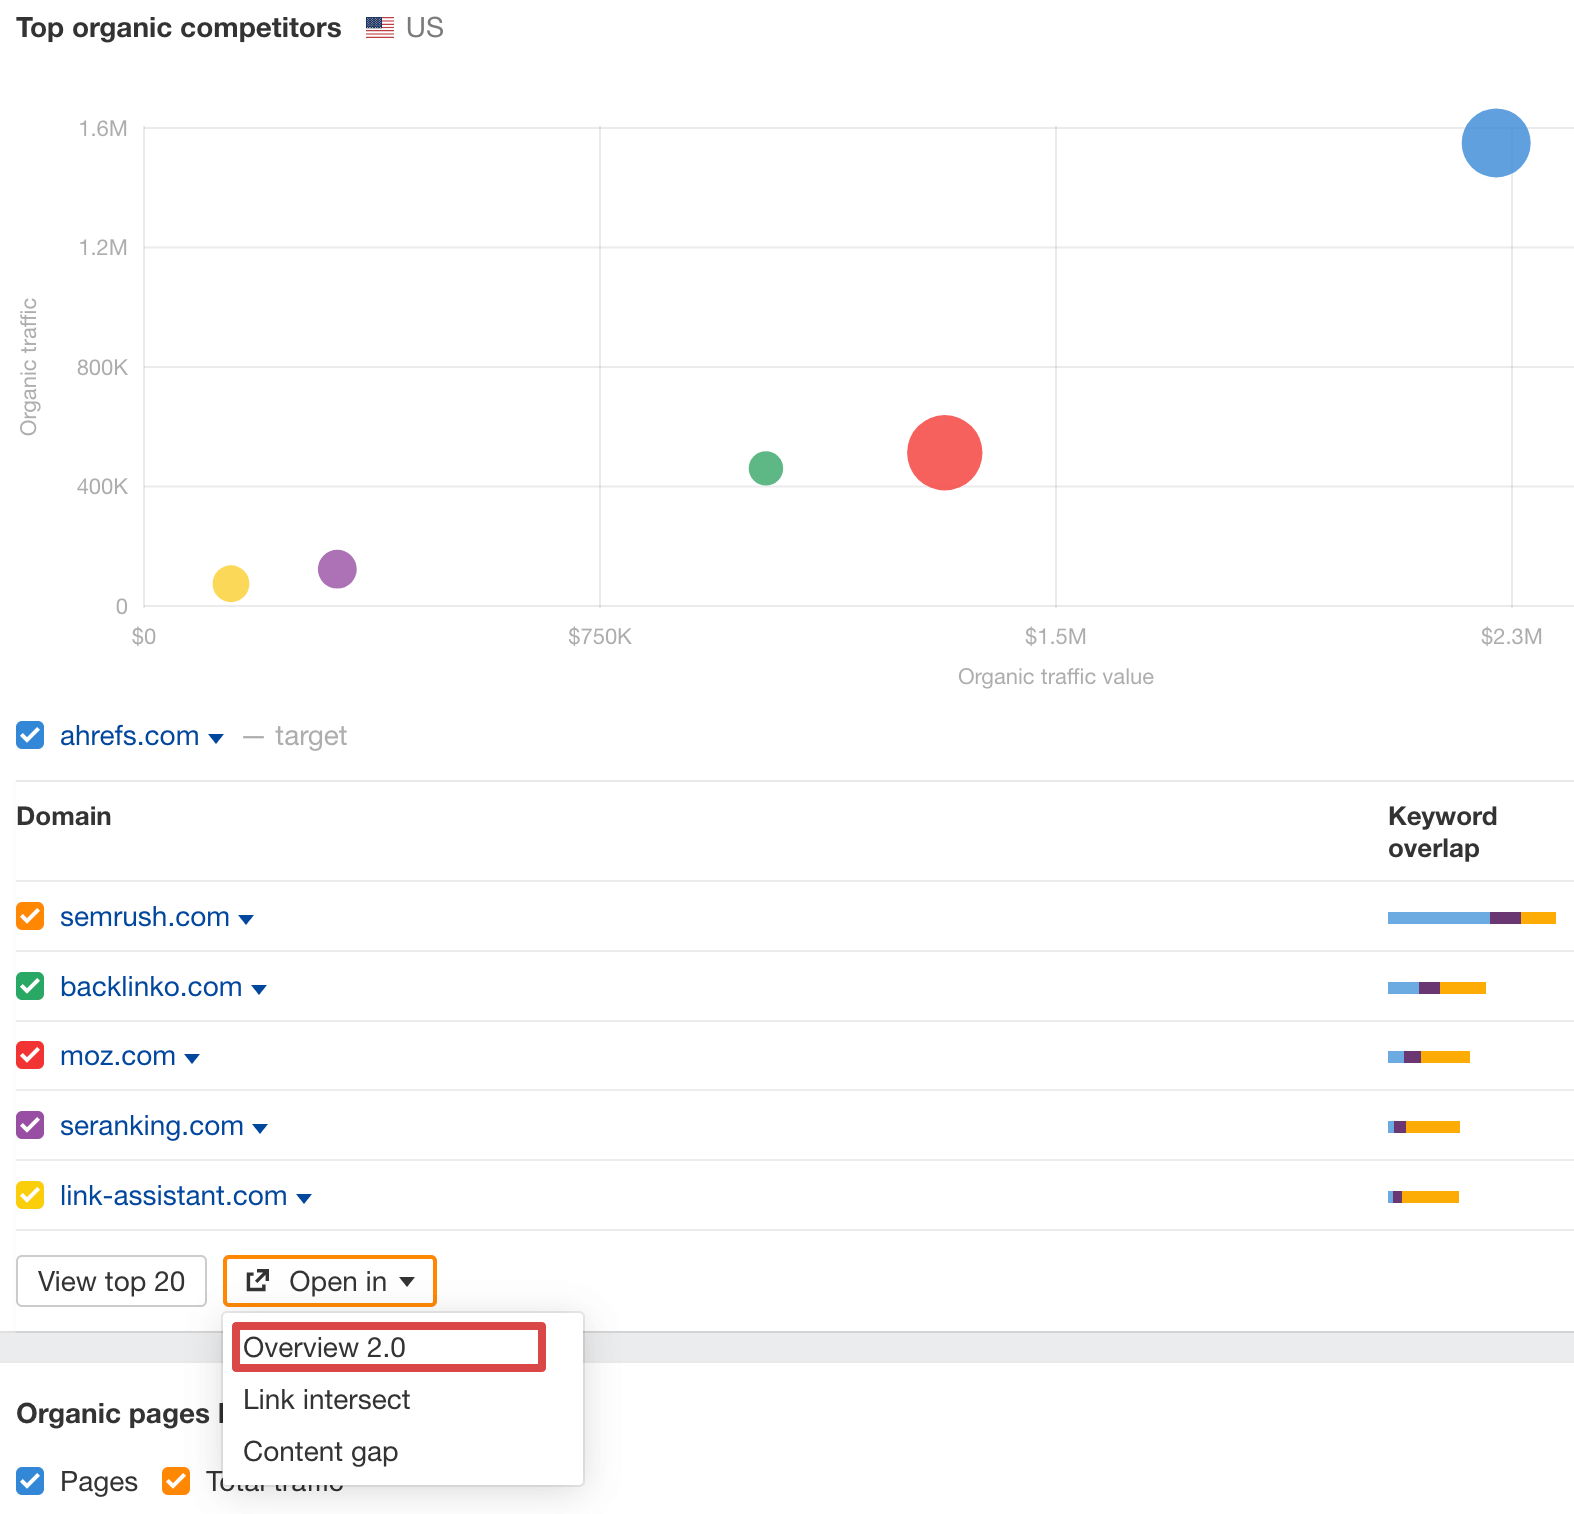
Now, you can compare your performance with that of your competitors over time.

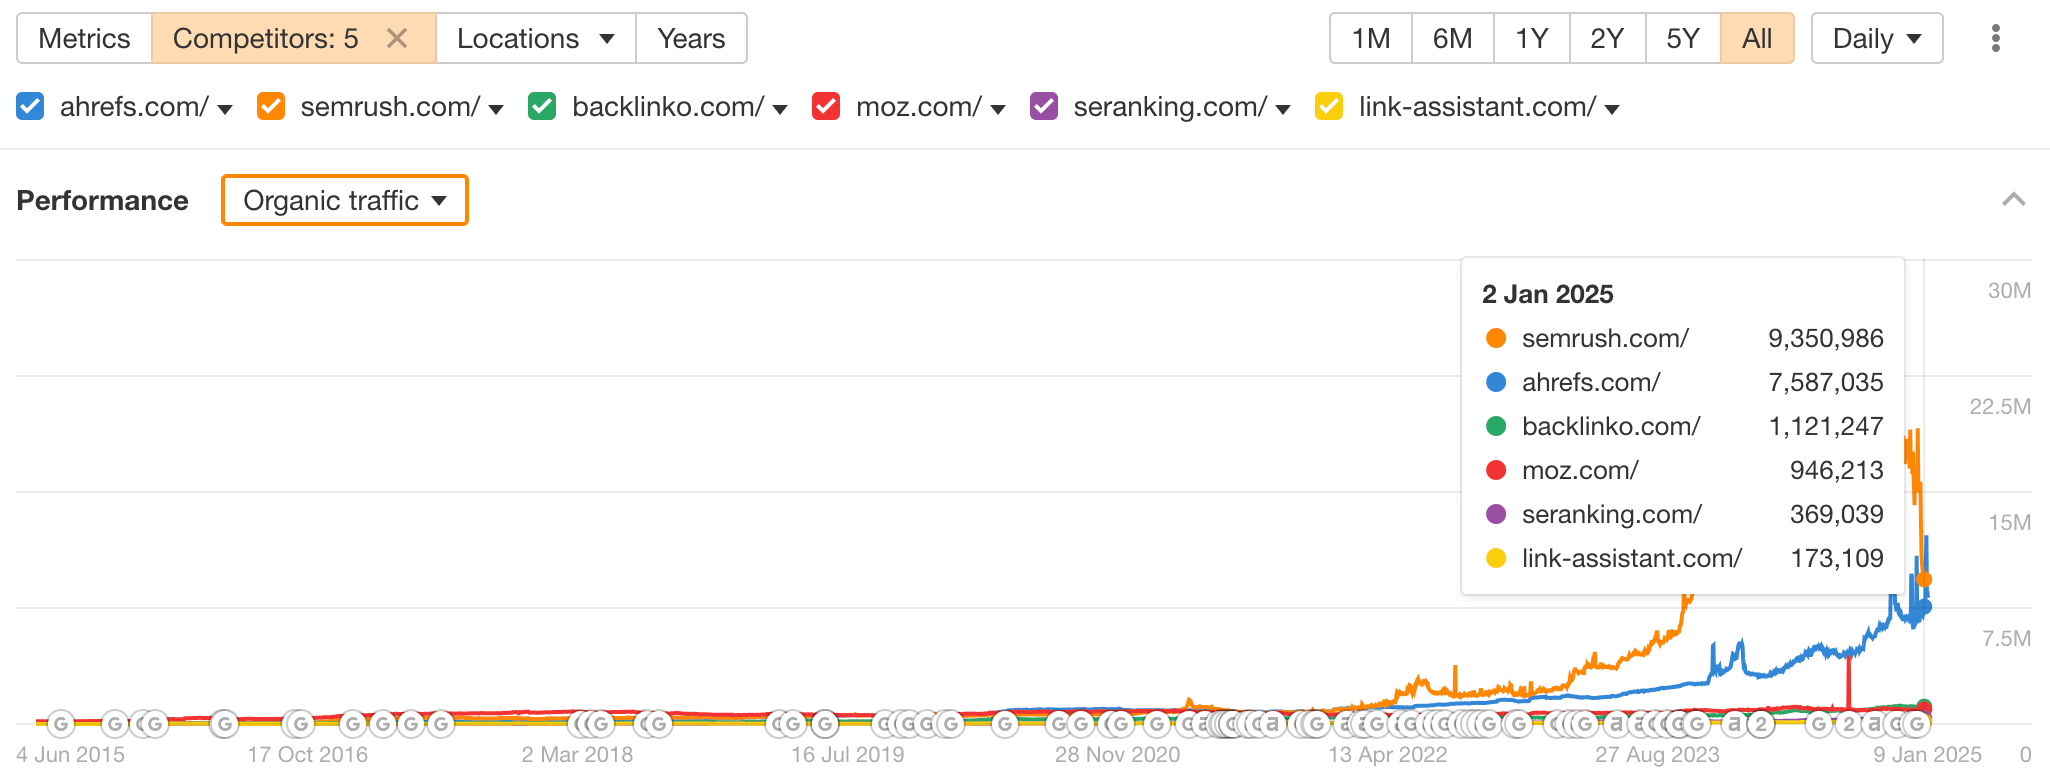
You’re also free to choose from the Performance options to compare your results with competitors based on multiple criteria over time, including organic traffic value, share of voice, and more.

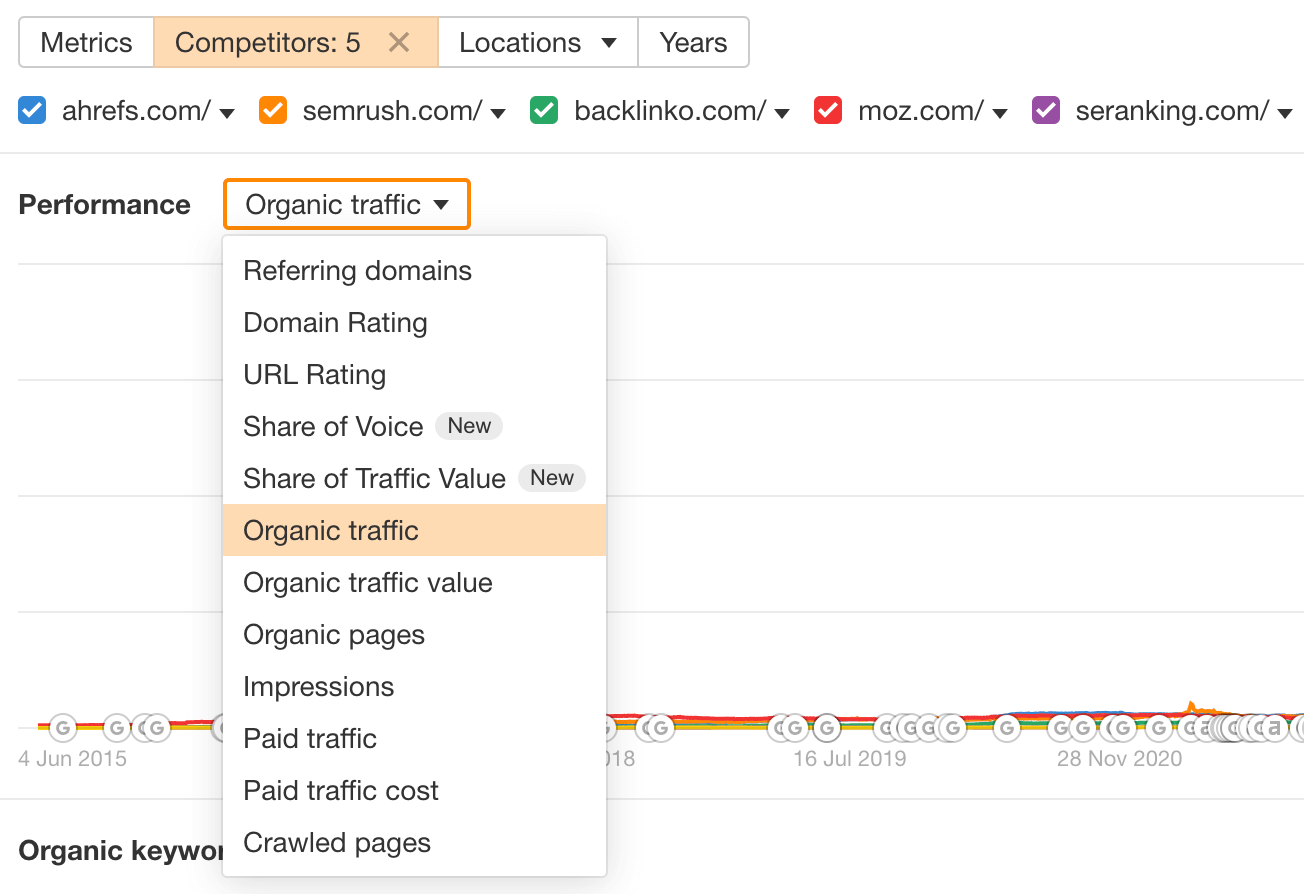
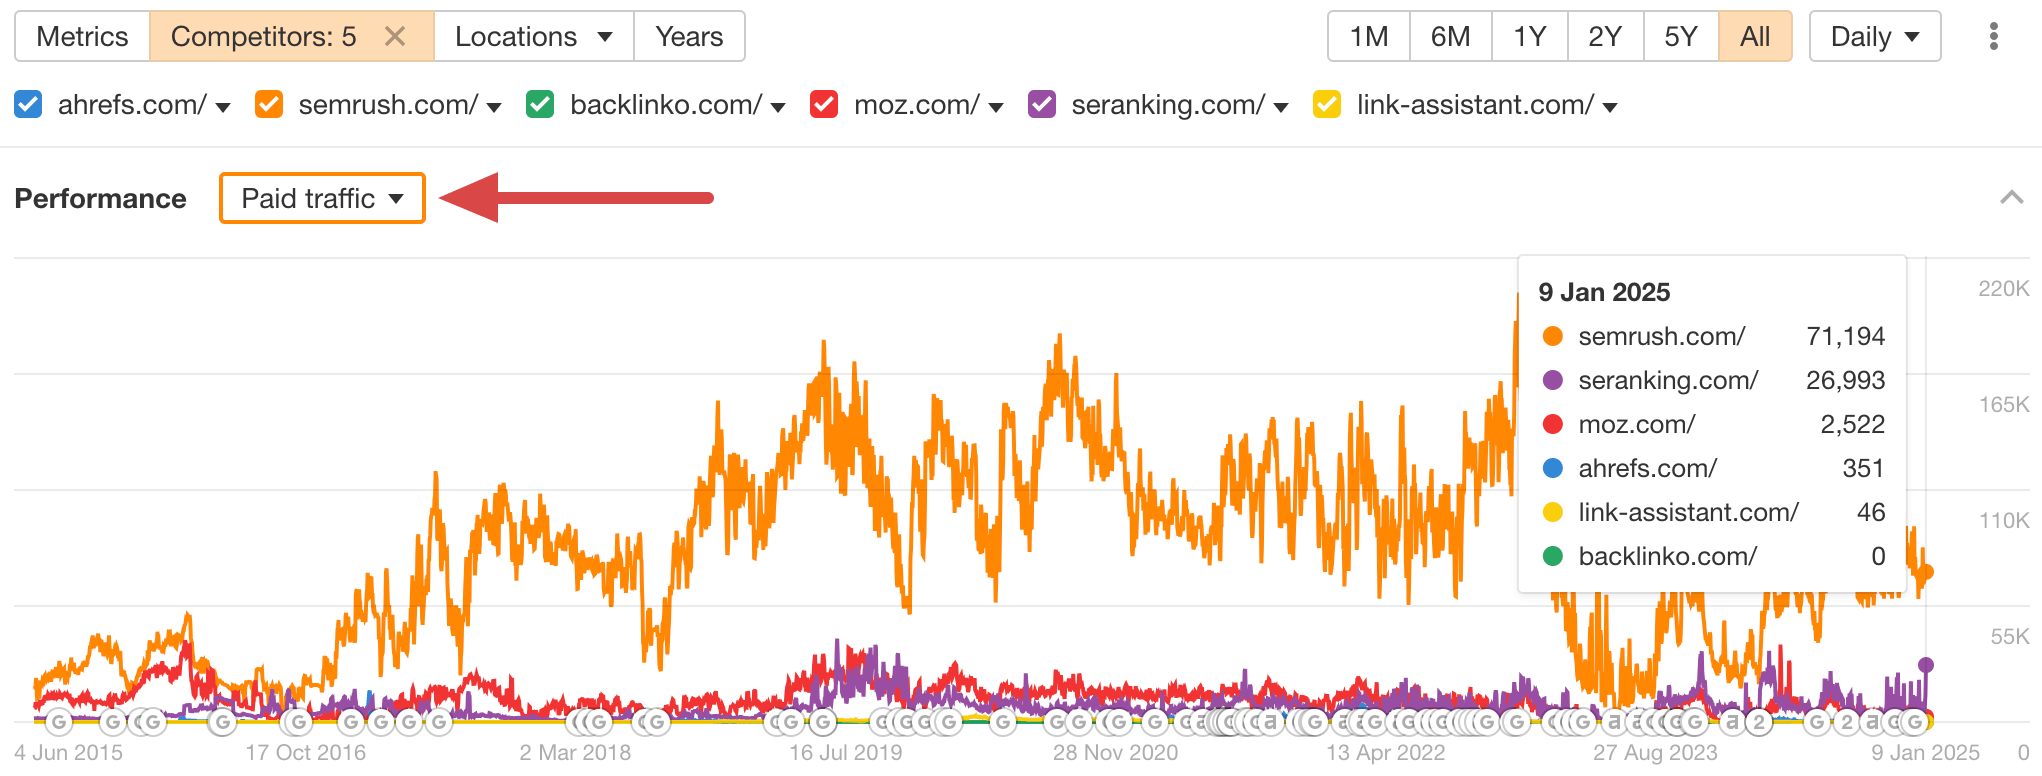
For example, if you choose Paid traffic, you’ll see whether competitors drive traffic through pay-per-click (PPC) ads.

Remember that this data is just one factor in the process. To learn more, read our dedicated article on marketing forecasting. But for now, let’s address the other questions you likely have about SEO ROI calculation and tracking.
Challenges of calculating SEO ROI
Let’s review the challenges you’ll potentially face when measuring and communicating SEO return on investment:
- Attribution problem: Prior to making a purchase, a customer interacts with multiple touchpoints – for example, starting with an organic search visit to your site, followed by subscribing to a newsletter and interacting with paid ads. However, there’s no universal way to assess the impact of each channel, including SEO, on conversion. Furthermore, it’s challenging to attribute offline actions, such as in-store purchases, to organic search.
- Non-financial benefits: SEO provides value that extends beyond conversions. This includes enhanced brand visibility and awareness, a better user experience, increased authority, higher customer trust, more organic traffic, plus stronger customer engagement and loyalty. These long-term advantages are difficult to quantify in financial terms.
- Long time frames for returns: Significant results from organic search take time. Consequently, there’s often a considerable gap between when you invest in SEO and when you see a positive return. This delay means you must account for the changing value of money over time. For example, you can overcome this challenge with:
- Discount rate, which is a percentage used to adjust future cash flows to their present worth, reflecting the time value of money.
- Net present value (NPV), which calculates investment profitability through the difference between the present value of expected returns and that of costs, considering the discount rate.
- SEO’s impact on retention and churn rate: Retention rate refers to the percentage of customers who stay loyal for a specific period, while churn rate reflects those who leave. Both metrics illustrate customer loyalty and satisfaction, which influence revenue and can be affected by SEO. However, there is no direct way to quantify this impact.
These challenges touch on many metrics that influence the final return. Therefore, ROI is just the tip of the iceberg, with many more figures beneath the surface to consider when assessing your organic search performance.
Bonus: Dashboard templates for SEO analytics beyond the ROI metric
To gain a broader perspective on your organic search performance, use Coupler.io’s Google Sheets, Power BI, or Looker Studio SEO report templates. This way, your Google Analytics and Search Console data will be automatically turned into actionable insights. Review some of these templates below.
All-in-one marketing analytics dashboard
This dashboard provides an overview of your marketing campaigns across multiple channels, including organic search. It lets you analyze your SEO performance in the broader context of your marketing efforts, or you can narrow the data down to the organic search channel.

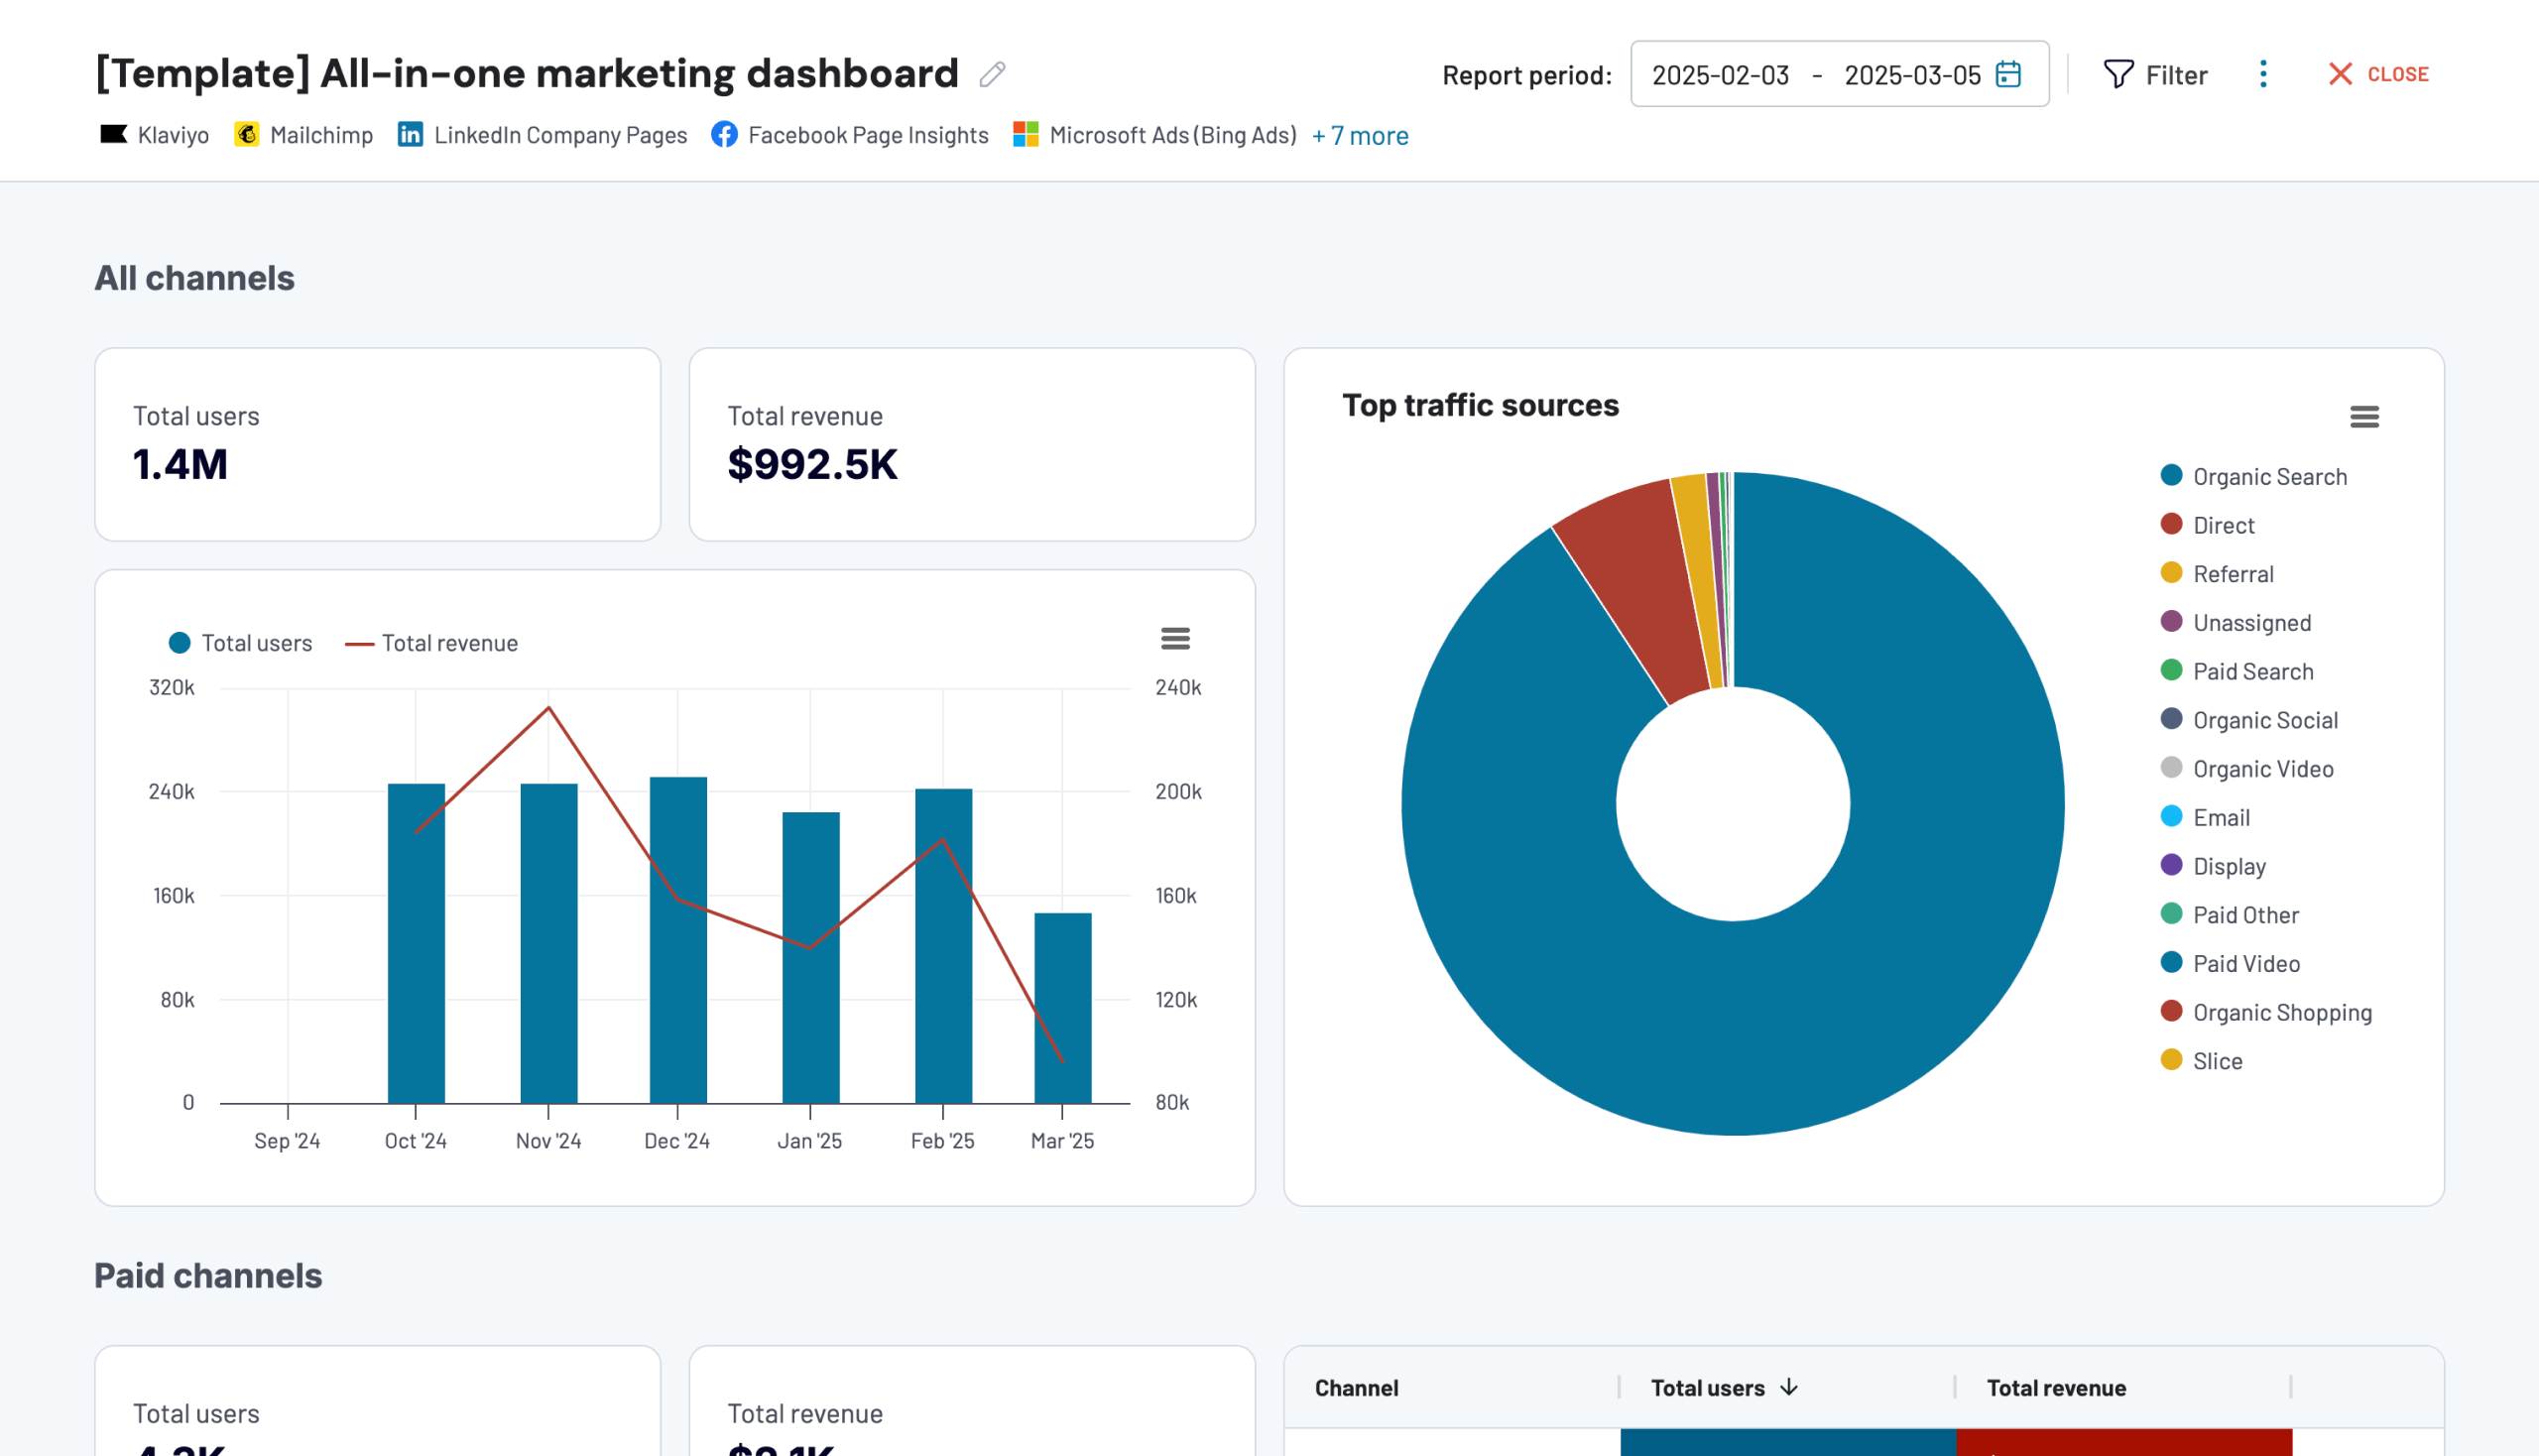
You can track metrics like total revenue and total users from Google Analytics as well as impressions, clicks, CTR, and average position from Google Search Console. Additionally, the data is filterable by session source, such as Google, Yahoo, Bing, and more.
The dashboard is available in Coupler.io and as a template in Looker Studio. Try it right away for free! Set up the dashboard by following instructions inside the template and transform raw marketing data into actionable insights.
Google Analytics dashboard for multiple properties
This dashboard aggregates Google Analytics data from multiple websites into a single Looker Studio tab. Like the previous template, it combines data from various channels, including SEO. So, you can either filter data down to the organic search channel or compare its performance with others.

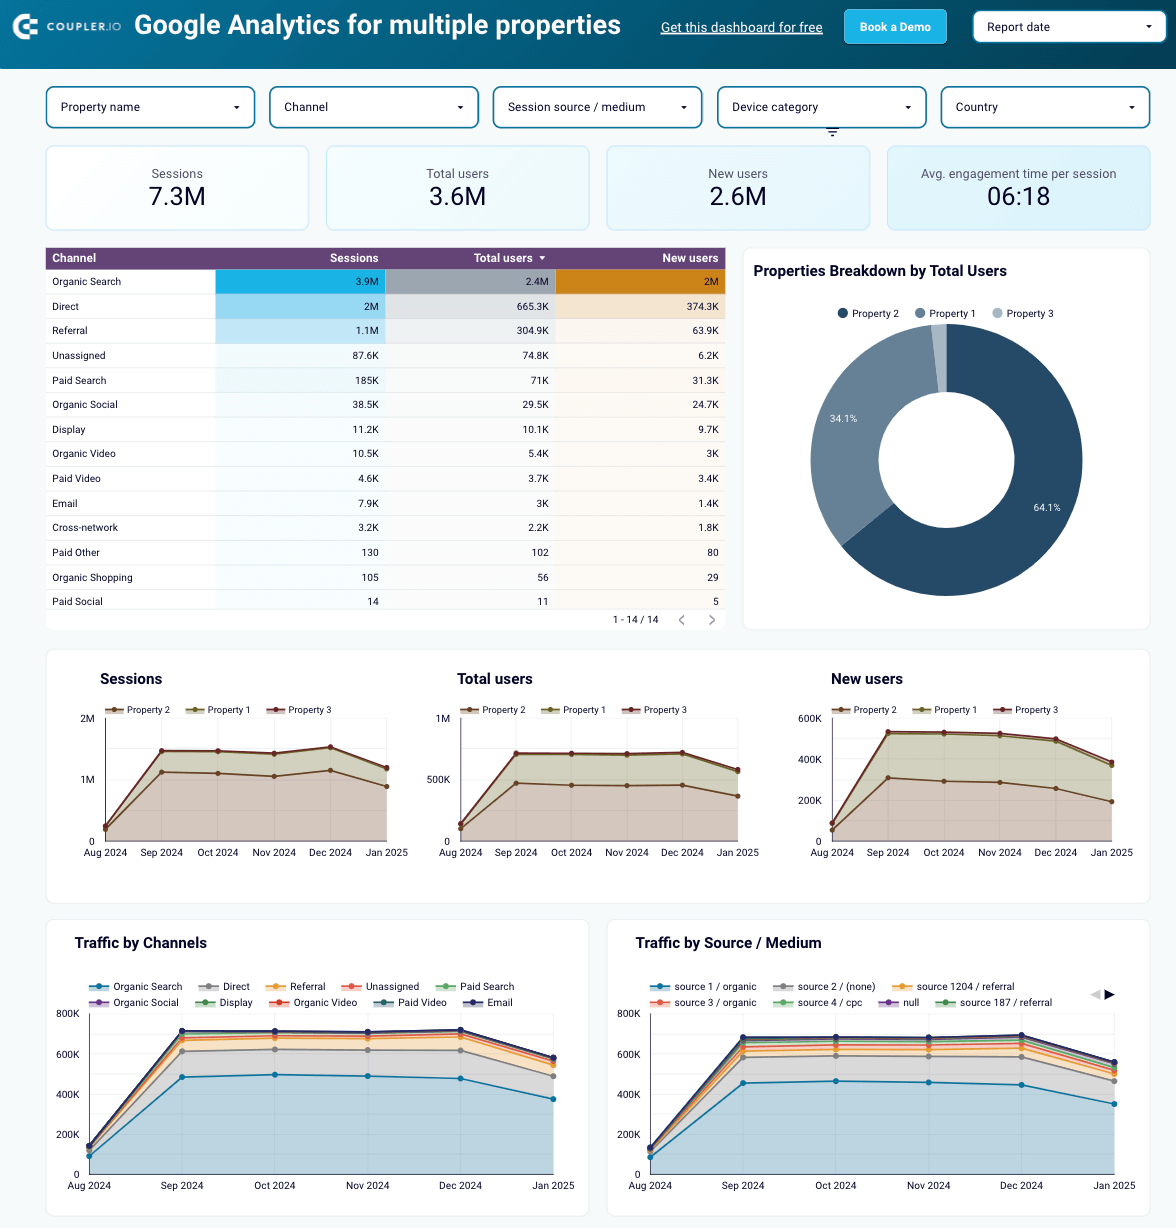
Use this dashboard to gain the following insights:
- Look at your SEO performance: Check the essential metrics and filter them by properties (websites) as well as other criteria.
- Track performance dynamics over time: Monitor the progress of traffic for all your websites month by month.
- Explore performance by countries: See a map showing where most of your traffic originates to make smarter decisions about localization efforts.
Navigate to the Readme tab inside the template to set up the dashboard according to step-by-step instructions.
Landing page performance dashboard
This one-page dashboard lets you know how effectively your landing pages drive traffic, engage visitors, and convert them into customers based on data from Google Analytics and Search Console.

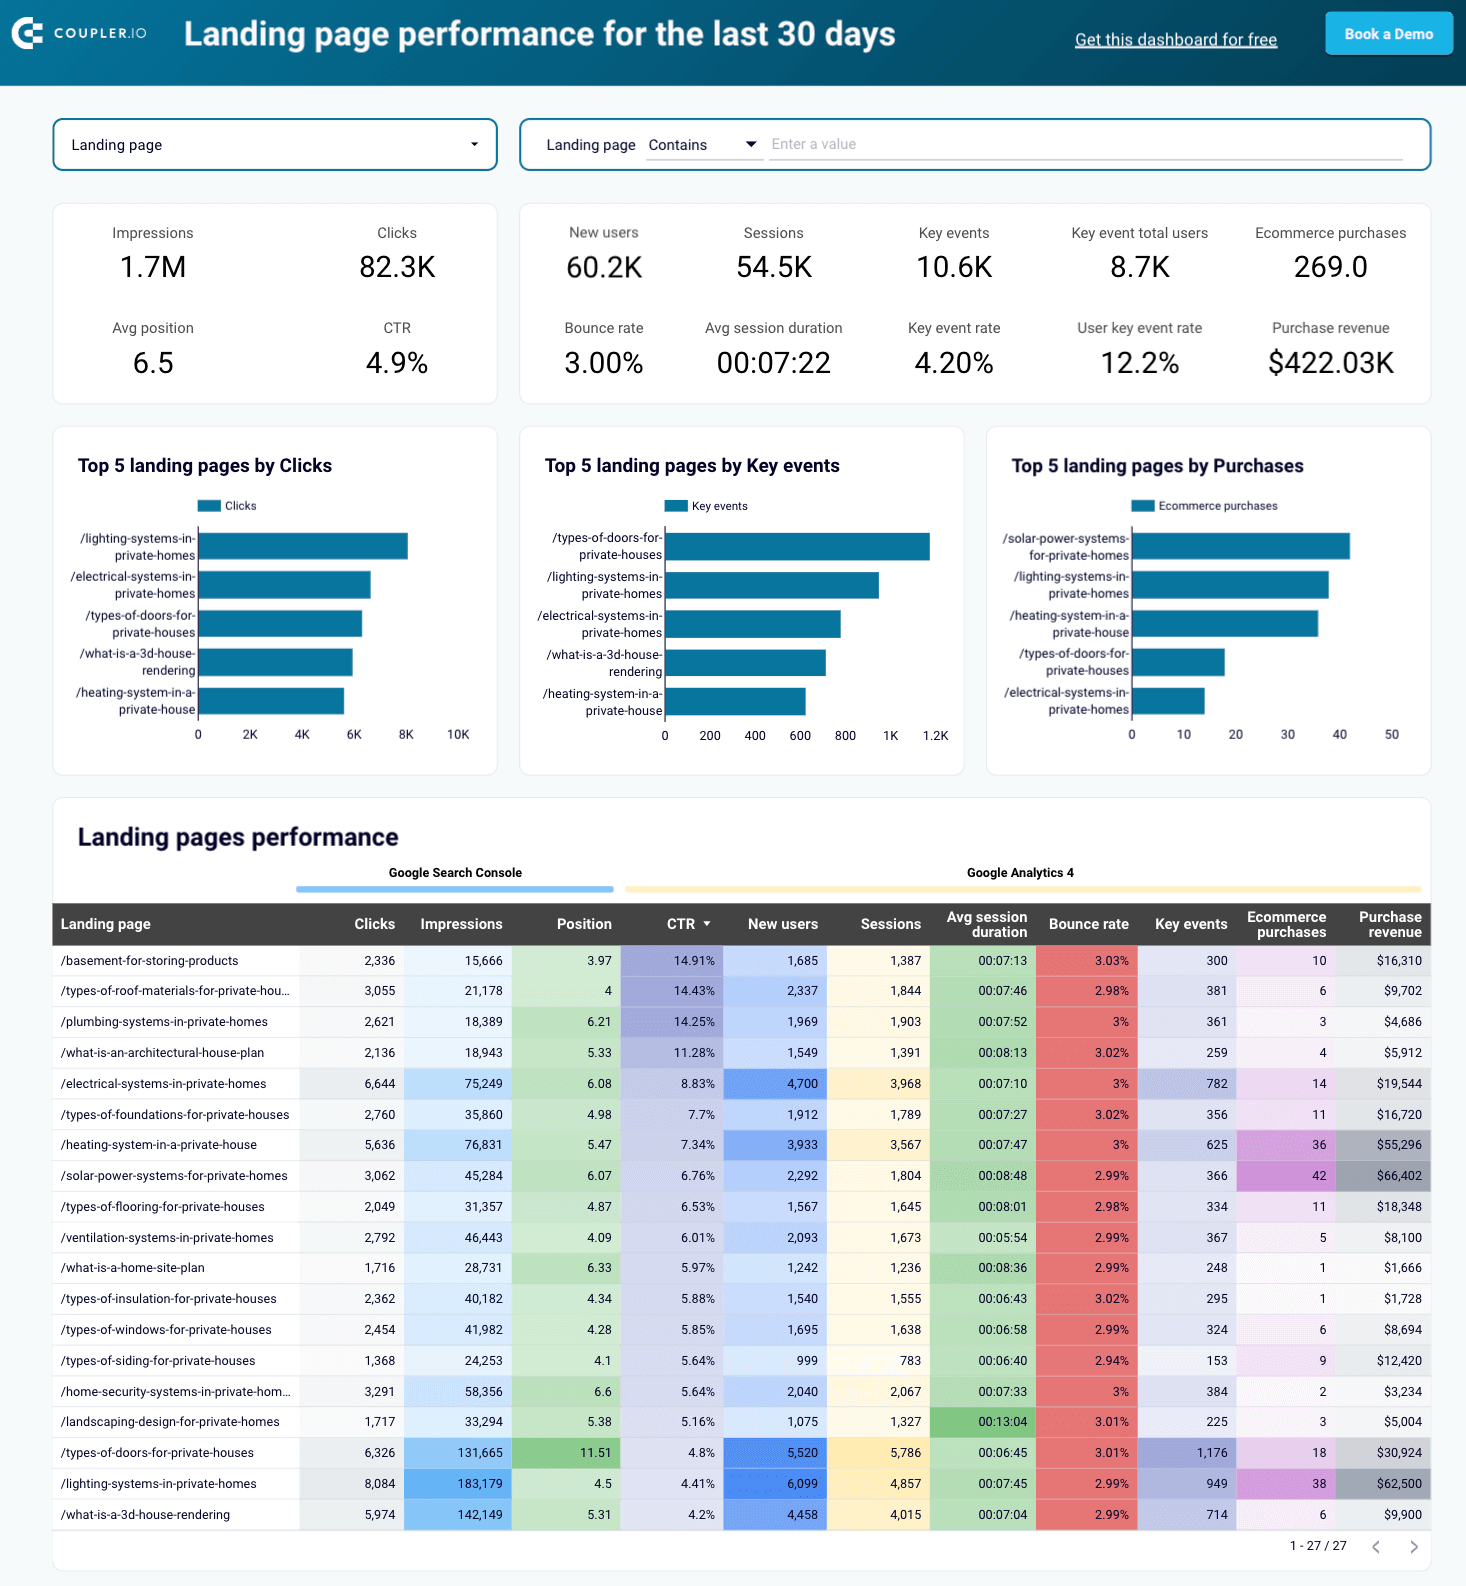
With this dashboard, you’ll reveal the following aspects of landing page performance:
- Optimize SEO: Use insights from Google Search Console data to improve landing page visibility and ranking by analyzing average position and CTR. Identify pages with low clicks but high conversions to find growth opportunities.
- Analyze landing page performance: See how each landing page is doing in terms of metrics such as clicks, impressions, average position, and CTR. Consider total users, sessions, and average session duration to understand user behavior.
- Measure user engagement: Monitor engagement with metrics like bounce rate, key event total users, and event count to identify which pages capture and retain your audience’s attention. Choose any of the key events to focus on specific actions and learn how users interact with critical elements of your landing pages.
- Evaluate ?onversion and revenue impact: Assess how your landing pages contribute to business outcomes by tracking users with key events, the user key event rate, and purchase revenue. Identify high-performing pages that drive revenue and optimize those that are underperforming.
The dashboard has two versions: one for Google Sheets and another for Looker Studio. To start using it, click the template’s Readme tab and follow the straightforward setup guide.

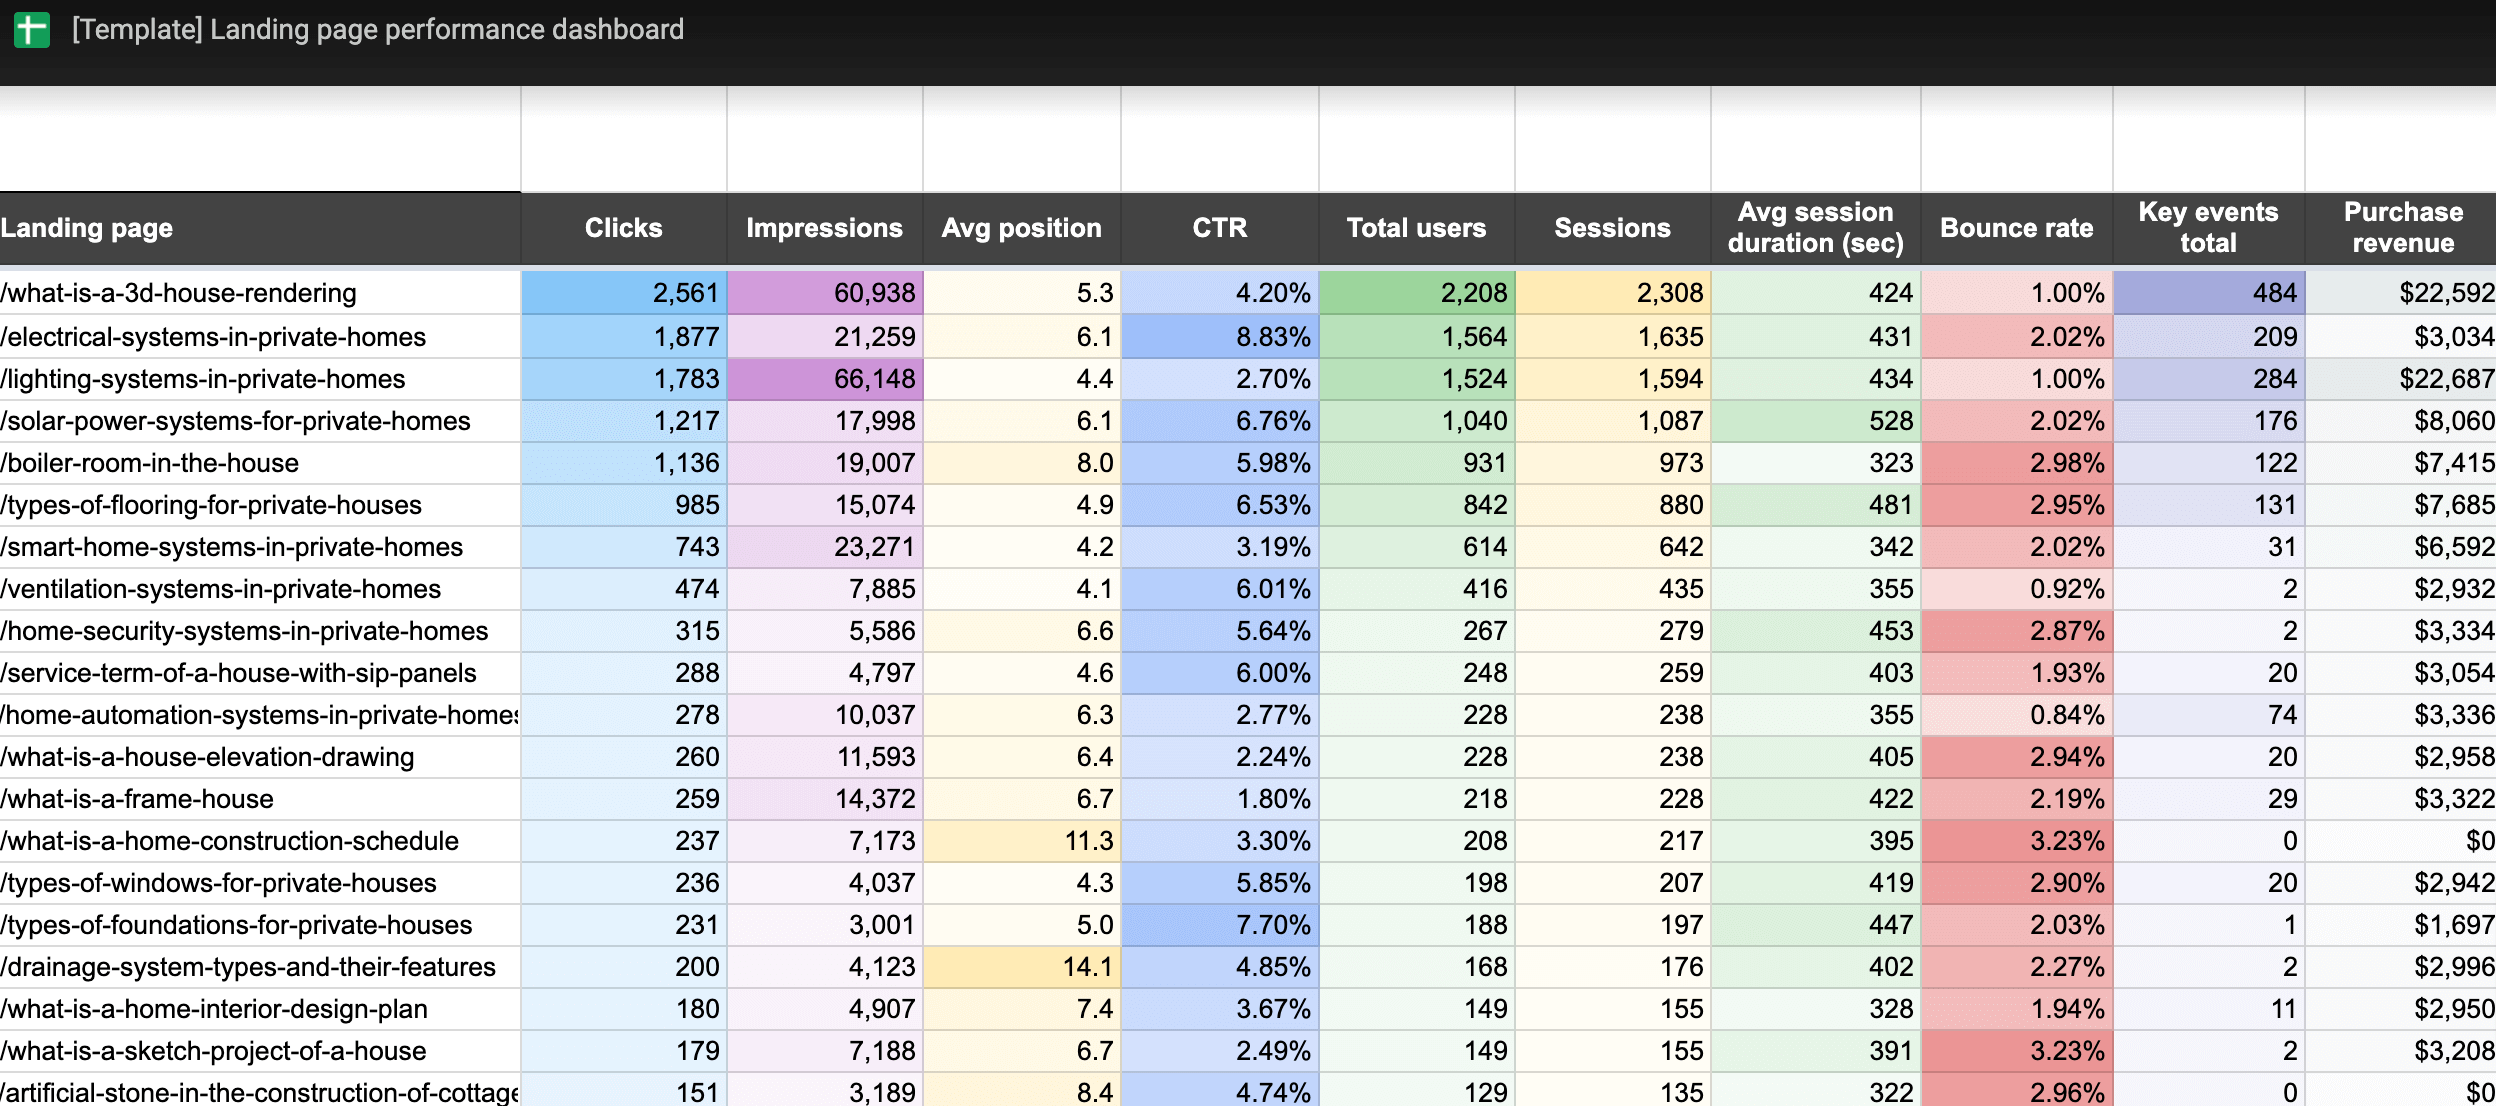
Landing page performance dashboard in Google Sheets
Analyze the effectiveness of your landing pages, from traffic and engagement to conversions.


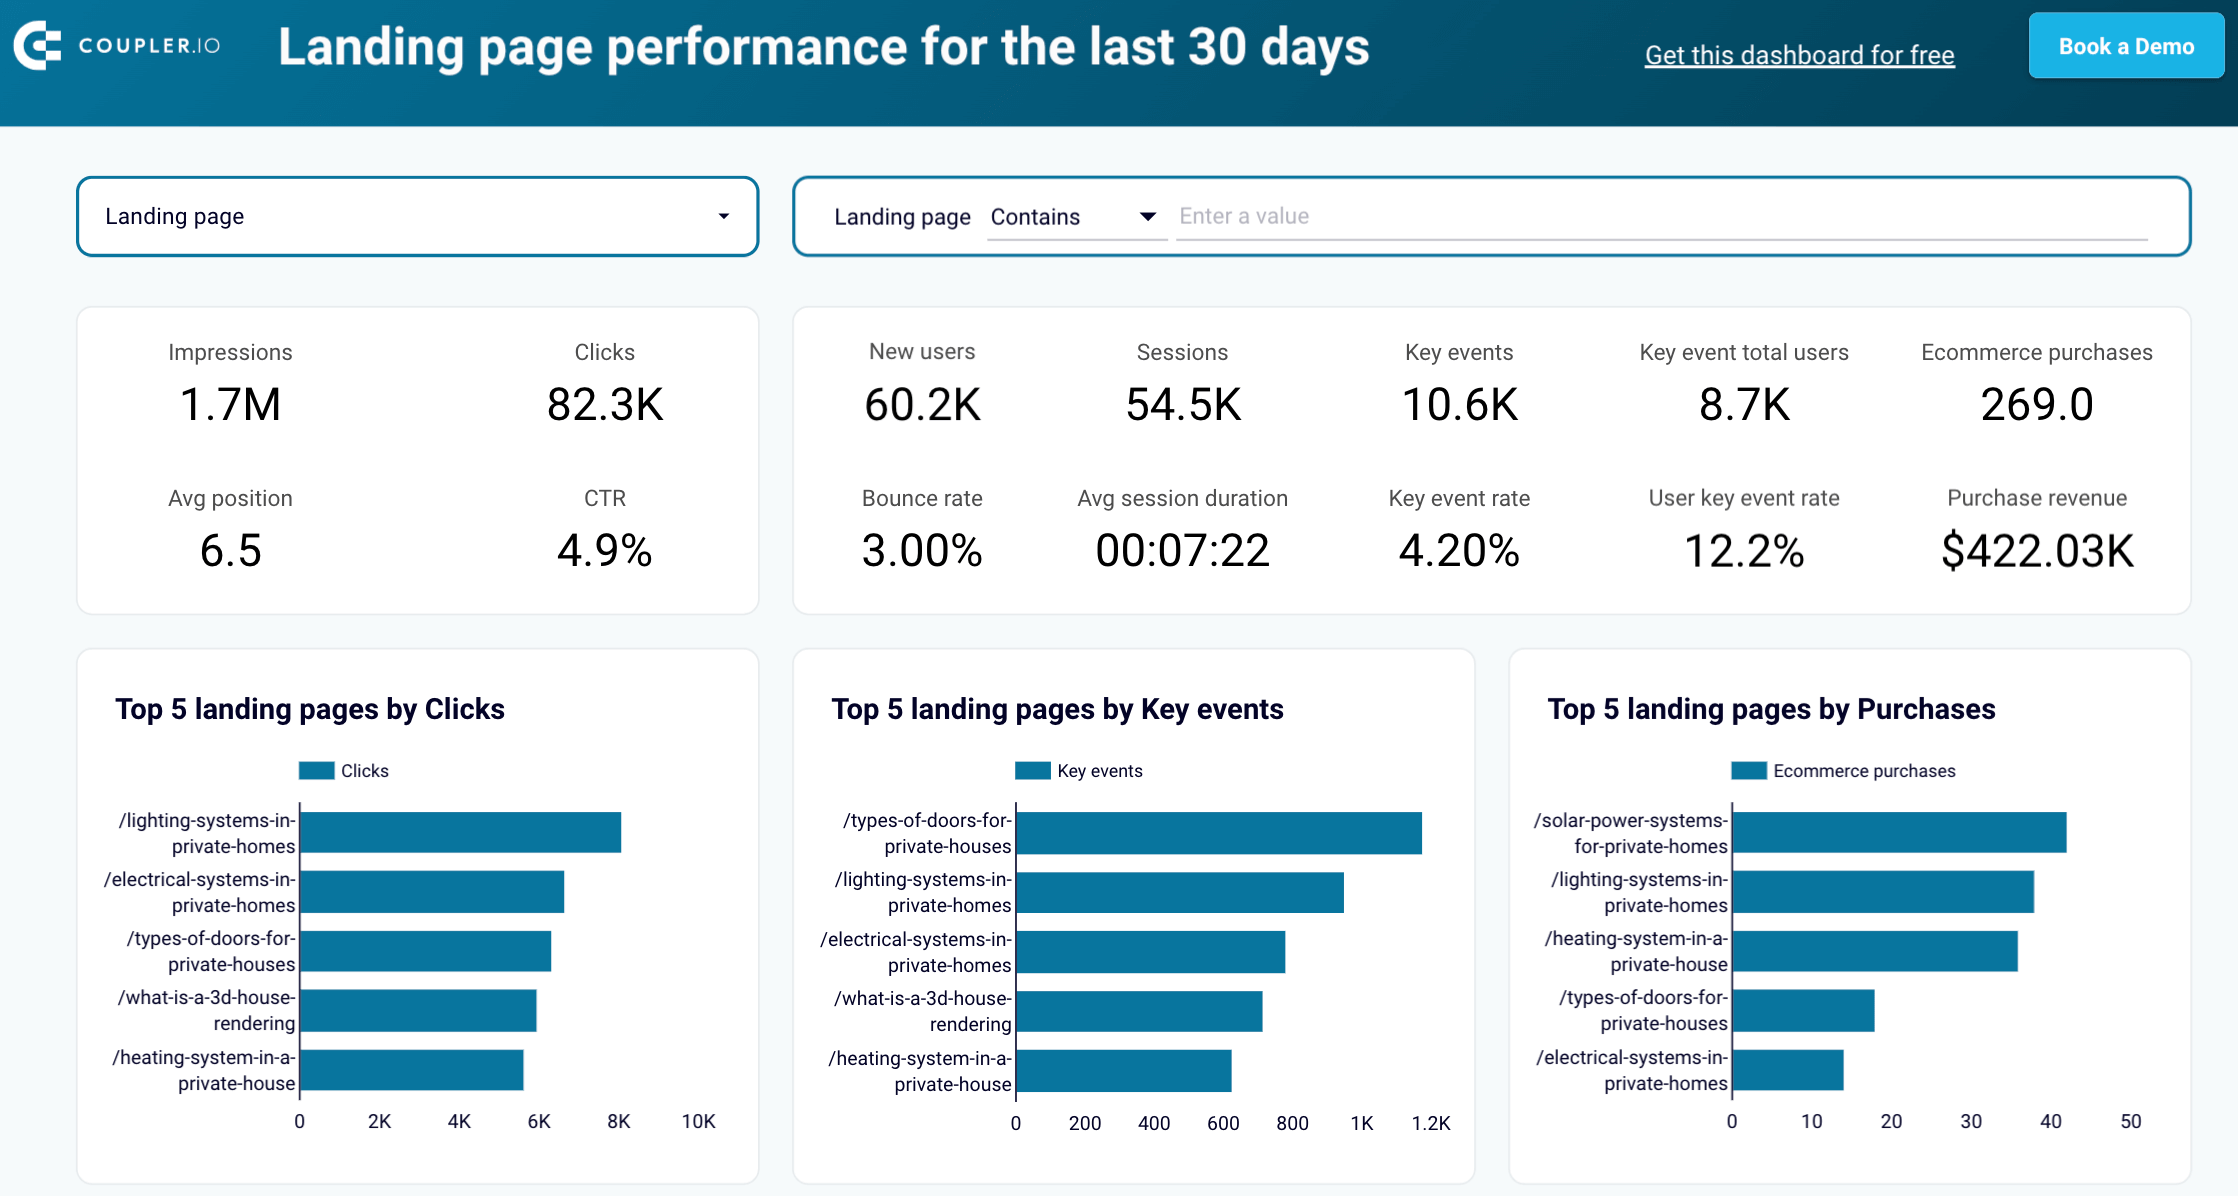
Landing page performance dashboard in Looker Studio
Evaluate the performance of your landing pages, including traffic, clicks, bounce rate, and other metrics.
SEO dashboard
The SEO dashboard displays key performance metrics from Google Search Console that are essential for optimizing your website for search engines.

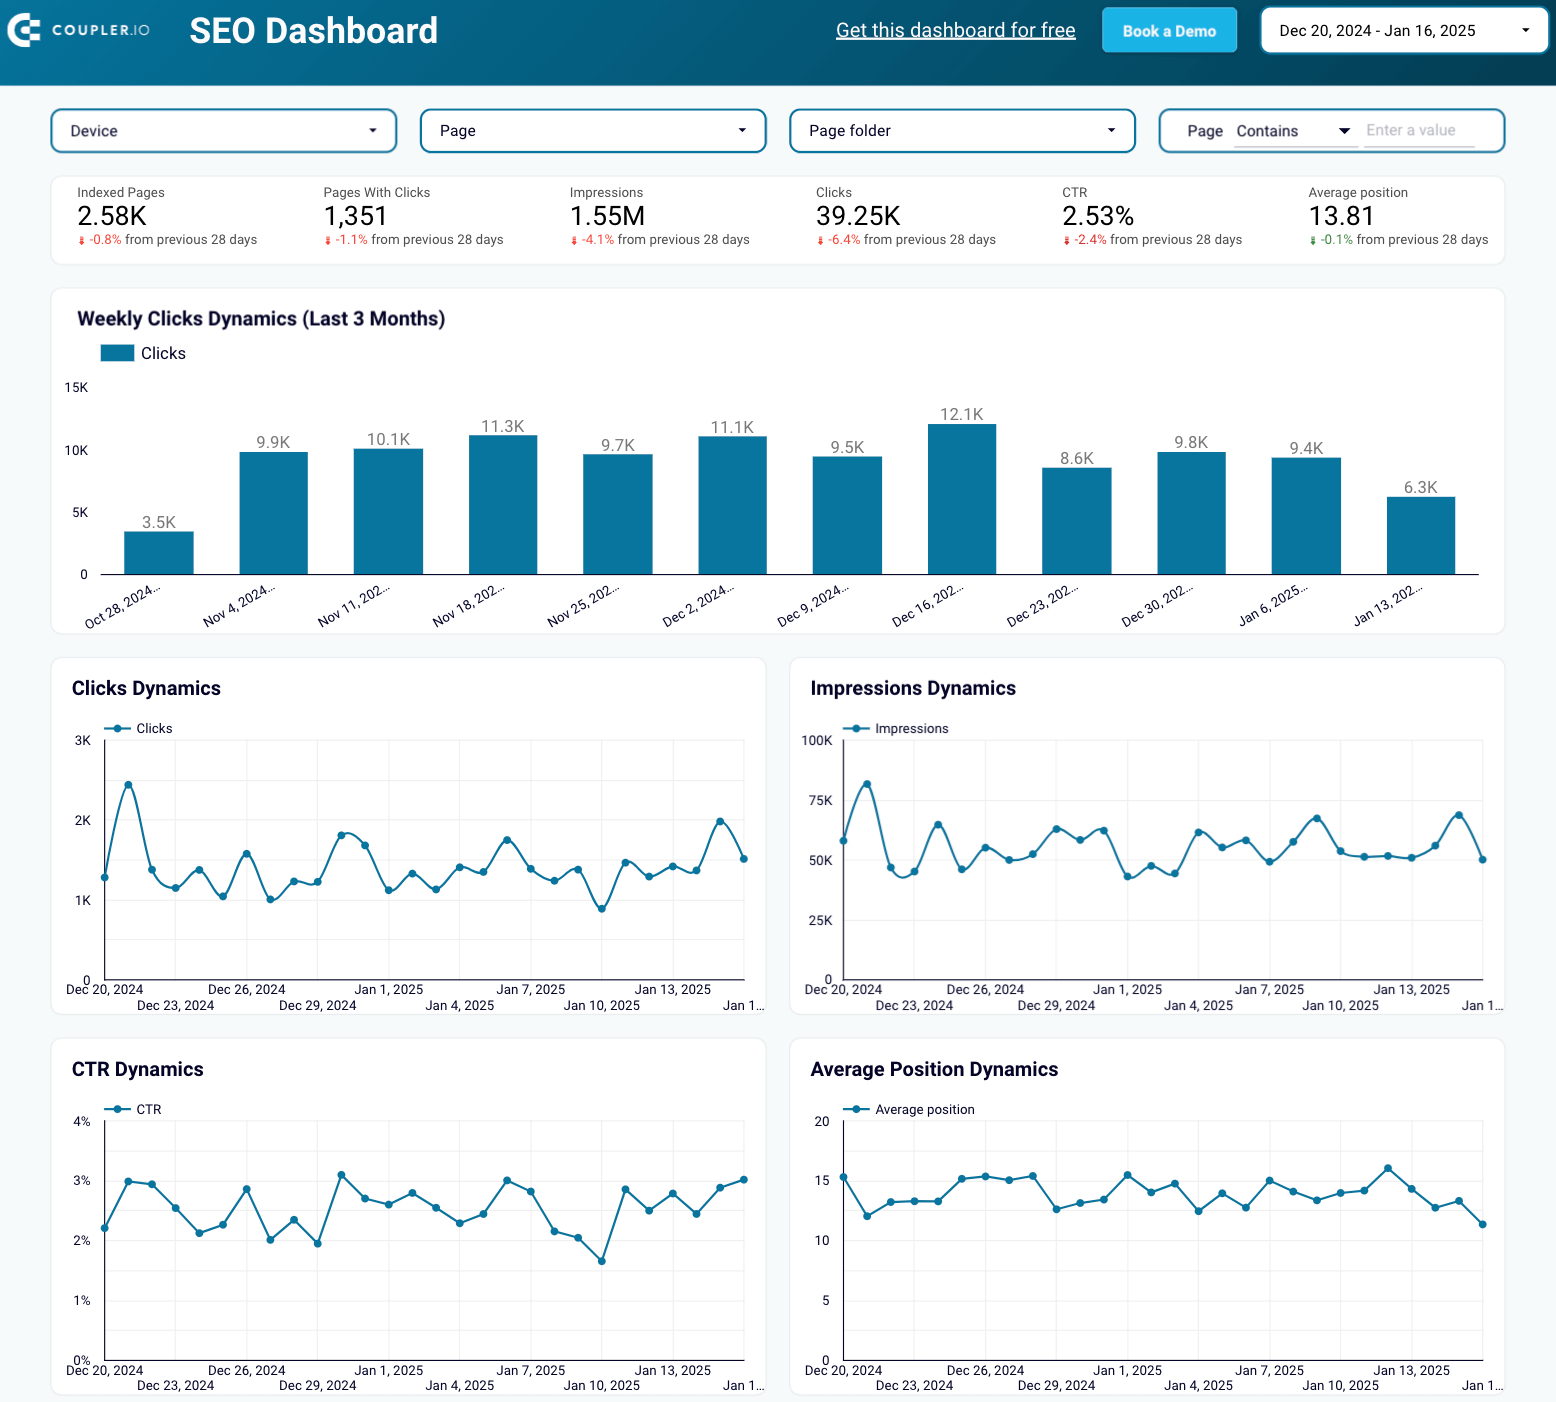
Here’s what you’ll learn using this dashboard:
- Track metric trends: Monitor changes in clicks and impressions for your website, as well as the average CTR and position of all your pages.
- Identify top and underperforming pages: View the website pages that generate the most clicks, as well as those that receive the least, to prioritize your marketing efforts.
- Analyze device metrics: Understand the device share among your audience, including desktop, mobile, and tablet users.
- Evaluate URL-specific performance: Check clicks, impressions, and CTR for each URL across different devices.
This SEO reporting dashboard is available for Google Sheets, Looker Studio, and Power BI. To get started, follow the instructions in the Readme tab to install the Coupler.io connector, link your Google account, and have your data visualized in the dashboard.

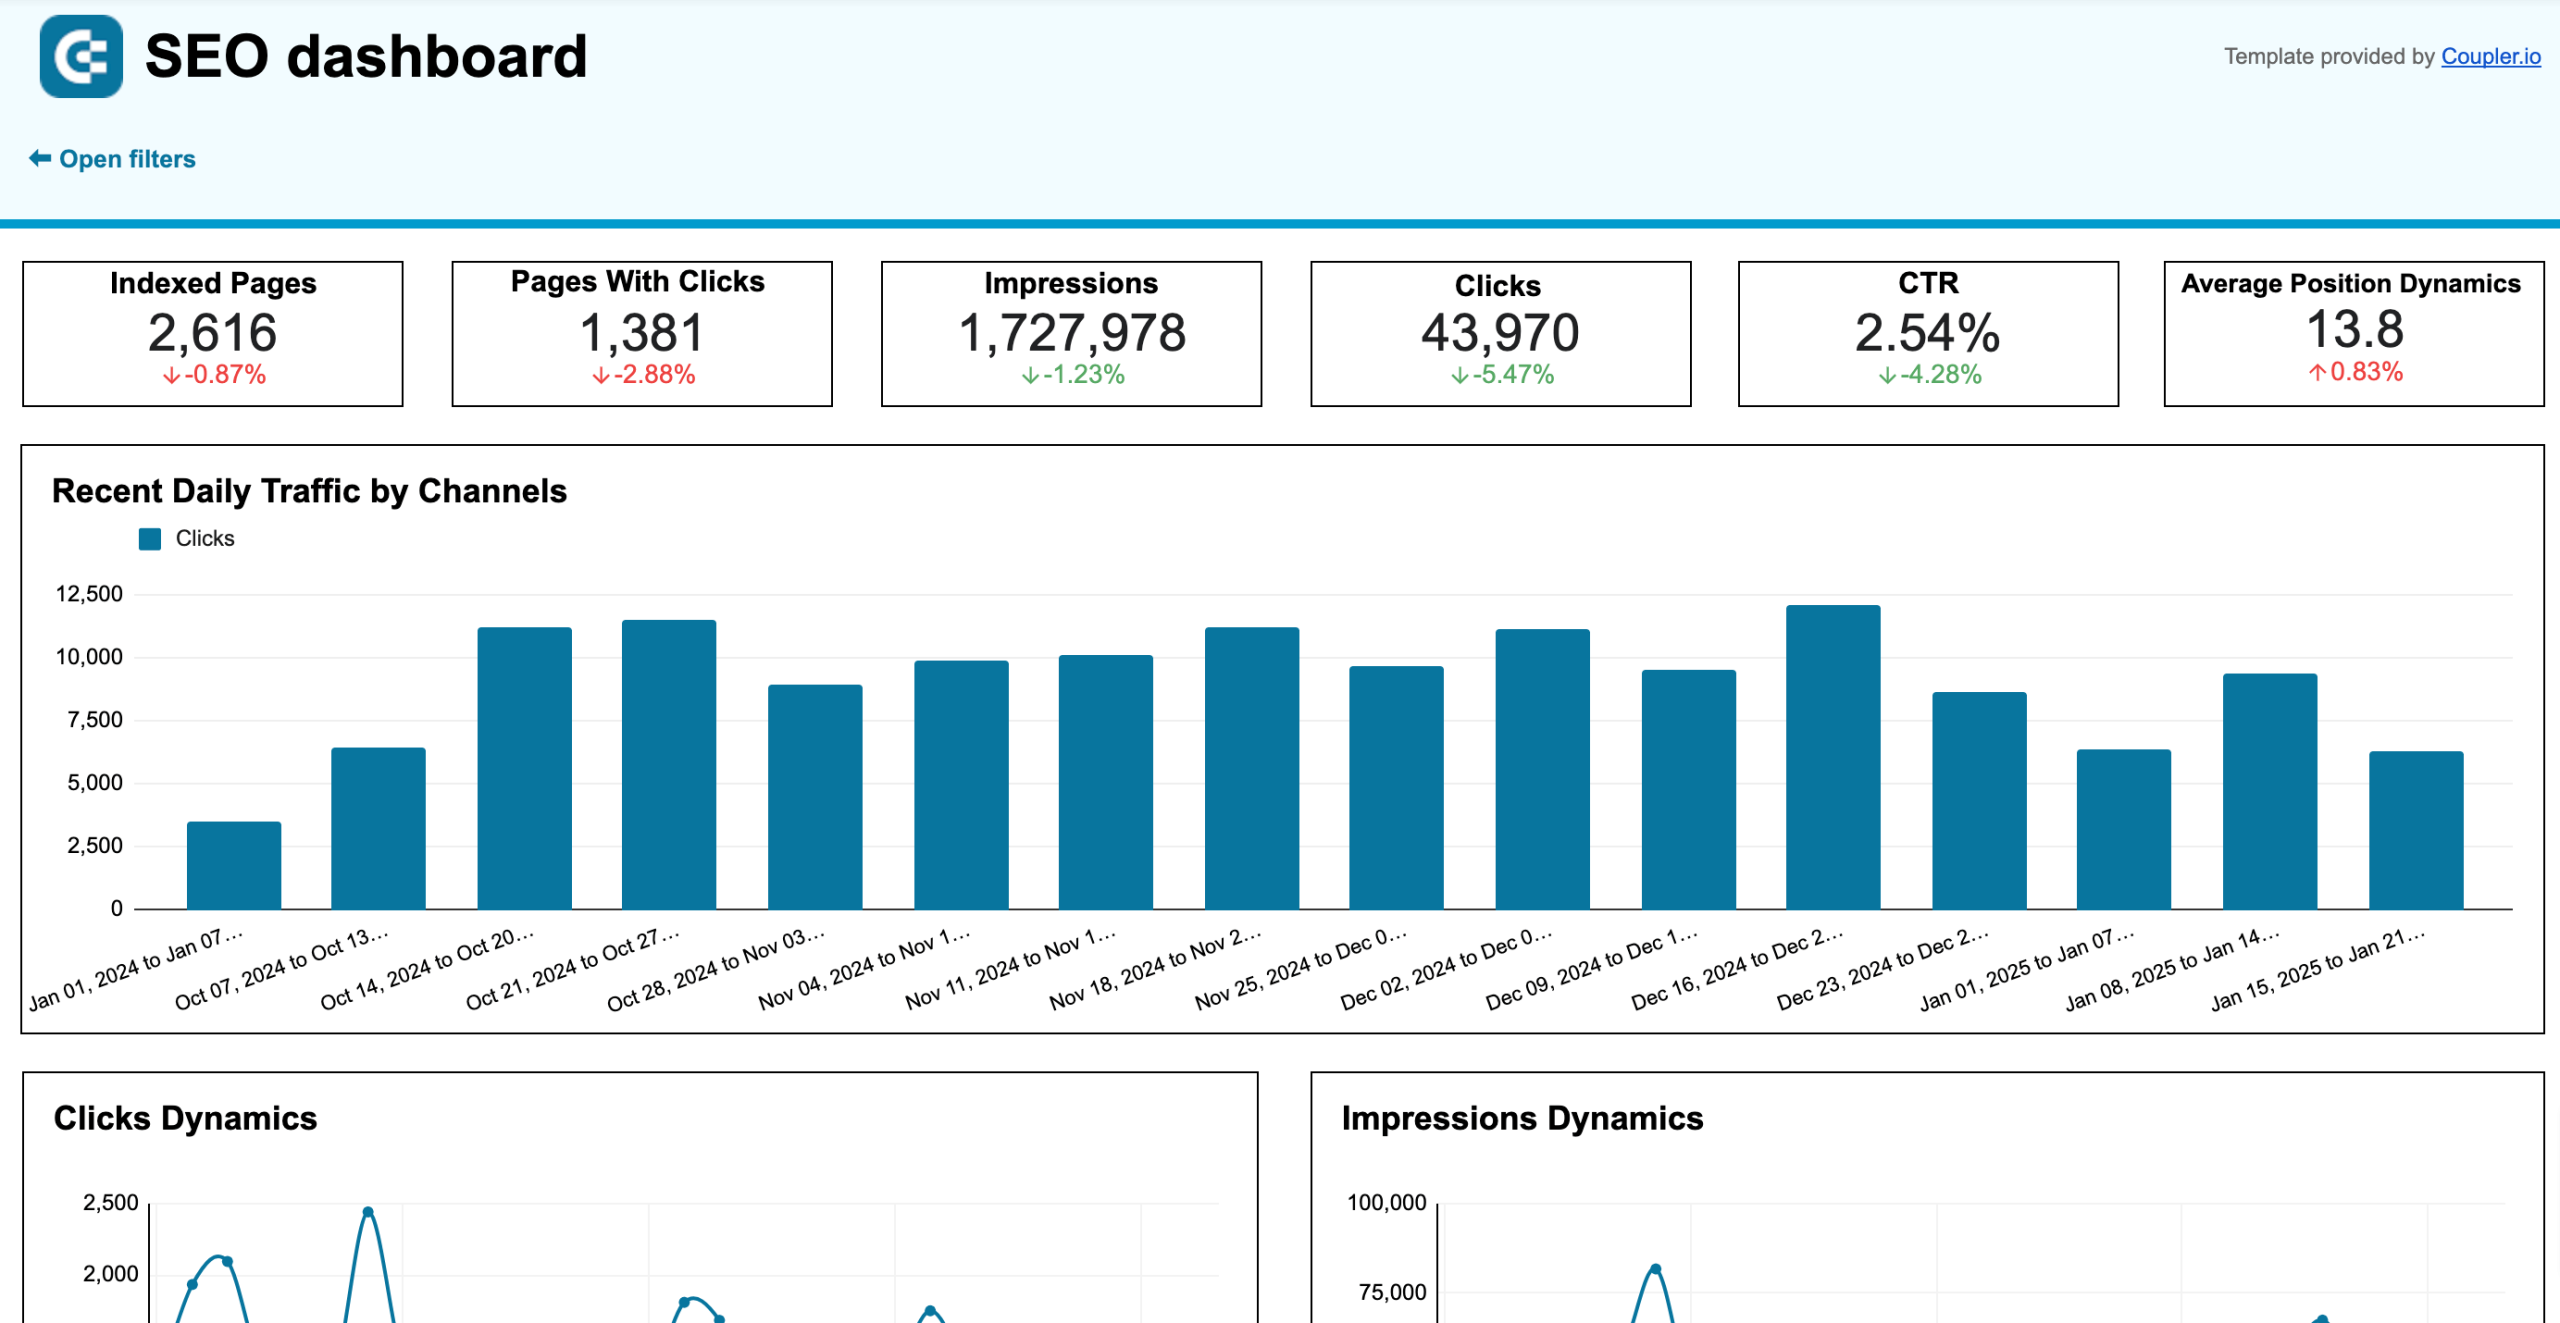
SEO dashboard in Google Sheets
Get an overview and details of the key performance metrics required for your website’s SEO.

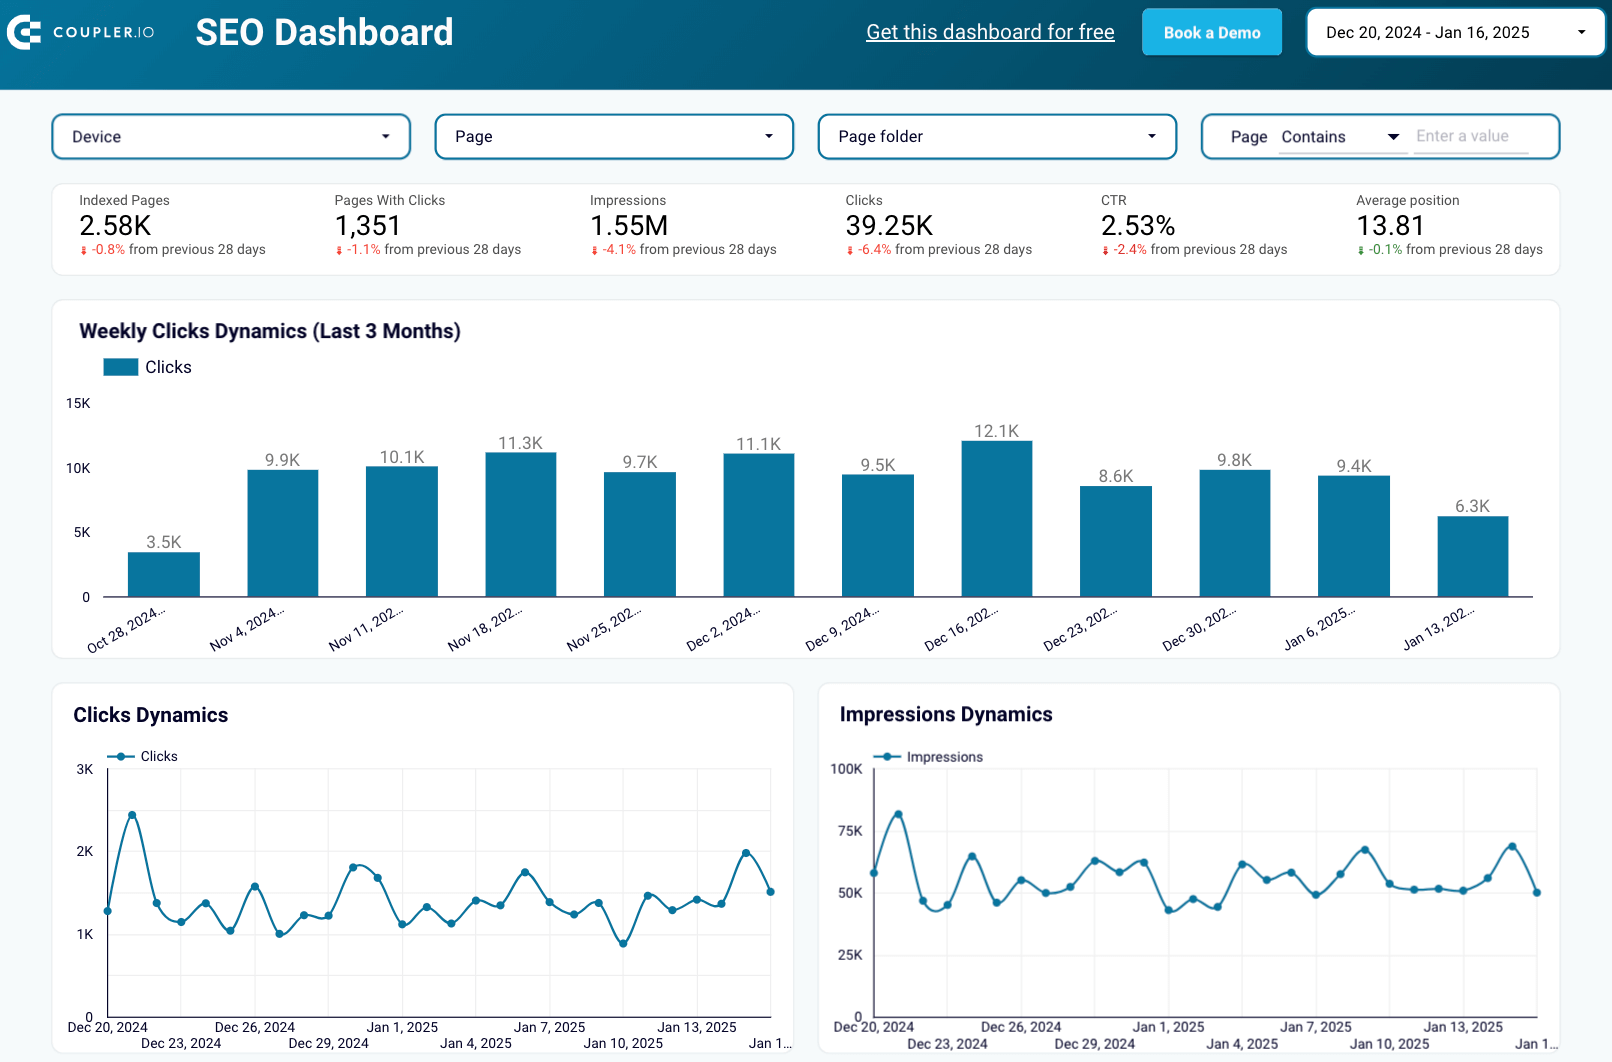
SEO dashboard in Looker Studio
Optimize SEO with a dashboard for Looker Studio. Track page rankings, CTRs, and organic traffic.

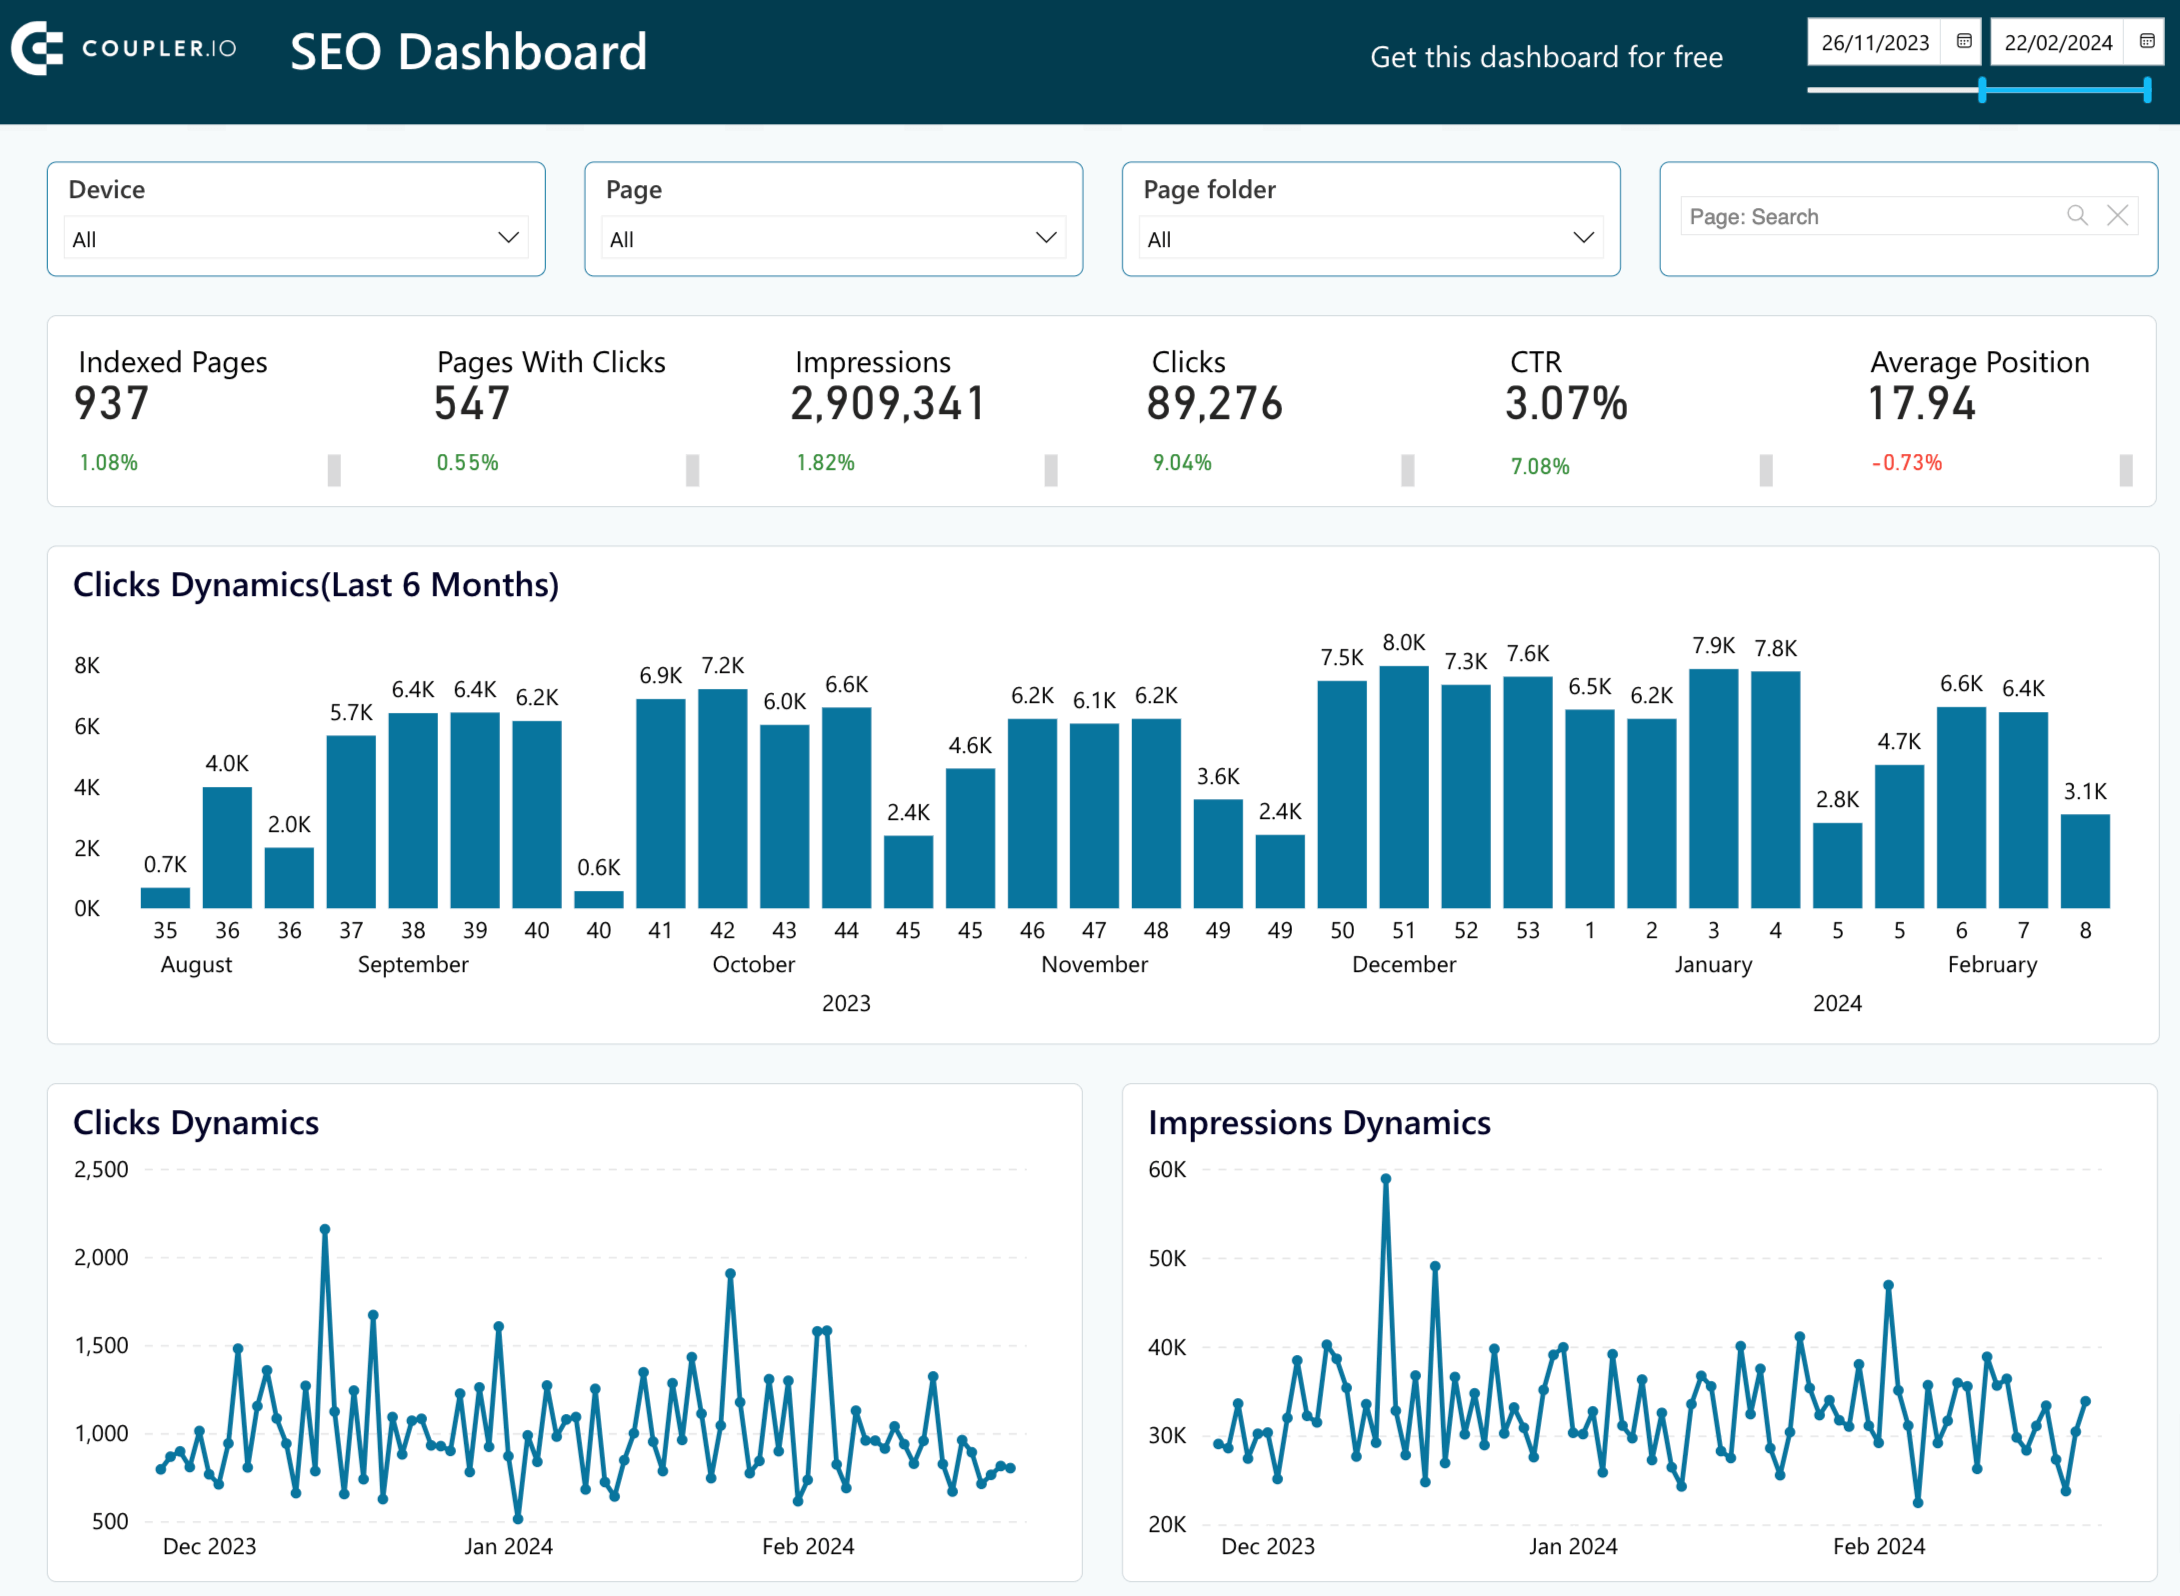
SEO dashboard in Power BI
Get insights into your page’s SEO performance with our dashboard template integrated with Google Search Console.

Whenever you analyze and optimize your SEO performance, the time comes to measure return on investment. This is where Coupler.io steps in, with automated integrations to disparate applications, such as Google Analytics for revenue figures and accounting systems or CRMs for expense numbers. You can create meaningful reports with calculations based on extracted data, pull these reports into your preferred BI tool, and set them to self-update on schedule.
Try Coupler.io for free to keep a clear view of your SEO ROI.
Automate SEO ROI reporting with Coupler.io
Get started for free