In this guide, we explore several approaches to analyzing your Shopify store’s data, including the native option. Additionally, you will receive reporting dashboard templates that will help you rapidly uncover insights and make well-informed decisions.
Different approaches to Shopify analytics
Shopify analytics is the process of analyzing a store’s data to measure performance and make data-driven business optimizations. There are multiple ways to analyze your Shopify store data:
- In-built analytics – Shopify offers native features to build a dashboard and generate various reports for different metrics with a simple trend chart. However, these reports are very basic, and offer very limited customization and flexibility.
- Ready-made templates – You can use pre-designed reports to visualize your data instantly. These templates do not require you to add metrics or charts or perform any calculations manually. They connect with Shopify and automatically get data to give you real-time insights.
- Custom reports from scratch – If you have very specific needs for your data reporting and analytics, there’s another option — creating reports or dashboards on BI platforms or in spreadsheets. Here, you will need to add each visual one-by-one manually, until your report is how you need it to be.
- Google Analytics – Use a Shopify app to connect your store to Google Analytics 4 and monitor user interactions and events, such as clicks, add-to-carts, and purchases. This integration can also offer insights into traffic and user acquisition from various sources. The events are tracked by tags – snippets of JS code placed on your website’s pages. Therefore, it should be regarded as an additional option for analysis.
In the following sections, we show you how to use different methods to analyze your store’s performance.
How to use the built-in analytics features
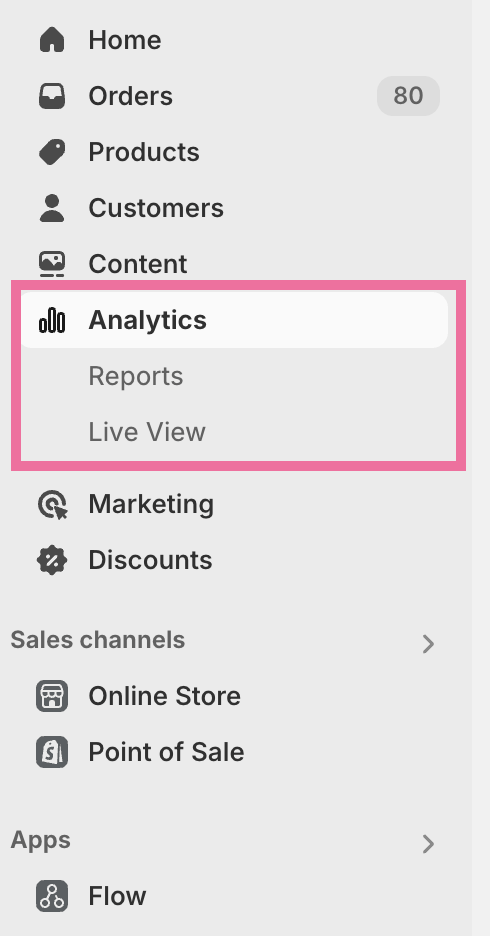
You can access these through the Analytics section in the Shopify admin menu. The section contains an analytical dashboard, pre-set reports, and a live view.
Overview dashboard
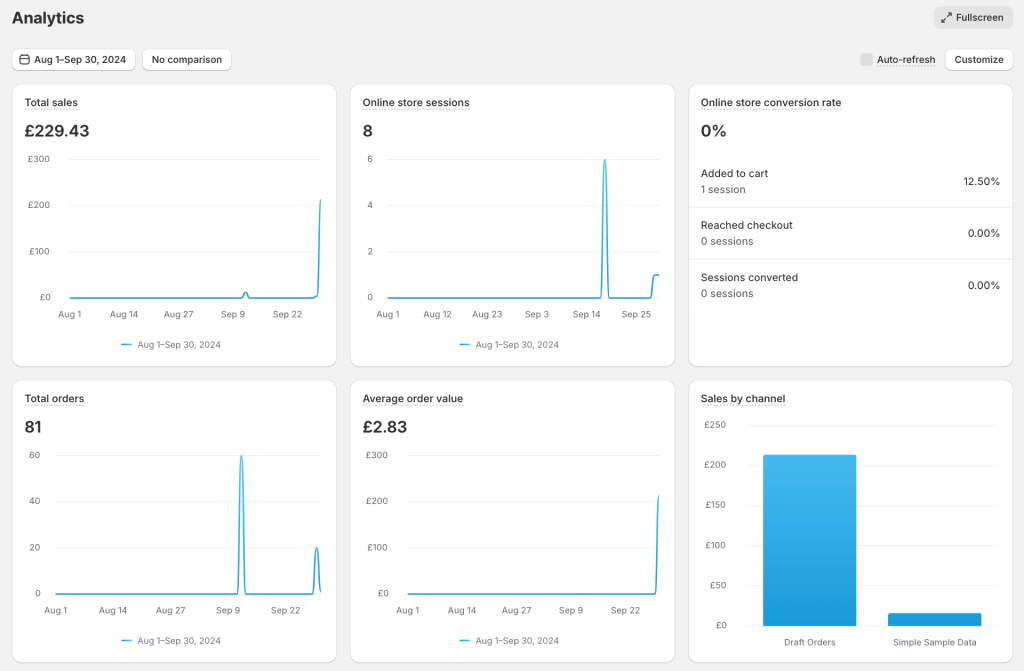
You will find the dashboard on the first tab of the Analytics section in Shopify. The dashboard offers an overview of the store’s performance.
It contains various data cards displaying particular e-commerce business KPIs (e.g., total sales and top-selling products). Clicking any of the cards opens a specific report in a detailed view.
You can select the time range for the data and perform time-based comparisons.
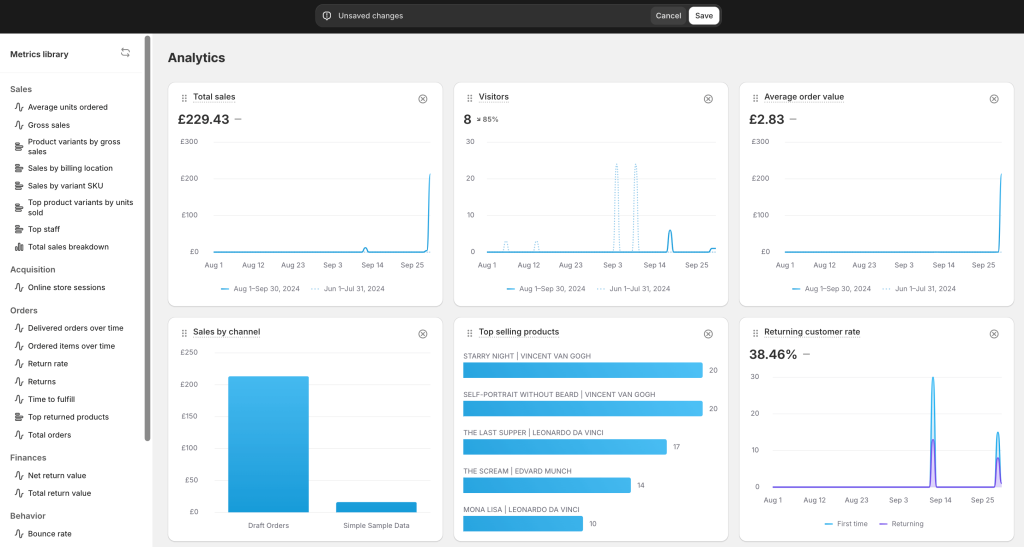
The Customize option allows you to change the default Shopify analytics dashboard view.
You can add new cards and rearrange or remove existing ones here. The metrics library contains pre-defined cards related to sales, acquisition, orders, etc.
Reports
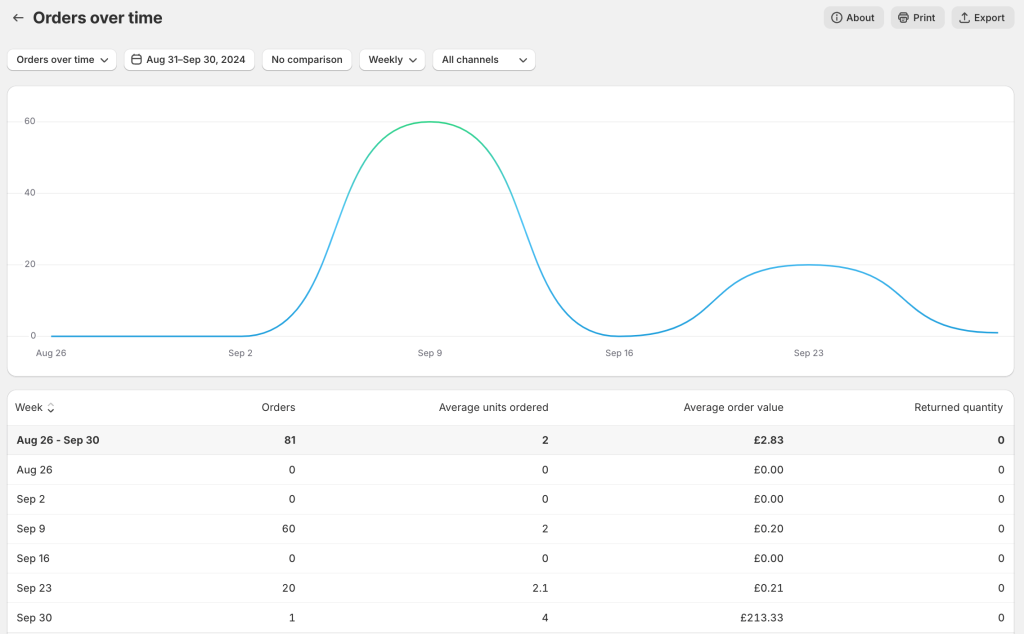
On the Reports page, you will find a list of pre-defined reports.
Each report highlights a specific performance metric or dimension related to your store. For example, sessions over time and orders over time.
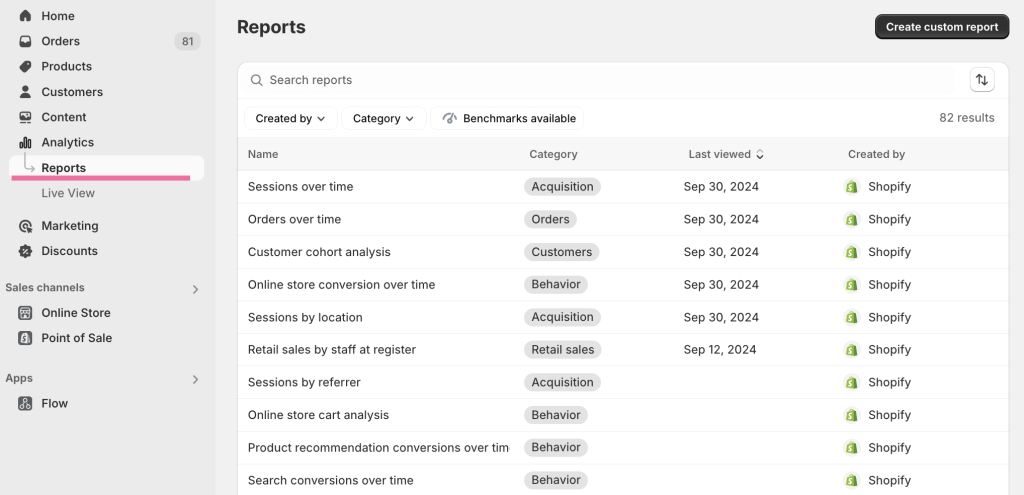
You will find over 80 different reports on Shopify focusing on business aspects such as user acquisition, orders, customers, behavior, and POS sales performance.
Each report provides a basic visualization highlighting a specific metric and a table. There is an option to filter this report and change the date range to explore the data you need.
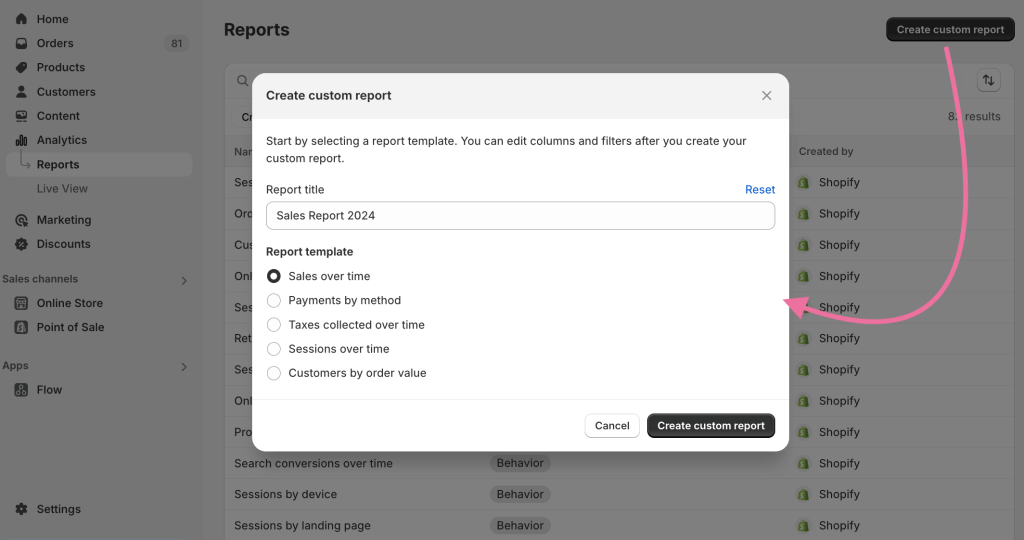
Click the button on the top right to create custom reports based on the templates. However, the types of custom reports are limited.
A custom report can be filtered to show specific data and columns.
In this example, we have filtered the sales data to only display orders with the Paid payment status, along with columns for order name, shipping city, total sales, and net quantity.
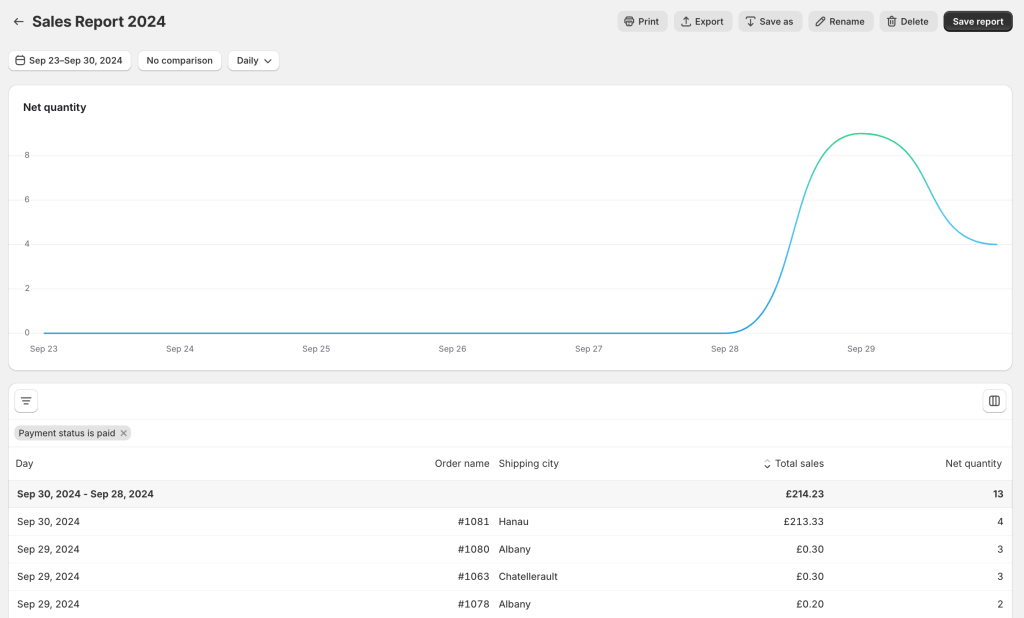
You can play around with these options and your version of the report.
Although the template-based reports offer some flexibility, they’re not truly customizable. For example, you can’t choose a specific pair of metrics or dimensions to analyze.
Live View
This page offers a real-time view of customers’ activities in the store. It shows the number of visitors, their location, orders, and top-selling products.
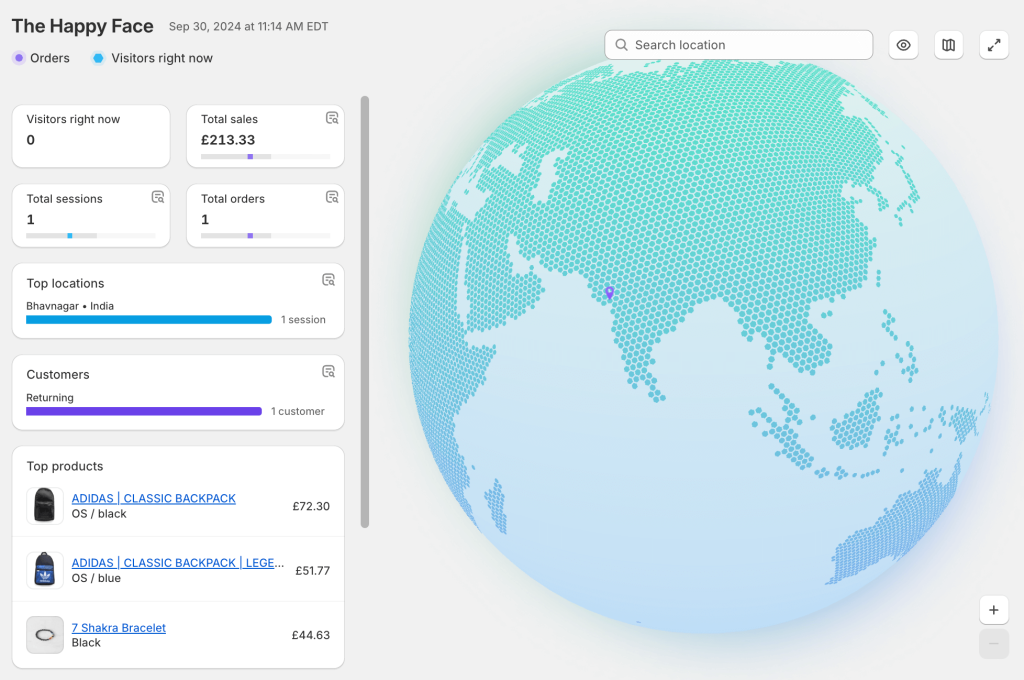
The live view analytics in Shopify is useful for analyzing data in real time during busy periods.
Limitations of Shopify analytics reports
Even though easily accessible, the default reports are not a go-to option for many store owners and e-commerce marketing teams. Here are the main reasons for this:
- The visuals in the reports are very basic and can’t be modified
- There is no option to share the reports outside the admin interface
- If you have several stores, it’s not possible to analyze all the data in one place
Moreover, Shopify’s analytics features are limited to the data available on the platform. This means you can’t prepare cross-channel reports by combining your store data with data from other sources.
Ready-made templates for Shopify data analytics dashboards
Luckily, you don’t have to limit yourself to the native analytics options. You can easily visualize and analyze your data outside Shopify. With ready-made templates, you get a helpful interactive Shopify analytics dashboard within minutes.
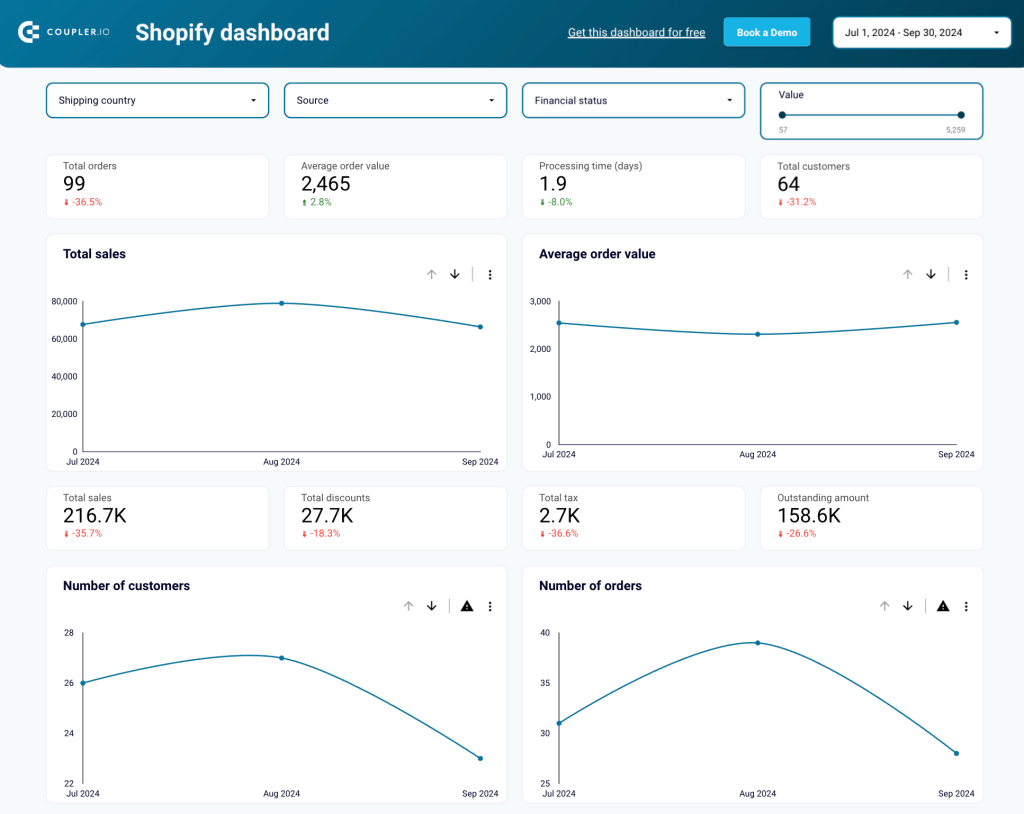
Shopify orders dashboard
If you want a single dashboard to track your store’s sales, this template will come in handy. It offers a sales overview with options to filter metrics by date range, traffic source, payment status, and order value.
The dashboard contains:
- Number of orders
- Number of customers
- Sales revenue
- Average order value
It also displays charts to help you identify trends and patterns in sales.
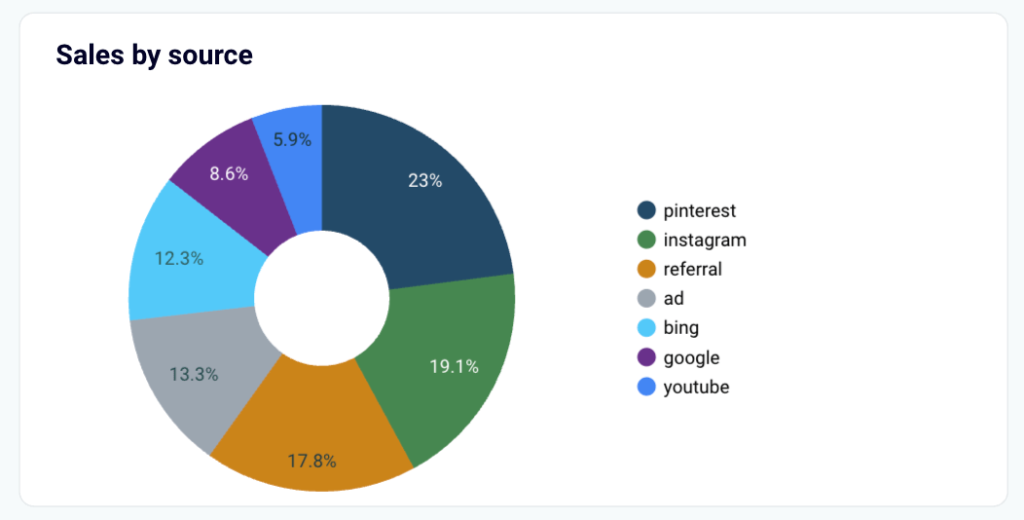
- Get sales overview by source
The report contains a pie chart showing sales from different sources (traffic referrers). This chart is helpful when you’re using multiple marketing channels, such as paid ads, social media, and SEO. You can use it to quickly measure your marketing efforts across channels and determine the best-performing ones.
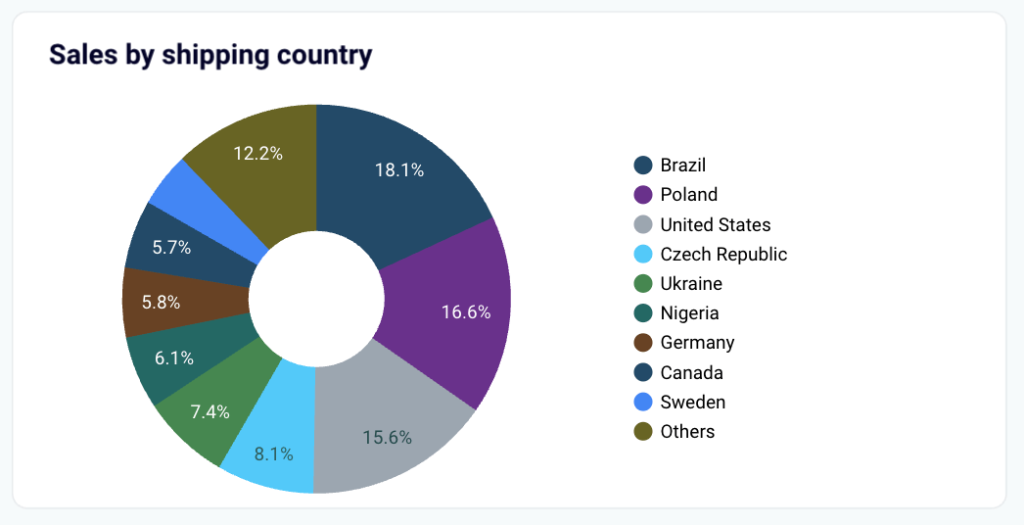
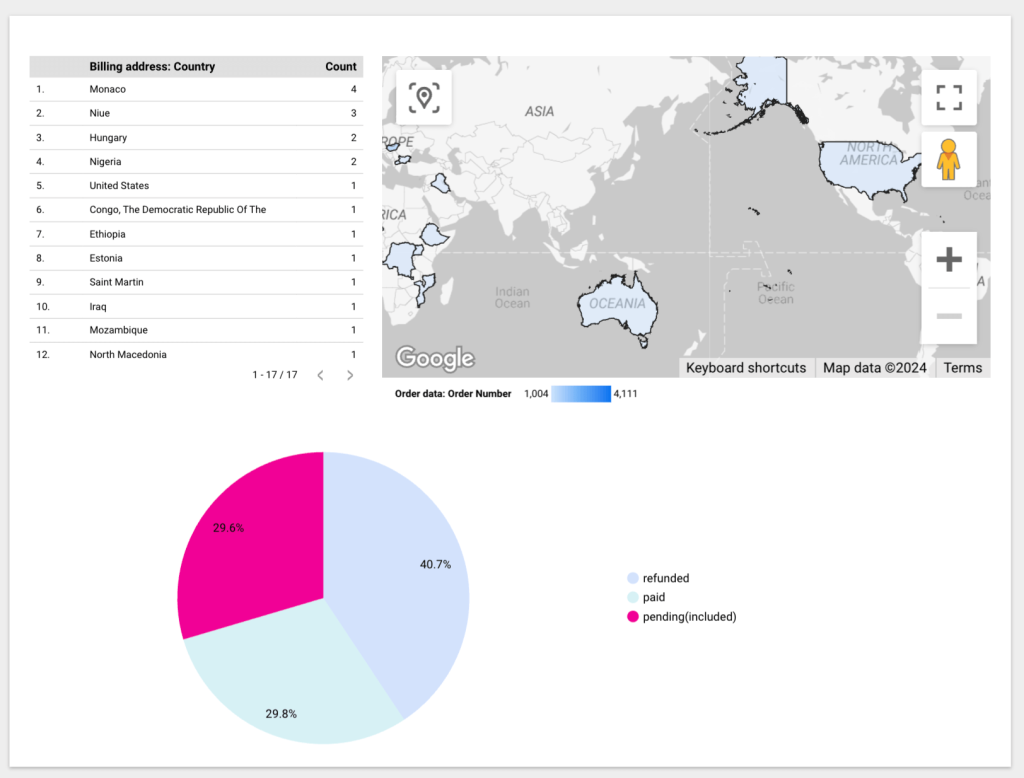
- Analyze your business’s global reach
If you’re a global brand, you can see the top countries you’re getting orders from.
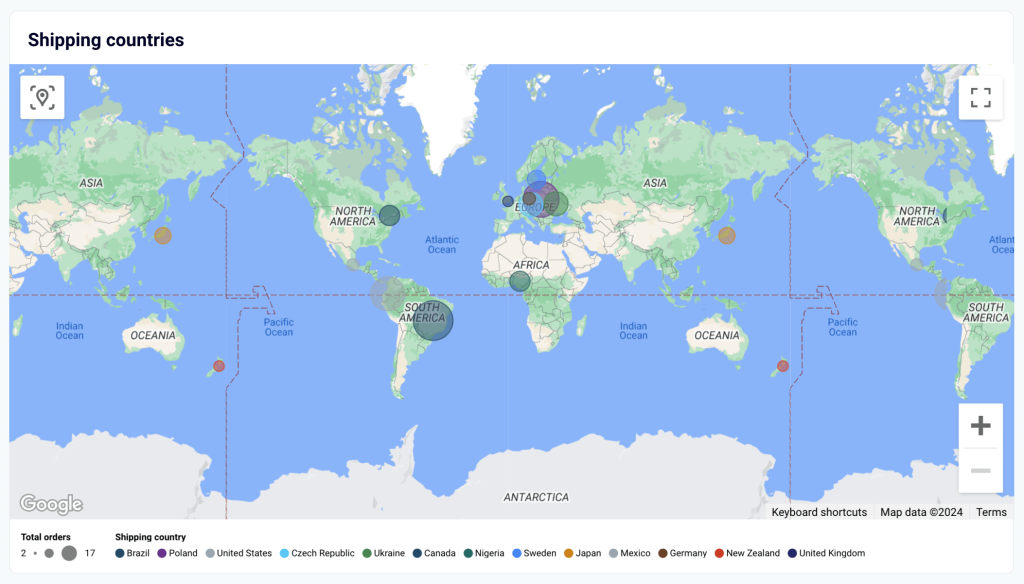
Additionally, there is a map displaying the countries from which you’re receiving orders. This feature helps you identify the regions that are contributing to your sales and discover new promising markets. This information is valuable to reconsider your marketing efforts for each region. For example, running region-specific ad campaigns.
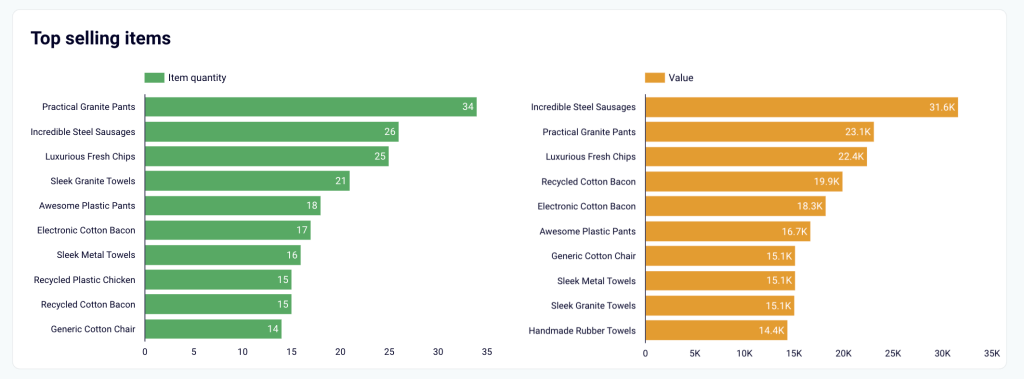
- Identify top-selling products
You can also identify your top-selling products and the ones that bring the most revenue to your business. This makes it easy to find high-in-demand products in the store and optimize your inventory.
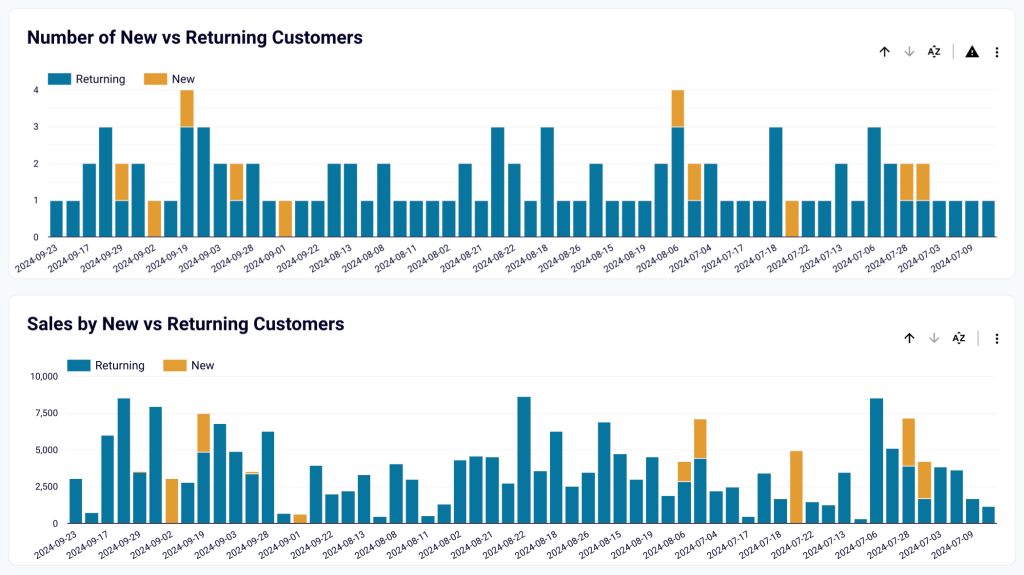
- Perform cohort analysis
The dashboard features a cohort analysis section that allows you to analyze customer behavior over time.
For example, find out how many users return to the store after one, two, or three months.
It helps you analyze:
- Number of Customers
- Sales
- Orders
for new and returning customers for each month.
How to use this template?
Follow the instructions provided in the template’s Read me tab. You’ll need a Coupler.io account, which is free to create and does not require credit card details. Once connected, it will visualize your Shopify store’s data in Looker Studio with near real-time updates.
Shopify marketing funnel analytics dashboard
If you’re running paid ads, this dashboard can help you see each step in the customer acquisition funnel and find bottlenecks. It pulls data from your ad accounts, Google Analytics 4, and Shopify Analytics into a unified single-page dashboard.
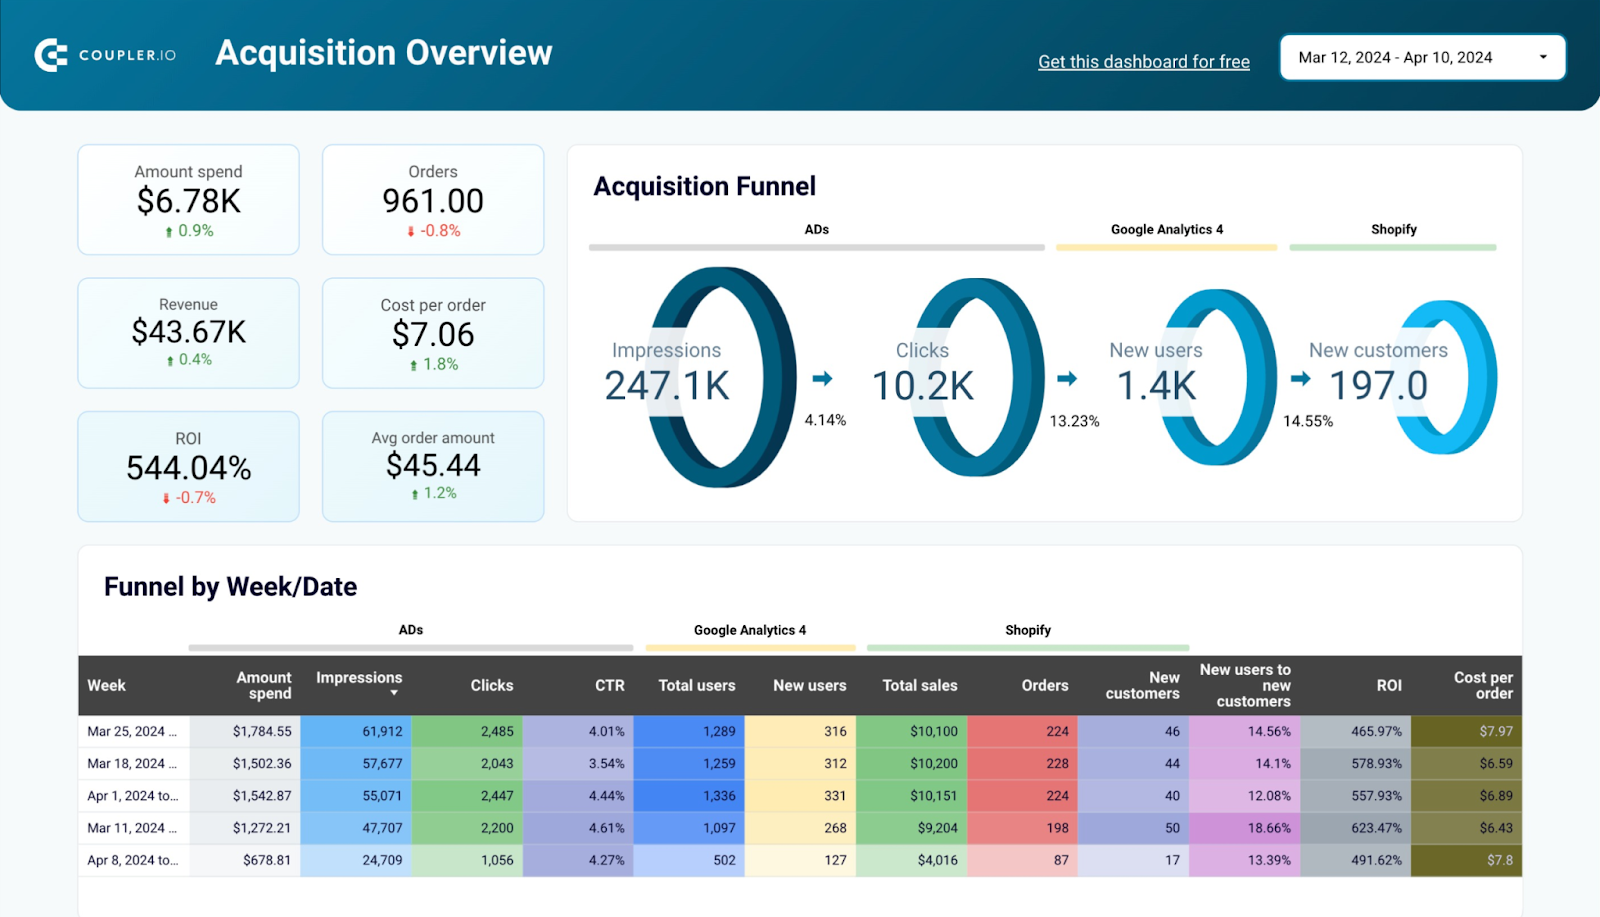
In the customer acquisition funnel, there is an overview of metrics such as impressions, clicks, new website users, and customers. It also tracks the conversion rate at each stage of the funnel, e.g., the percentage of new users that convert into paying customers.
The key performance indicators include:
- Total ads spend
- Orders
- Sales revenue
- Cost per order
- ROI
- Average order amount
Using these metrics, you can analyze the overall performance of your ad campaigns.
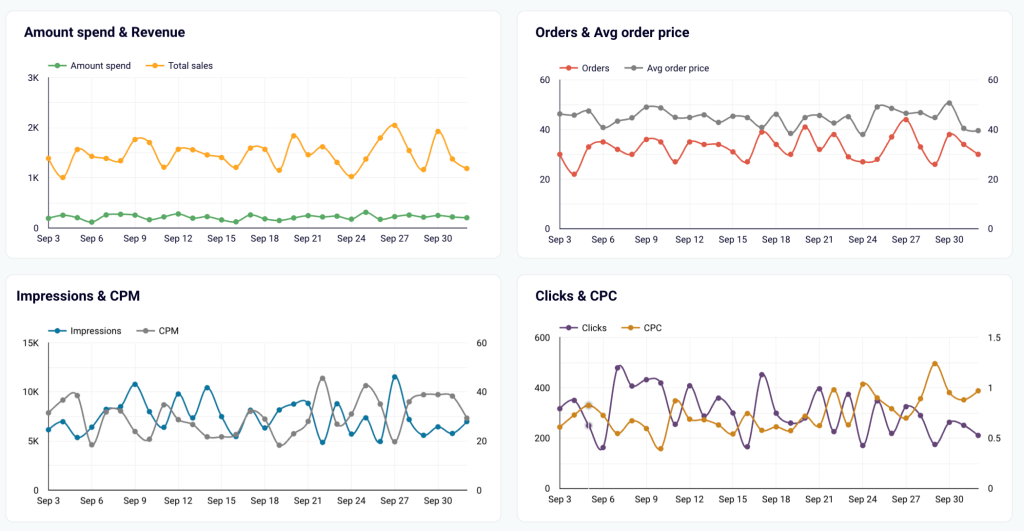
- Analyze & compare performance trends
These charts help you observe trends for various metrics important to your paid ads strategy.
For example, the amount spend vs. revenue chart is useful for analyzing ROI trends of your marketing campaigns.
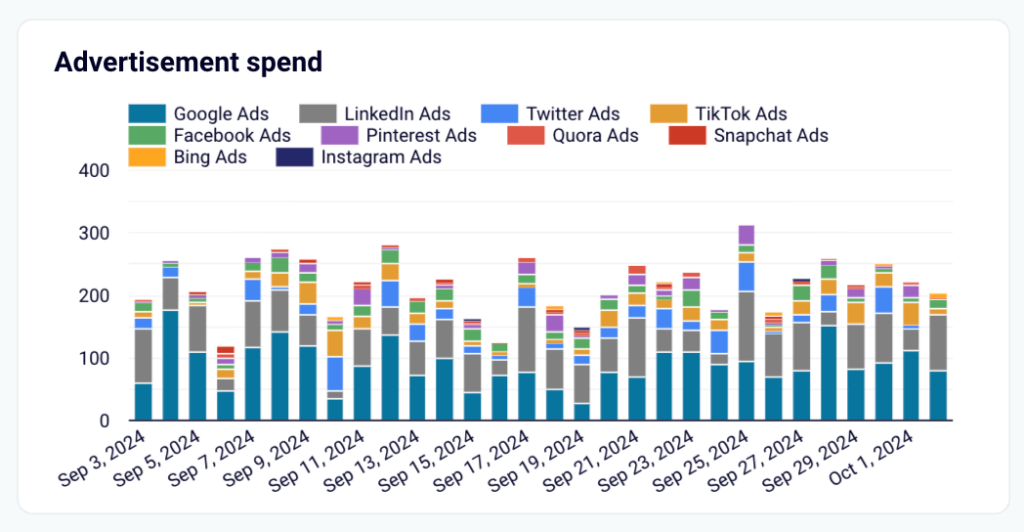
- Track ad spend across platforms
The dashboard makes it easy to analyze the ad spend on Google Ads, LinkedIn Ads, Facebook Ads, and more. The report shows data for the PPC platform you use. It helps you drill down the chart and find ROI metrics for individual paid ads channels.
For example, select Facebook Ads to get a trend chart for that particular channel and make decisions to reshape your marketing strategies for specific platforms.
How to use this template?
This dashboard template is available in Looker Studio and Power BI. Both versions are automated with the help of Coupler.io, which collects data from multiple sources. You’ll need to sign up for a Coupler.io account and follow the instructions in the Read me tab of the template to connect your data sources.
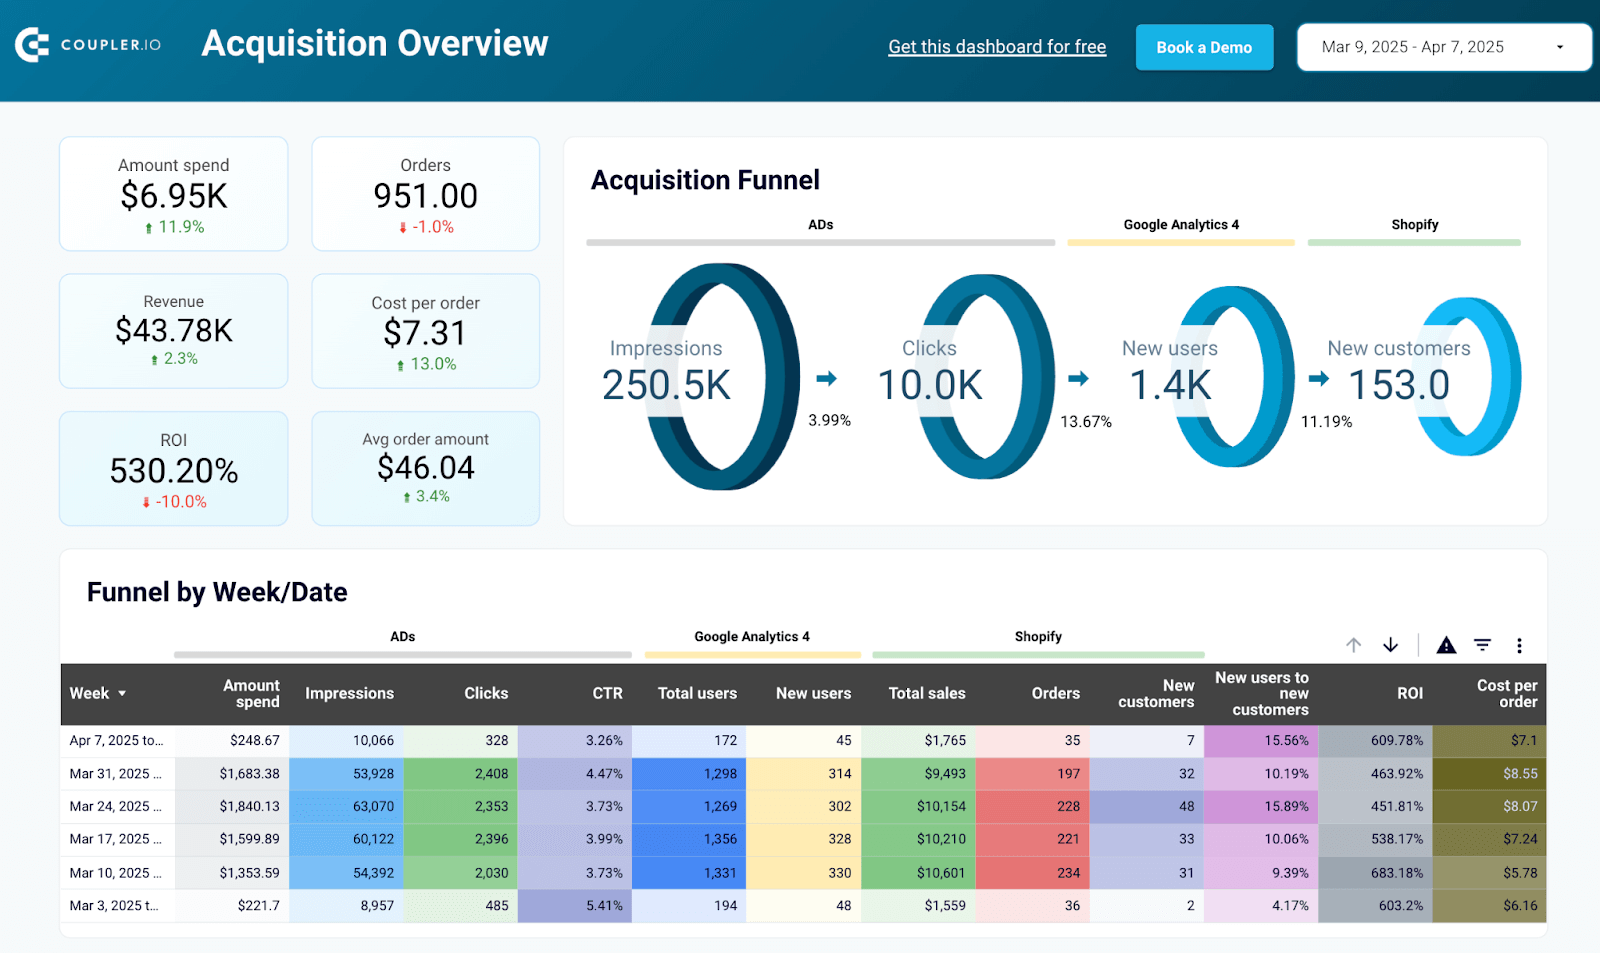
Shopify marketing funnel dashboard in Looker Studio
Analyze the performance of the traffic to your Shopify store using data from advertising platforms and Google Analytics 4, all consolidated on a single dashboard.


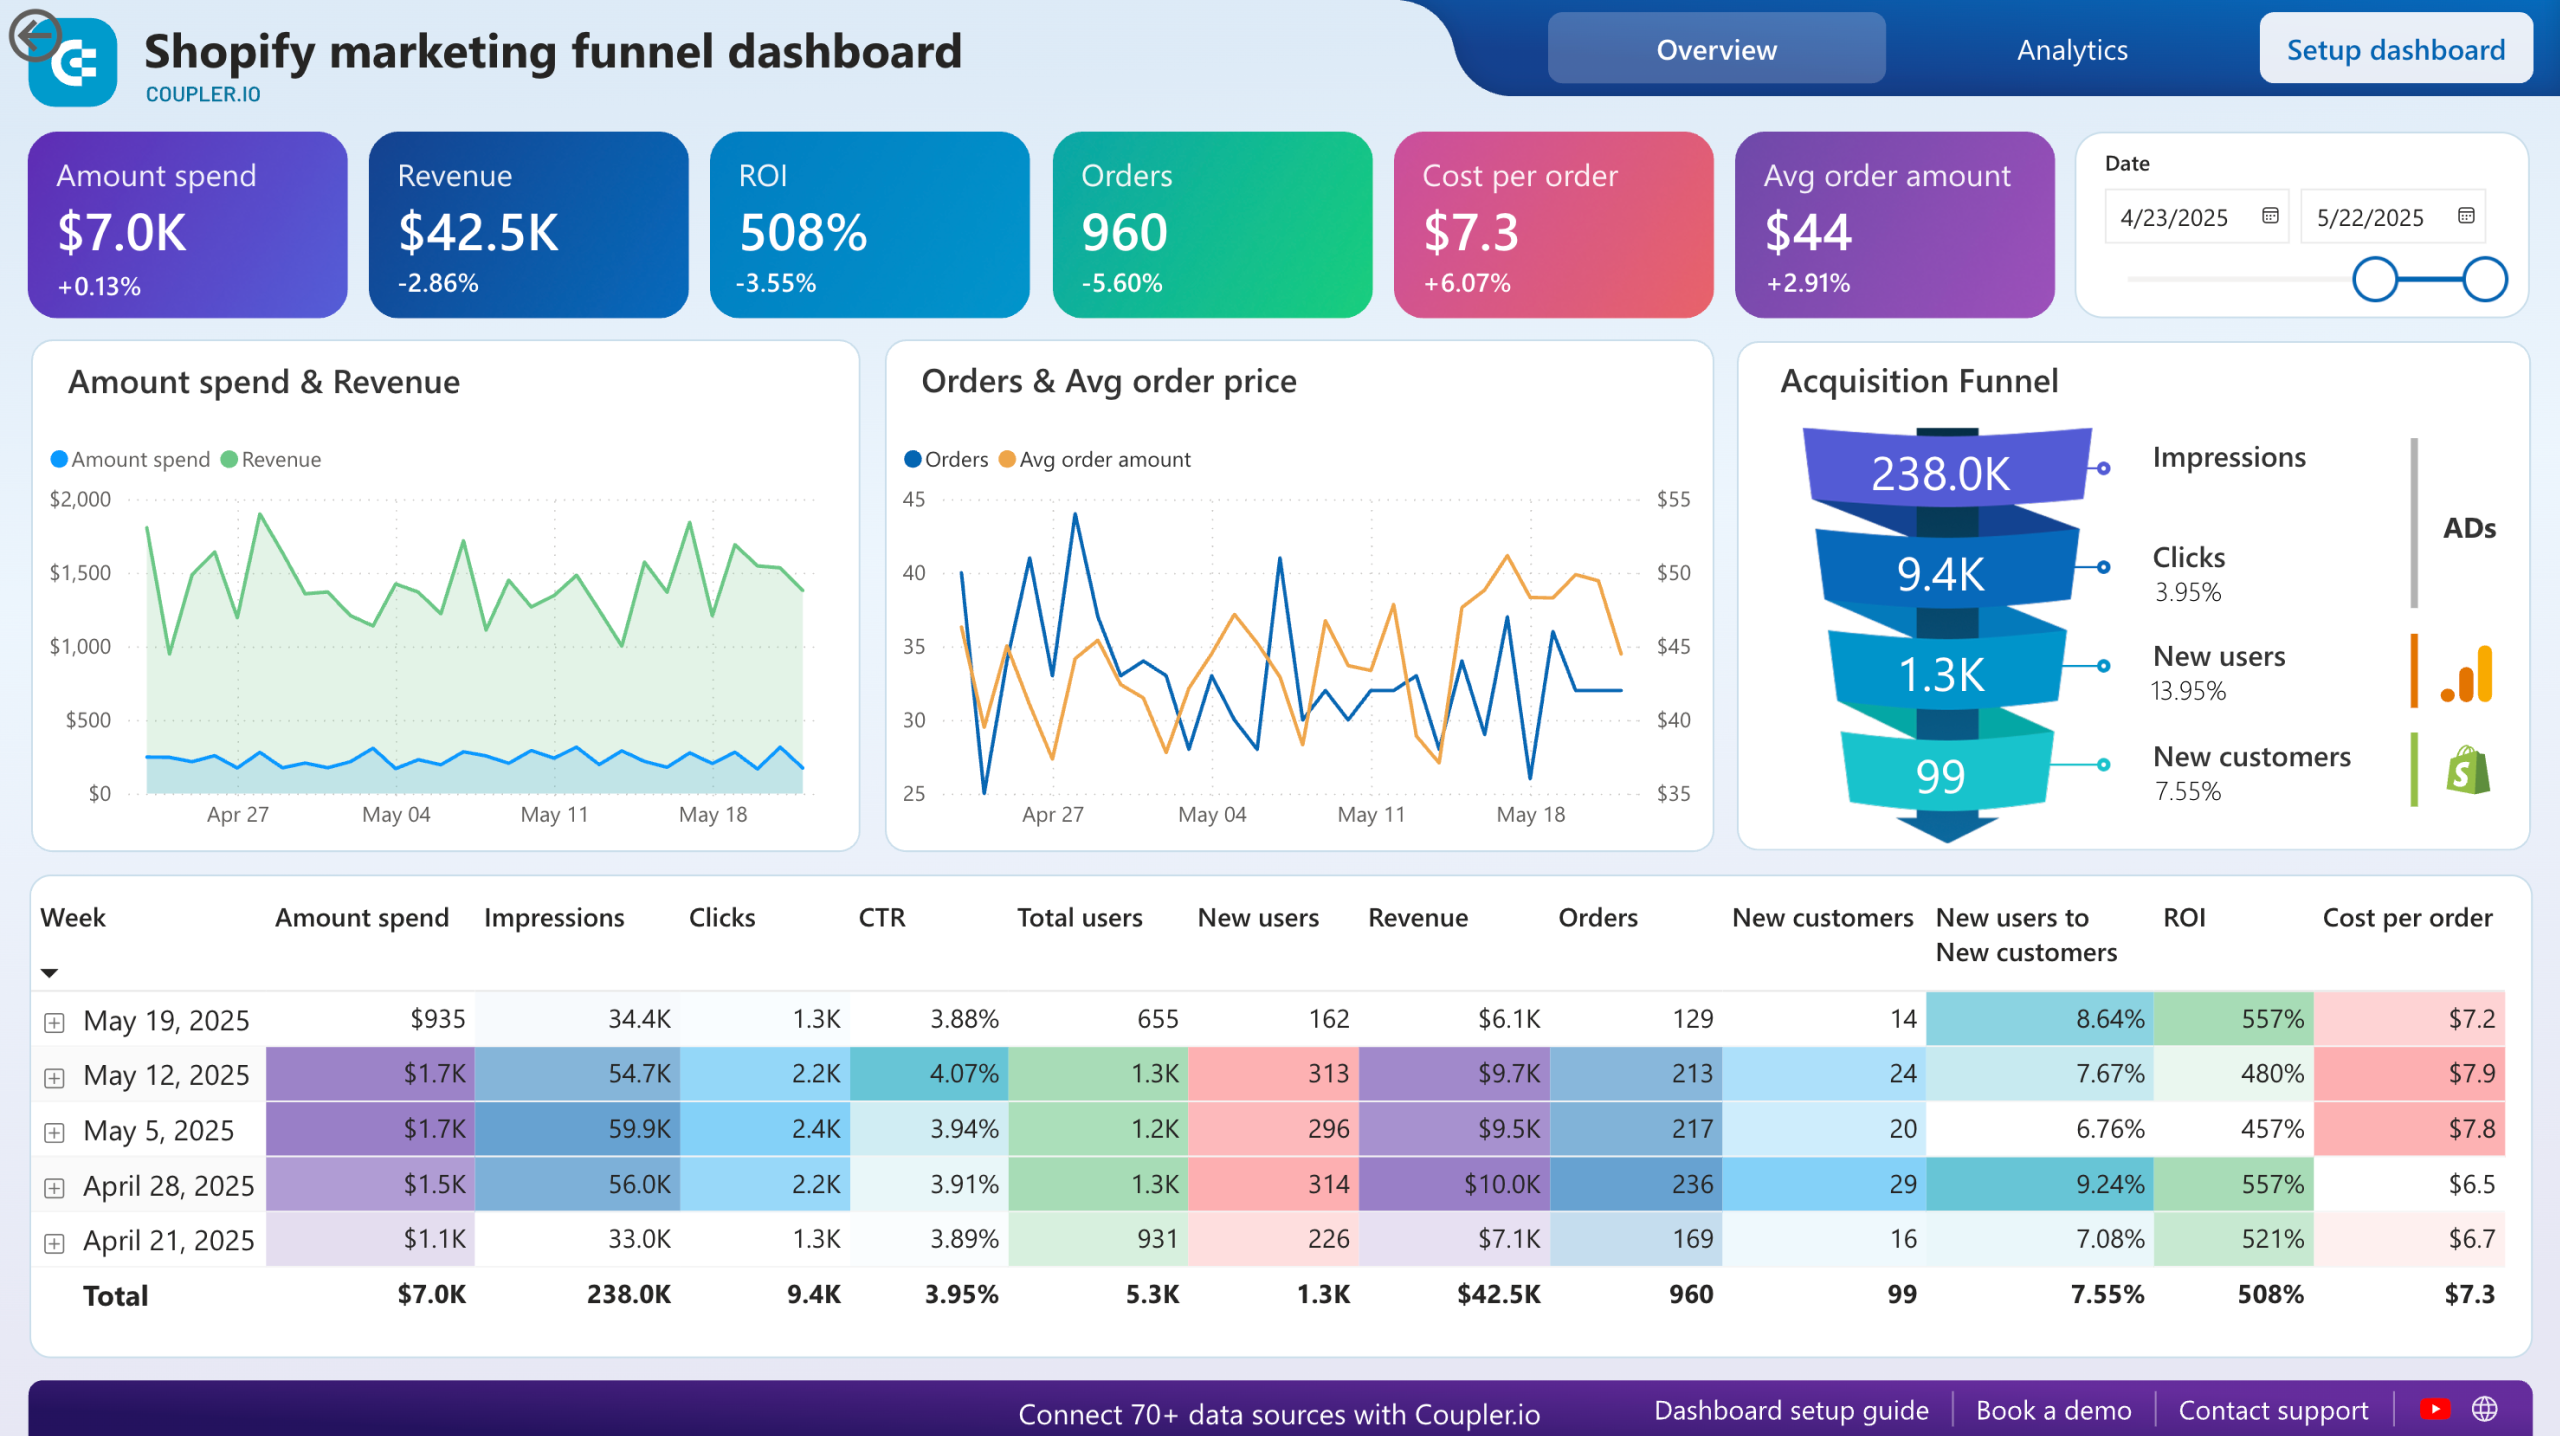
Shopify marketing funnel dashboard in Power BI
Examine the customer journey from advertising exposure to purchase completion with integrated data from your Shopify store, advertising platforms, and analytics tools.

Build custom Shopify reports from scratch
If you have a clear vision of what your report should look like, you can use BI tools like Looker Studio and Power BI or even spreadsheet apps to build a Shopify dashboard from the ground up. To do this, you’ll first need to connect your Shopify store to the destination app and then create your report by adding visuals individually.
To automatically collect data for your report and make it live, you can use Coupler.io. Apart from Shopify integrations, the tool also supports over 60 other popular apps, connecting them to destinations like Looker Studio, Power BI, Tableau, Google Sheets, Excel, and more. The report also refreshes data automatically so that your reports always stay up to date.
To get started, select a reporting platform using the form below.
Next, sign up for Coupler.io (it’s free and no card details are required).
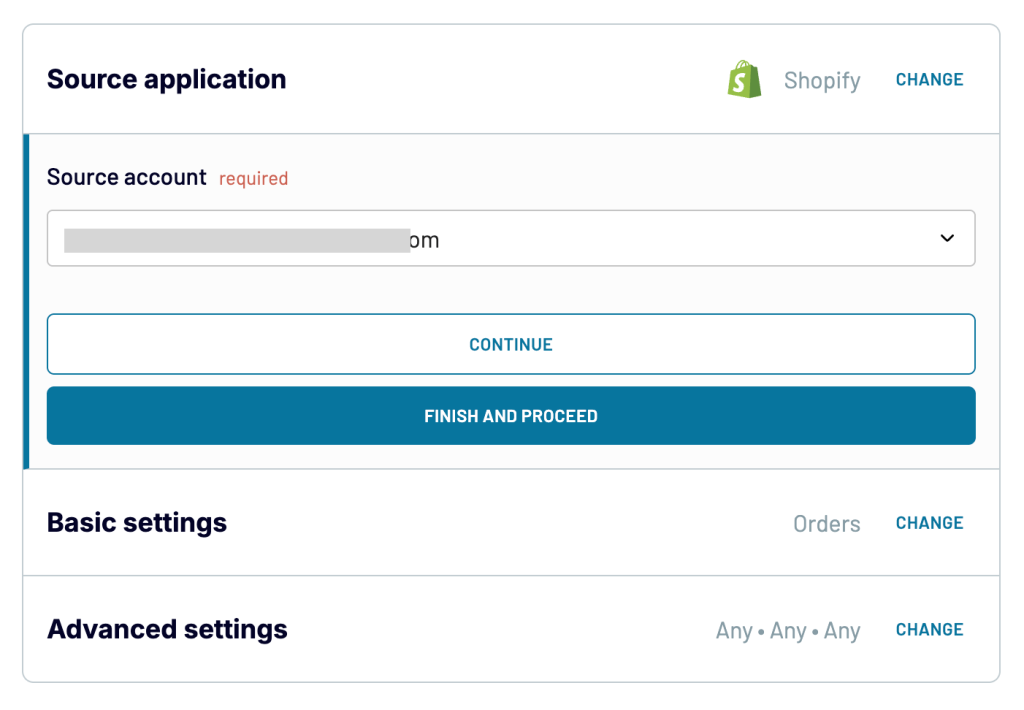
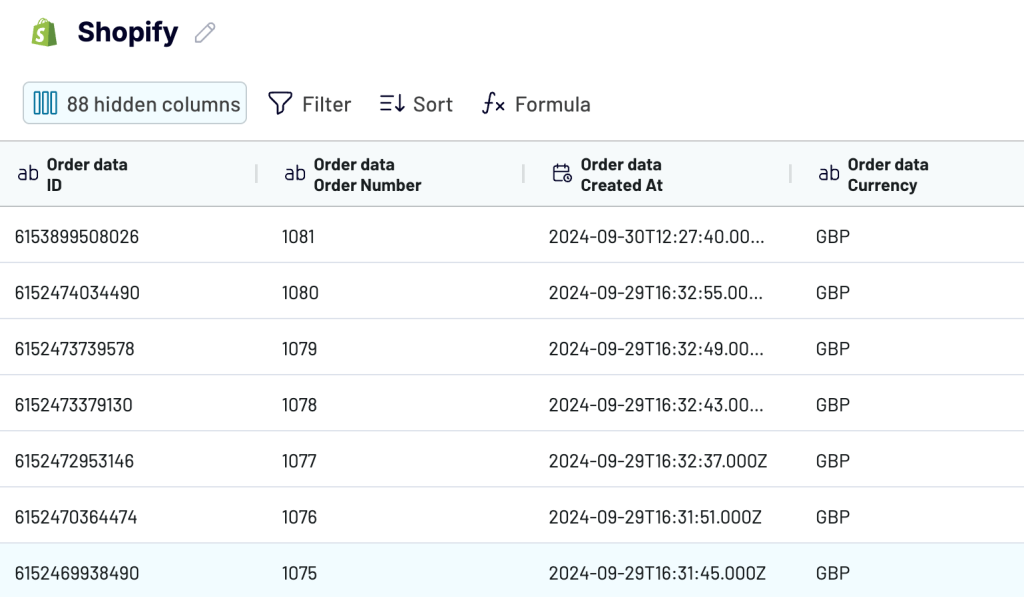
Connect your Shopify account and select the type of data to import, e.g. Orders. You can use additional settings to filter data, but that’s optional.
Then, preview the data from Shopify and apply transformations, if needed. This includes:
- Hiding unnecessary columns
- Sorting or filtering data
- Renaming and rearranging columns
- Adding new calculated columns
- Blending data from several apps into one dataset
Once done, follow the instructions and connect the importer to the destination.
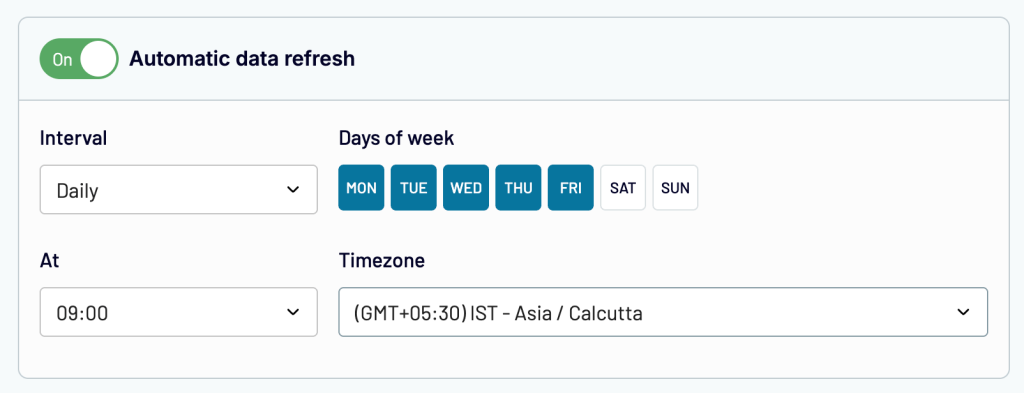
Furthermore, you can set up a custom schedule to automatically refresh your report’s data. This helps you keep the report up to date with the latest data from your Shopify store.
Now, you can use the imported data to build reports like the one in the example below.
That’s it. Coupler.io importer will now keep updating the report with the latest data automatically. In case you want to import more than one type of data from Shopify (for e.g., Orders, Products, Customers, etc.), you can follow the same process for each data entity. You can also have a loot at our article on building a Shopify sales dashboard for more tips on creating a report from scratch.
How to analyze data from Shopify in Google Analytics
Google Analytics helps you gain insights into traffic sources and user interactions. You can easily set it up on your Shopify store using its official app.
- Install the Google & YouTube app from the Shopify app store
- Open the app from the Sales Channels > Google & YouTube
- Click Connect Google account and grant the required permissions
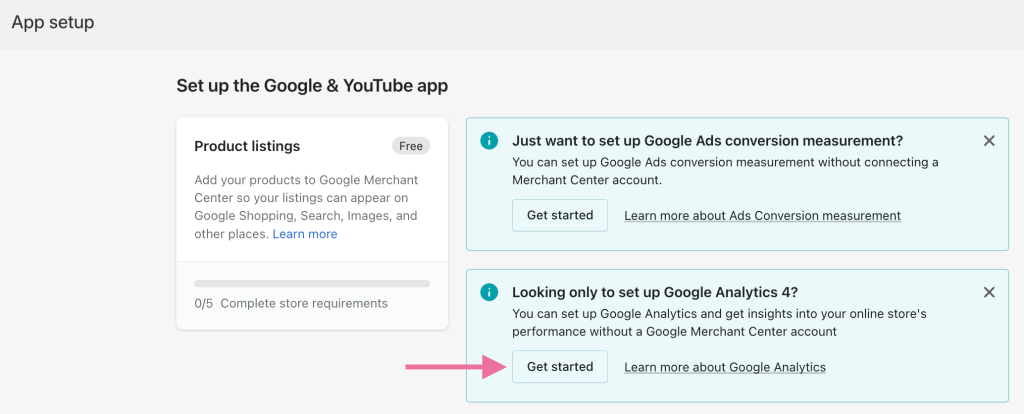
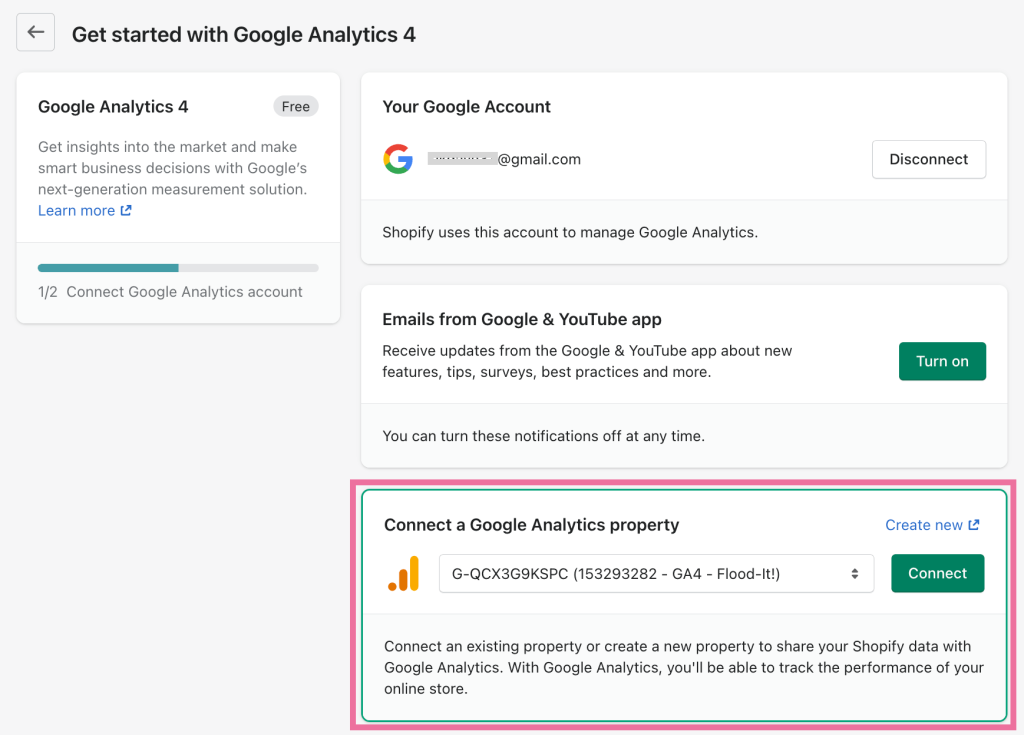
- Now, click Get Started in the alert message to set up Google Analytics 4
- The app will fetch the list of Google Analytics properties in your account. Choose a property from the list and click Connect. If you don’t have a property for your online store, you can add one.
Once connected, it can take up to 48 hours for Google Analytics 4 to start displaying data.
GA4 has pre-defined reports for user acquisition, retention, engagement, and monetization.
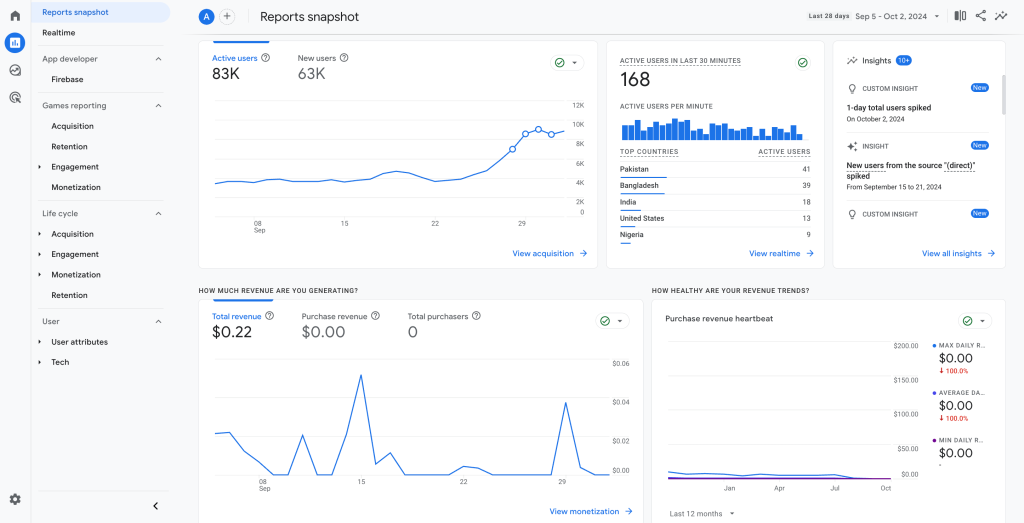
You can also create custom reports (known as Explorations).
GA4 adds tags (JavaScripts) to each page of your website. The tags allow Google to track user interactions and events. But keep in mind that, in some cases, the data provided by Google Analytics 4 may be inaccurate. For example, it may not track users who have ad blockers that prevent the Google Analytics 4 script from running.
FAQs
Is there a Shopify Analytics API to fetch data for reporting?
There is no specific API endpoint in Shopify to fetch analytics data. However, you can use other admin API endpoints to replicate the data. Interestingly, there used to be something called ShopifyQL API for querying analytics data from Shopify. However, it has been deprecated.
Can you export analytics reports from Shopify?
Yes, you can export the data into a CSV file. Here’s how:
- Go to the Shopify Analytics section in the admin panel
- Select the Reports tab and select the report you need
- Click the Export button at the top to download the CSV file
To automate the data export at regular intervals, you can use Coupler.io. It can help you export Shopify data to Google Sheets, Microsoft Excel, Looker Studio, and other platforms. You can also combine it with first-party data sources, such as sales figures from your CRM, to understand the bigger picture of your analytics.
What metrics are important for Shopify analytics?
To analyze your store’s performance, here are some KPIs you can track:
- Total page views (sessions)
- Total number of orders
- Online store conversion rate (% of visitors who placed an order)
- Number of new customers
- Total sales revenue
- Average order value
These metrics are available in the default Shopify Analytics tool. For growth analysis, you can compare these metrics month-over-month.
Get the most out of your Shopify store’s data
Now it’s your turn to transform your store’s data into actionable insights with Shopify reports.
In most cases, the built-in Shopify analytics is not sufficient. While it offers accurate data for orders and sales, Google Analytics 4 is a more reliable solution to track marketing-related data (such as traffic and sessions). If you are also running paid ads, it’s better to export Shopify data on ad spend, conversions, and other PPC metrics from the ad platforms you use.
You will need a comprehensive approach to analyze these data points in a single place. For example, you can connect all your data sources to one report and build a unified dashboard. One good option is to use the free, ready-made dashboard templates we explored earlier.
Coupler.io helps you build reports in BI tools and spreadsheets by collecting data from over 60 sources, like Shopify, GA4, and PPC platforms. Additionally, it offers free, ready-made templates to quickly analyze your store’s data. Your reports will automatically refresh on a schedule to always display up-to-date Shopify data.
Automate reporting with Coupler.io
Get started for free