Your business generates valuable data every day. The question is: Are you making the most of it?
Data analytics isn’t just for big companies. When used effectively, it can help small businesses like yours make lasting improvements—from better decisions to bigger profits.
This blog shows you how to harness small business data analytics effectively. Get ready to face challenges, discover tools, and learn practical solutions to give your business a competitive edge.
What is small business data analytics?
In simple terms, data analytics is the process of turning raw data into valuable insights that drive better decision-making.
For small businesses, the focus is often on survival, scaling, and building a loyal customer base. They use small business data analytics to uncover opportunities that directly impact day-to-day operations and profitability. This means leveraging data to address key questions like, “What’s driving business growth right now?” and “How can we improve cost efficiency?”
Understanding the process
Data is gathered from various data sources, such as sales, social media, and customer interactions. This information is then processed and organized to highlight patterns and trends. Data visualization tools make it easier to understand these patterns, showing what works and what needs improvement. The focus isn’t just on the numbers but on how they inform your business strategy and enhance performance.
Choosing the right tools
With smaller budgets and simpler setups, small business owners need solutions that are both practical and efficient. Tools that consolidate multiple data sources (like sales, customer behavior, or social media) into a single place are crucial. They enable businesses to streamline decision-making and achieve better outcomes without requiring complex systems or large technical teams.
Common data analytics challenges for small businesses
Data analytics for small businesses comes with a wide range of challenges. Here are some common ones.
Limited resources
Small businesses often face limited time, budgets, and staff.
You’re juggling operations, sales, and customer service, and finding extra bandwidth to focus on data analytics can feel impossible. Many businesses put off analytics because they’re too busy, but that’s exactly when you need it most.
Staffing is another hurdle. Hiring skilled professionals or purchasing advanced analytics solutions can feel daunting when budgets are tight.
Solutions:
- Start small. Focus on just one or two key metrics directly impacting your goals, rather than trying to analyze everything.
- Use free or affordable analytics tools like Google Analytics or Looker Studio.
- Automate data collection and reporting to save time.
- Outsource analytics tasks to a consultant or agency without a full-time hire.
Lack of technical expertise
Many small businesses lack staff who are skilled in using analytics tools or interpreting data trends. It’s a lot to take in—from grasping historical data trends to using software like Tableau or Power BI.
This knowledge gap often leads to hesitation about adopting modern tools. But it doesn’t have to. Many solutions today are designed to be user-friendly, meaning you don’t need a degree in data science to use them. Still, investing in some basic training for your team can make a significant difference.
Solutions:
- Use user-friendly tools that are easy to learn and don’t require advanced technical skills.
- Provide basic training for your team with online resources or tutorials. Many analytics tools have free training material to help you get started. Affordable platforms like Udemy or Coursera are also great for quick learning.
- Consider hiring an expert or consultant to set up your analytics and guide you through the process.
- Leverage built-in dashboard templates in many tools to ease the learning curve.
Scattered data
Collecting data isn’t the hardest part for small businesses. The real challenge is scattered information. Sales records might be in one system, customer feedback in another, and inventory data hiding somewhere else. This kind of fragmentation makes it hard to see the complete picture of your business.
The problem grows when you factor in how data is stored. It’s often a mix of structured formats (like spreadsheets) and unstructured ones (like digital images or customer reviews).
Solutions:
Centralize your data in one place. Here are some approaches to consider:
- If you’re combining data from various cloud platforms, you can use Coupler.io to pull data from CRMs, sales apps, and marketing tools into a single source, such as BigQuery, spreadsheets, or BI tools. With over 60 supported apps, Coupler.io enables you to integrate data without requiring any technical skills and set up automatic refreshes to keep your insights up-to-date.
- If you’re dealing with both structured and unstructured data, use storage solutions that can handle both types, like BigQuery or data lakes.
Difficulty turning data into actionable insights
Once all the other challenges are overcome, this challenge remains.
Even if you have the data, knowing what to do with it is a different challenge. It’s tempting to gather everything you can measure and create graphs or summarize it in reports. But often, that information doesn’t point to clear actions.
The real challenge lies in identifying metrics that reflect your goals. Many businesses struggle to link their analytics directly to actionable steps.
Solutions:
- Define clear goals and metrics to analyze. For example, if your goal is to improve customer retention, a key metric to track could be the repeat purchase rate.
- Use custom dashboards tailored to your goals. The simpler and more focused, the better.
- Regularly review your data insights and adjust your strategies as needed. If something isn’t working, tweak it and monitor the results.
Practical steps for using data analytics for small businesses
Breaking the process into simple steps makes it manageable. Here’s how you can harness the power of data analytics for small businesses.
Step 1: Define goals and metrics
Start with a clear objective. Think about what you want to achieve. For example, if your marketing goal is to double website customers, that’s your focus. Next, think about the metrics you might track. Then, ask questions to select the ones that really matter.
Example breakdown:
Set a clear goal: Double customers from the website within 6 months.
Identify potential metrics: Consider metrics tied to your goal, for example:
- Unique website visitors per month
- Sessions per user
- Bounce rate (percentage of users leaving after one page)
- Conversion rate (percentage of visitors who become customers)
- Organic search traffic (visits from search engines)
- Paid search traffic (visits from ads)
- Average session duration (time spent on your site)
- Click-through rate (CTR) for ads or links
- Sign-up rate for newsletters
- Cart abandonment rate (percentage of users who leave items in their cart)
Ask key questions to prioritize metrics:
- For instance, asking “Which marketing channel generates the most conversions?” might indicate the need for tracking organic search traffic, paid search traffic, cost-per-lead, revenue generated by each channel, and conversion rates per channel.
- Similarly, questions like “Which pages drive the highest conversions?” guide you toward metrics like bounce rate, conversion rate, and average session duration for key landing pages.
Asking these questions will help you select the most impactful metrics and identify relevant data sources. This keeps your decisions focused and increases your chances of success.
Step 2: Collect and prepare data
Focus on gathering the data that answers your key questions. Then, ensure it’s clean and ready for analysis.
Some categories of data sources and examples:
- CRM systems: Salesforce, HubSpot, and Zoho CRM.
- Web analytics data: Google Analytics, HotJar, and Adobe Analytics.
- Social media: Instagram, Facebook, and LinkedIn.
- Sales platforms: Shopify, WooCommerce, and Stripe.
- Accounting platforms: Xero and QuickBooks.
- Advertising platforms: Google Ads, Facebook Ads, and Instagram Ads.
- Files: JSON, CSV, XML, PDF, and Excel.
- Databases and warehouses: MySQL, PostgreSQL, BigQuery, and Amazon Redshift.
- External data: For example, tools like SEMrush and SimilarWeb help you analyze trends and uncover market opportunities.
Once you collect data, ensure it’s clean. If necessary, filter out duplicates, fix incorrect data, and fill in missing details.
While manually gathering data takes time, Coupler.io makes it simple. It pulls data from your CRM, social media, and analytics tools into one place. This tool allows you to organize your data into ready-to-use reports:
- Blend multiple data sources into one view
- Aggregate data to drill down into datasets
- Filter datasets by the required criteria
- Visualize information with predesigned dashboards and templates.
For small businesses like yours, Coupler.io can be a lifesaver since it saves hours of your time that you previously spent on repetitive reporting tasks.
Step 3: Visualize to discover – analyze to understand
When working with your business data, you might wonder whether to analyze first or visualize first. For most small businesses, a simple approach works best:
Start with basic visualization. Create simple charts of your raw data—perhaps a line graph of monthly sales or a bar chart comparing marketing channels. This “first look” helps you quickly identify patterns, unusual spikes, or unexpected drops that deserve attention.
For example, a retail shop owner might create a basic chart showing sales by day of the week and immediately notice that Thursdays consistently outperform other weekdays—an insight that might not be obvious when looking at spreadsheet numbers.
Then dive into analysis. Once you’ve identified interesting patterns, analyze them to understand what’s happening and why. In our retail example, the owner might filter Thursday sales by product category or time of day to identify precisely what’s driving those strong results.
Visualize again to refine. As your analysis uncovers deeper insights, create more targeted business data visualizations to better understand specific aspects of your data. This becomes an iterative process—visualize, analyze, visualize again—with each cycle bringing you closer to actionable insights.
One key point to remember: At this stage, visualization is focused on understanding your data better. Later, in Step 4, when you build dashboards or reports, the focus shifts to communicating those insights to drive decisions.
Types of data analysis and methods
The type of analysis you conduct depends on the questions you need to answer. Most analyses fit into four main categories:
- Descriptive analytics
- What it answers: What happened? What is happening?
- Example question: Which marketing channel generates the most conversions?
- Techniques: Use basic summarization methods. This includes counts, sums, averages, or finding minimum and maximum values.
- Diagnostic analytics
- What it answers: Why did it happen?
- Example question: Why did conversions drop on a specific marketing channel?
- Techniques: Drill down and filter into the details to find hidden patterns or causes. You can also use techniques like regression and correlation analysis. These will help you identify root causes, whether it’s demographic shifts, ad targeting issues, or seasonal changes.
- Predictive analytics
- What it answers: What’s likely to happen in the future?
- Example question: Which marketing channel is expected to generate the most conversions next month?
- Techniques: Use time-series analysis with statistical models or predictive machine learning algorithms.
- Prescriptive analytics
- What it answers: What should we do next?
- Example question: Based on current trends, how should we allocate our ad budget to maximize conversions?
- Techniques: Typically involves what-if analysis to guide decisions. Machine learning algorithms can also be trained on historical data to predict how different strategies will perform.
AI-powered analysis
AI is changing how we analyze and visualize data.
Many tools now include AI-driven features that can process massive datasets faster than humans and even find patterns and trends we might miss.
For example, Excel uses AI to automate reports, predict trends, and suggest formulas based on the data you’re working with. HubSpot also uses AI to extract insights, analyze competitors, and automate data entry tasks.
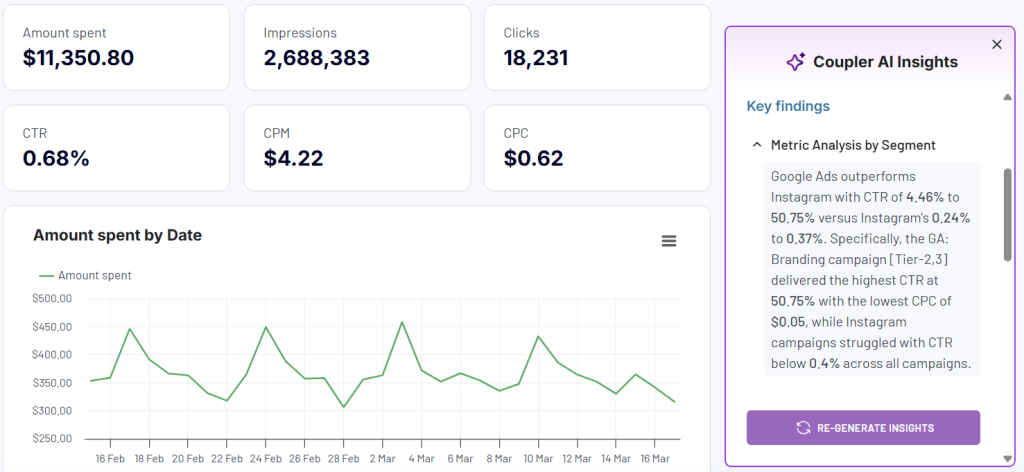
Coupler.io’s AI Insights feature is particularly valuable for small businesses without data analysts. It can automatically analyze your integrated data to highlight key trends, outliers, and performance metrics in plain language. Simply connect your sources to the pre-designed dashboard and let AI Insights generate findings that explain what your numbers actually mean for your business.

For small businesses, AI doesn’t just save time; it can also help them stay ahead. For example, tools with predictive analytics can help you forecast trends, understand customer behavior, or estimate future best-selling products. By seeing what’s coming next, you’ll be able to prepare better.
Step 4: Build dashboards and reports to communicate insights
“Data visualization is the language of decision-making. Good charts effectively convey information. Great charts enable, inform, and improve decision making.” – Dante Vitagliano
The main goal at this stage is to communicate findings in a way that drives decisions and action.
A good visualization not only displays data but also tells a story.
Depending on what story you need to tell, you can display it in a dashboard or report depending on what story you need to tell. While dashboards show all key metrics in one place to help you see the big picture, reports break down the details for a specific topic or period.
For example, a marketing data analytics dashboard might compare which ad campaigns brought the most conversions. It displays metrics like traffic by channel, cost per lead, and conversion rates. A related report might dig deeper into a single campaign or a breakdown by audience demographics.
Why you need a dashboard
Dashboards help you notice patterns and trends that numbers alone might hide. For example, imagine your sales drop during a week. With a dashboard, you can determine if this dip is just a one-time issue or part of a seasonal trend. The visuals help you determine what’s happening and respond without overreacting or missing the bigger picture.
Example of a sales analytics dashboard:

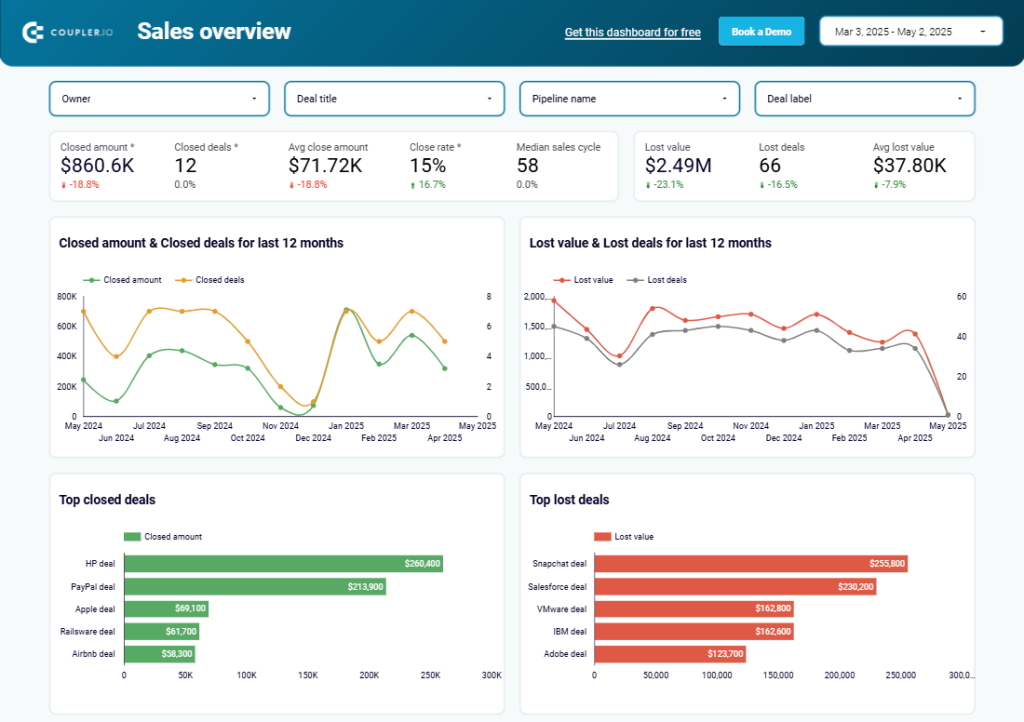
Dashboards bring all your key metrics into one view and offer context. This allows you to compare metrics side by side and reveal hidden insights. For example, if your “close rate” is high but your “average close amount” is shrinking, it might point to a couple of things worth looking into.
What makes a good dashboard
A good dashboard keeps things simple and useful. Here’s what to focus on:
- Alignment with goals: Make sure the metrics reflect your business objectives. This helps you track what truly matters and stay on the right path.
- Understand your audience: Dashboards should be designed with their intended users in mind. For example, a business owner may want an overview, while the sales team needs detailed performance metrics.
- Accurate and real-time data: Use reliable data sources and, if possible, set up real-time updates. Outdated numbers can lead to poor decisions.
- Simple and visual design: Use charts or graphs that make the data easy to understand. For example:
- Line charts – for showing trends over time, such as monthly sales.
- Bar charts – to compare values, such as product sales by category.
- Pie charts – to show proportions, such as market share by channel.
- Tables – when precise numbers matter, like budgets or itemized costs.
- Enable easy sharing and collaboration: Make dashboards easy to access and share with your team. When everyone sees the same numbers, decisions become faster and more aligned.

A well-designed dashboard helps you stay on track, spot issues early, and make smarter decisions. Invest in tools that integrate easily with your systems, and keep experimenting to improve your dashboard until it’s just right for your business.
Tools for creating custom dashboards
- Spreadsheets: Tools like Microsoft Excel and Google Sheets can be a starting point, especially for small businesses. They’re great for small datasets and quick summaries. Google Sheets allows easy collaboration, while Excel may offer more advanced formulas for your analysis.
- BI tools: If you have larger datasets or need more advanced dashboards, tools like Power BI, Tableau, and Looker Studio are excellent choices. They offer a wide range of sophisticated and interactive visuals. While they may have a steeper learning curve, the features are worth it for businesses looking to grow.
- Data automation tools: These tools automate data collection from different systems. Coupler.io, for example, pulls data from over 60 apps, including sales, marketing, finance, and e-commerce platforms. It consolidates information into one place and offers regular automatic updates to ensure your dashboards always display the most recent data. This eliminates hours of manual data preparation and reduces the risk of analysis based on outdated information.
Save time with dashboard templates
Creating dashboards from scratch can be overwhelming, especially when you’re running a small business. With pre-built templates, you can save hours, even days.
Coupler.io offers dashboard templates for different needs, such as sales, marketing, finance, SEO analytics, and CRM. For example, the customer acquisition dashboard visualizes customer journeys from the first impression of your ad to becoming a customer.
Customer acquisition dashboard for HubSpot in Looker Studio

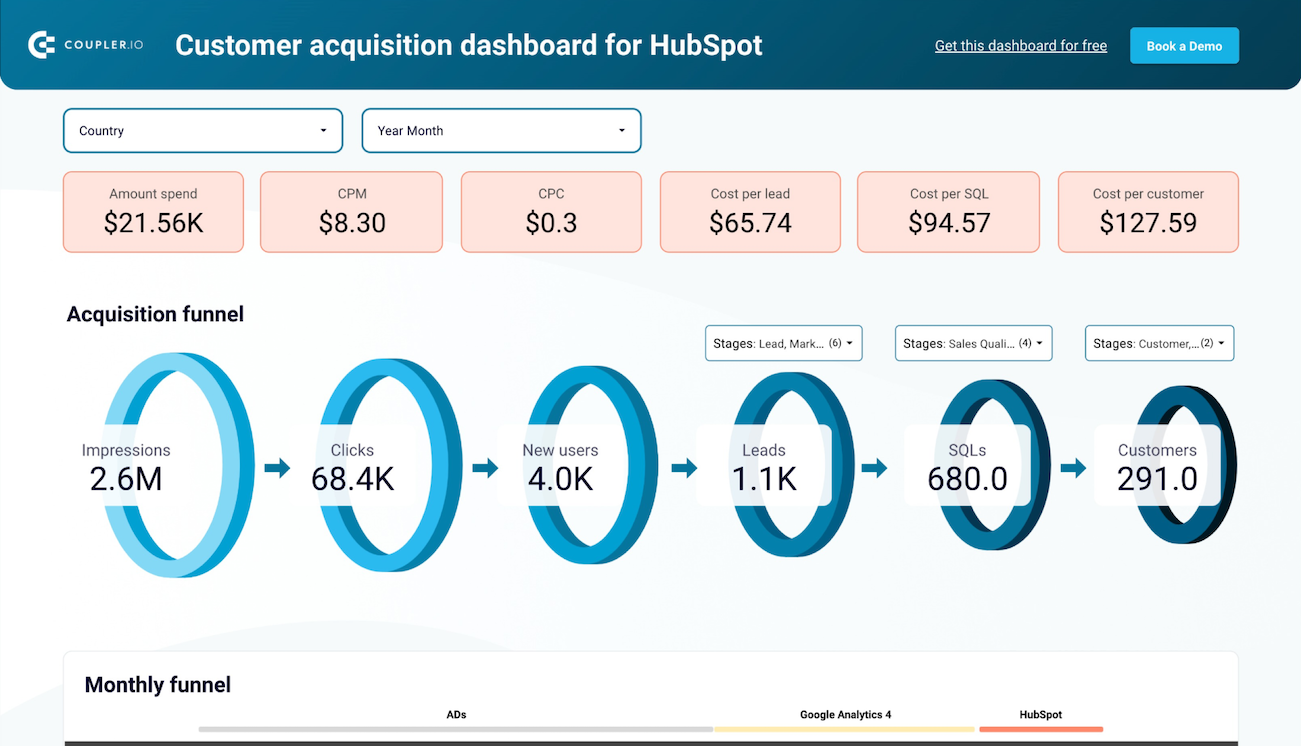
Customer acquisition dashboard for HubSpot in Looker Studio
Preview dashboardA financial data analytics dashboard provides instant visibility into revenue trends and expense management.
QuickBooks financial dashboard in Google Sheets
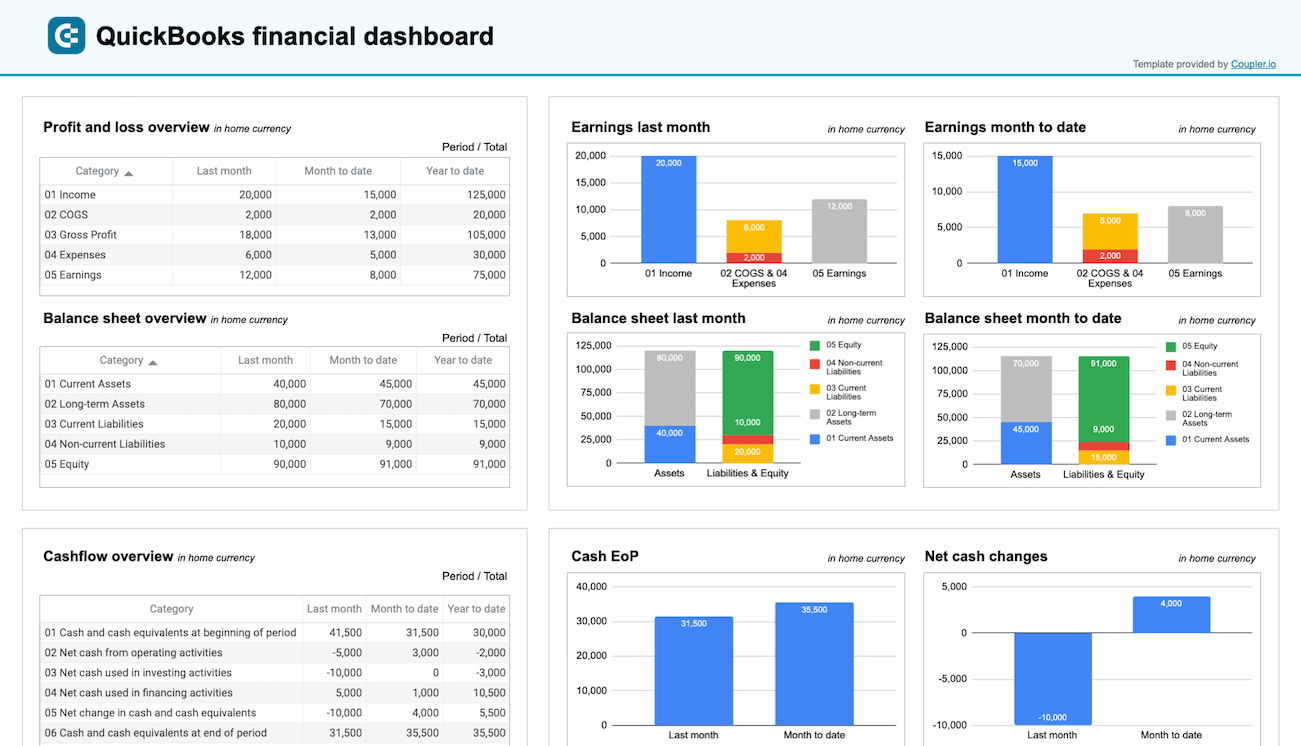
QuickBooks financial dashboard in Google Sheets
Preview dashboardThere are over 100 dashboard templates that are not just time-savers, but also ensure you’re focusing on the right metrics. They’re built with industry best practices, so you’ll know you’re tracking what matters most for your specific business goals.
Step 5: Make data-driven decisions
All the data you’ve gathered and analyzed at this final stage should guide your decision-making process. The goal is to make choices backed by facts. Whether it’s tweaking your marketing strategy, streamlining inventory, or targeting a new customer group, analytics should point you in the right direction and reduce guesswork.
Data-driven decisions can lead to remarkable results when done right. On the other hand, ignoring data or using poor-quality information can result in poor decisions.
Successful data-driven decision example:
Take Fable, for example. This food company struggled with tracking inventory across multiple markets. They often found inventory expiring without notice, leading to financial losses. Decision-making was slow, delayed by outdated reports.
By automating data integration using Coupler.io and building real-time dashboards, they gained real-time insights into their inventory and finances. This saved them from dealing with expired stock, kept their products moving, and saved $60,000+ a year on analytics tasks.
With clear visuals, they understood exactly where adjustments were needed and optimized their distribution.
Unsuccessful decision-making example:
Unfortunately, not all decisions made with data lead to success.
Take, for instance, a company that launched a new product line based on outdated sales trends. They noticed mushroom-based snacks performing well in one region and assumed it was a nationwide trend. Without validating the data or analyzing other regions, they increased production and rolled out the product everywhere.
The result? Warehouses in some areas overflowed with unsold goods, while others ran out of stock. This led to wasted inventory, unhappy customers, and substantial financial loss. The issue arose from relying on incomplete data rather than thoroughly analyzing regional preferences and demand.
Good or bad, every decision offers a learning opportunity. Use data not just to plan your next move but to go back and evaluate whether previous decisions worked. Adjust, refine, and grow. That’s how data-driven decision-making turns into a superpower for your business.
Essential data analytics tools for small businesses
Small businesses need simple, affordable tools to understand their data and drive growth. Here’s a breakdown of key categories with examples to help you get started.
Web analytics tools
If you run a website, knowing how visitors engage with it is essential. Web analytics tools help you understand how visitors interact with your website. They track traffic, user behavior, and where visitors drop off so you can improve performance and boost conversions.
Examples:
- Google Analytics — Provides detailed insights about website traffic and user actions.
- Mixpanel — Tracks user interactions with your site or app to improve engagement.
- Hotjar — Offers heatmaps and session recordings to visualize user behavior.
- Matomo — An open-source tool that prioritizes data privacy.
- SimilarWeb — Assists with traffic comparison and competitor analysis.
CRM analytics tools
A Customer Relationship Management (CRM) platform does more than store customer contacts. Many of these tools come packed with analytics functionalities that provide insights into the customer lifecycle, preferences, and loyalty trends.
Examples:
- HubSpot CRM — Tracks customer details and generates marketing insights.
- Zoho CRM — Affordable and packed with features like sales forecasting.
- Pipedrive — Great for sales analytics and sales pipeline.
- Insightly — Combines CRM features with project management tools.
Social media analytics tools
Social media analytics tools measure how your posts and ads are performing. They also show what resonates with your audience and where you can improve.
Examples:
- Hootsuite — Tracks how posts perform across various platforms.
- Sprout Social — Offers detailed insights and helps with social media management.
- Buffer — Simplifies planning and analyzing social media campaigns.
Data automation tools
Small business data analytics often pulls data from various sources like CRMs, social accounts, and spreadsheets. Automation tools simplify this process by merging everything into one system for easier analysis. Some also include analytics features, like built-in analytics dashboards or the ability to send data to BI tools.
Examples:
- Coupler.io — Pulls data from over 60 platforms into a single destination.
- Zapier — Sends data between apps and automates workflows without coding.
- Power Automate — A Microsoft tool designed to simplify repetitive tasks with smart workflow automations.
If you are exploring data from multiple cloud platforms, Coupler.io is worth considering. It lets you automate data imports from apps like Google Ads, HubSpot, Shopify, Mail?himp, and many others into one system. Its user-friendly interface makes setup a breeze, even if you’re not a tech person.

Coupler.io pulls data from over 60 platforms into a single destination and offers powerful transformation features to clean and structure your data without coding. With automated scheduling, you can ensure your reports and dashboards always contain the most current information, saving hours of manual work each week while improving decision-making with up-to-date insights.
Business Intelligence (BI) Tools
BI tools make data visual with easy-to-understand dashboards and reports, helping to turn raw information into actionable insights.
Examples:
- Microsoft Power BI — Integrates seamlessly with other Microsoft tools.
- Google Looker Studio — Integrates with Google tools for custom visualizations.
- Tableau — Great for detailed, interactive data visualizations.
How to simplify your small business data analytics workflow
Meet Suzy, the owner of a growing e-commerce store selling beauty tools. Like many small business owners, she wanted to make better decisions to grow her brand. However, managing data analytics felt overwhelming. There were so many data sources to track across her marketing efforts, and building insights was both time-consuming and confusing.
Then Suzy discovered Coupler.io.
By using this user-friendly tool, Suzy streamlined her entire data workflow without needing advanced technical skills. Here’s how she did it and how you can, too.
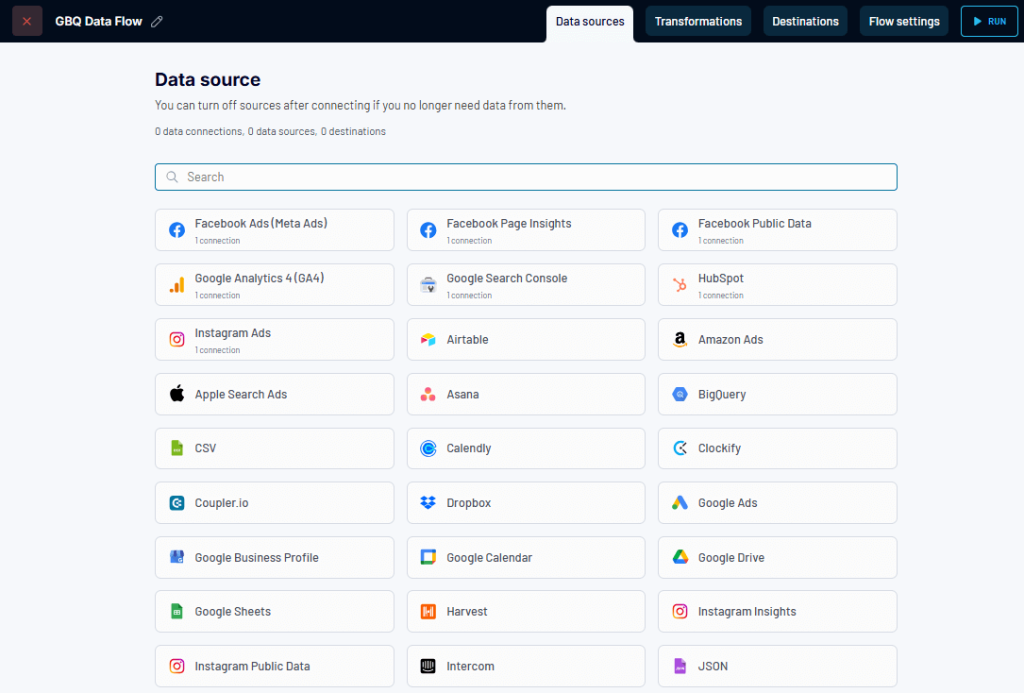
Case 1. Create an automated data flow
Suzy wanted to quickly share campaign results with her stakeholders. But manually exporting data from tools like Google Ads and Facebook Ads, then uploading it to a spreadsheet, ate up valuable hours each week.
With Coupler.io, she automated this process. Suzy set up an automated data flow to extract data from her advertising platforms and load it directly into Google Sheets.

By setting up an automatic data refresh schedule, her data updates periodically at the intervals of her choice. Stakeholders always have the latest data at their fingertips.
This saved Suzy hours of repetitive work, reduced errors, and helped her focus on more meaningful tasks to grow her business.
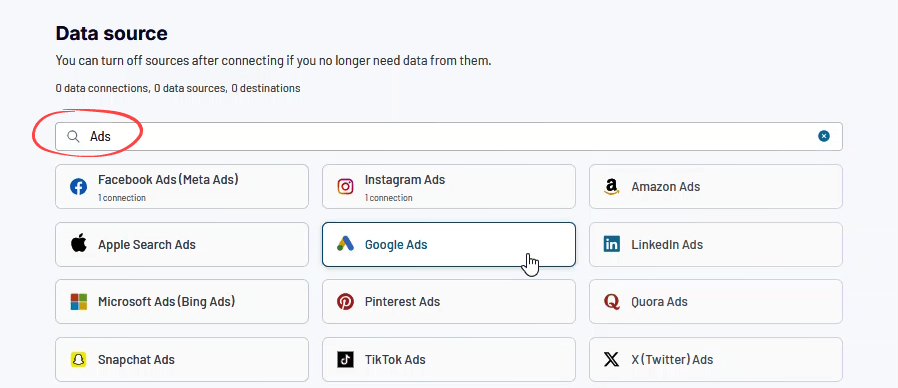
How you can do it too:
- Connect your data sources from e-commerce apps like Shopify to CRM tools like HubSpot with Coupler.io.
- Select your destination, whether it’s a spreadsheet app (Excel, Google Sheets), a data warehouse (BigQuery, PostgreSQL), or a BI tool (Looker Studio, Power BI).
- Enable automatic updates to get the latest data.
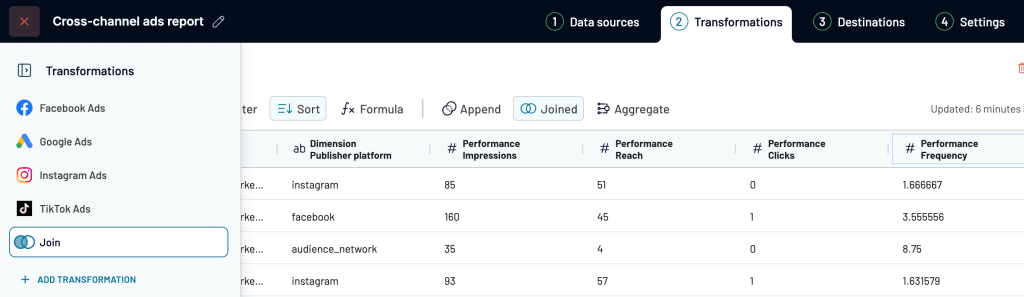
Case 2. Create a tabular report with ease
When Suzy wanted to analyze her ad performance, she often found herself digging through multiple apps to piece together a report. It was tedious and prone to errors. Coupler.io helped her simplify this with its data transformation features.
Instead of having separate reports for Facebook Ads analytics, Google Ads, and other platforms, she collected data from all her channels and organized it into one view.

To turn data into a report, she could:
- Hide, edit, and reorder columns to focus on the most important metrics.
- Filter and sort data for a clearer view of trends and patterns.
- Add custom columns with formulas to calculate insights on the go, like the return on ad spend.
- Summarize columns to quickly find aggregated values such as averages, totals, or counts.
She also combined data from multiple sources. With Append, she blended datasets with similar structures, like Facebook Ads and Google Ads. With Join, she merged data with shared fields like campaign name.
When the report was ready, Suzy exported it to Google Sheets. It was neat, clear, and ready to share or analyze.

How you can do it too:
- Pull in data from multiple sources, including PPC platforms, CRM apps, social media, and more with one tool.
- Organize your data in a report using the built-in transformation features, including sorting, filtering, adding columns with formulas, and even joining datasets into a single tabular dataset.
- Export the tabular data to your tool of choice.
Case 3. Turn data into a dashboard almost instantly using templates
Suzy needed a quick way to see her brand’s visibility across channels. She also wanted to track which campaigns were driving engagement and share those insights with her team.
The problem? Building a customized dashboard from scratch was just too much. It felt overwhelming and took forever.
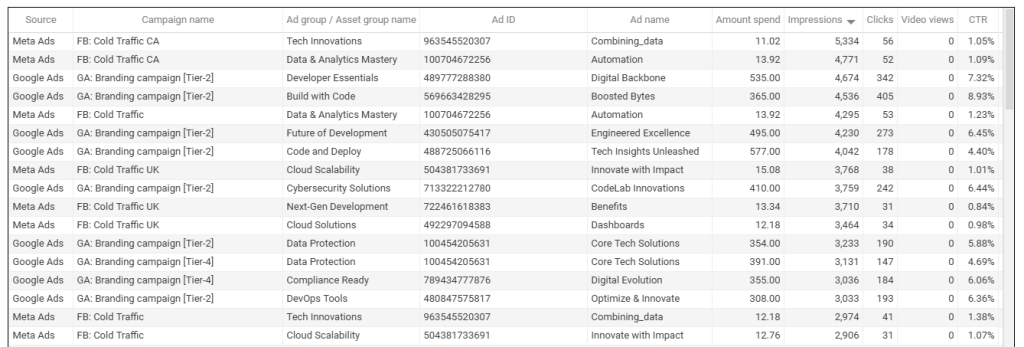
Luckily, Suzy found a shortcut with Coupler.io’s brand awareness dashboard template in Power BI.
All she had to do was connect her data sources. No complicated setup. Within minutes, she had a fully functional dashboard showing her most important metrics.
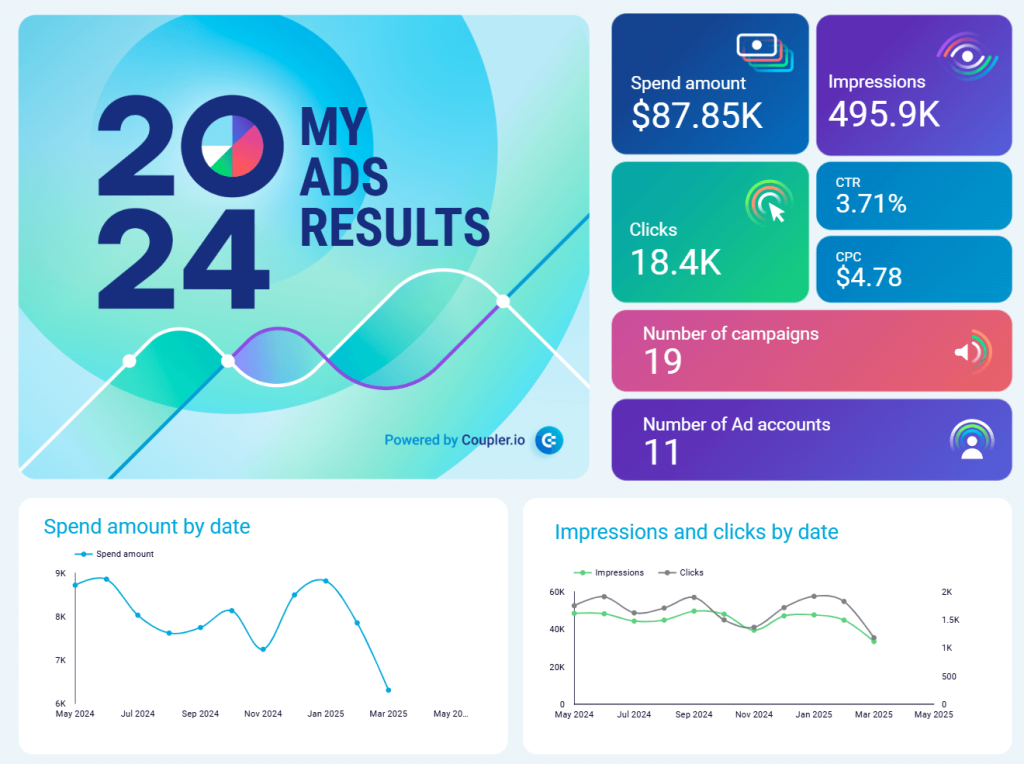
Brand awareness dashboard template in Power BI

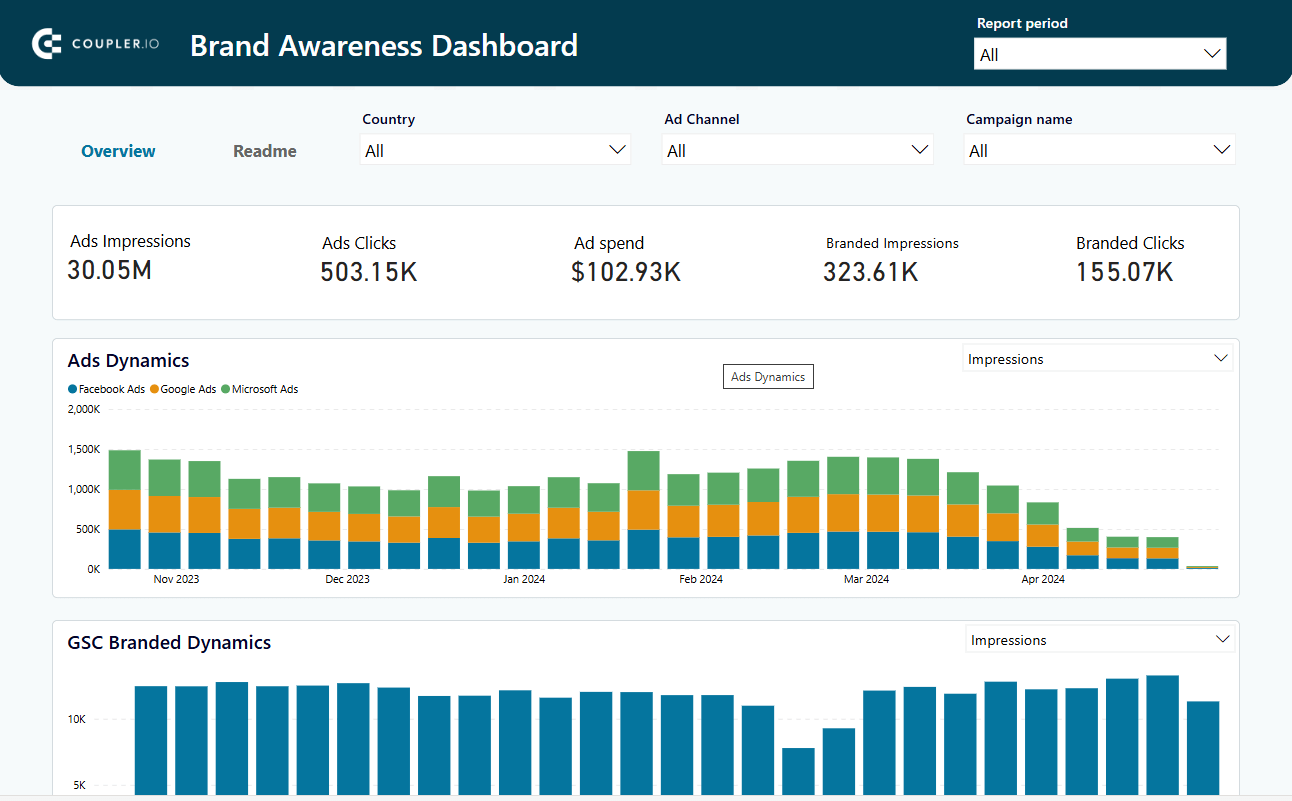
Brand awareness dashboard template in Power BI
Preview dashboardAt a glance, she could see key metrics that aligned with her goals:
- Total branded impressions and clicks: How often her brand showed up and how people responded.
- Ad impressions, clicks, and ad spend: Performance details across different platforms and locations.
- Comparative ad performance: Which channels were the most cost-effective and delivered the best results.
Plus, she could filter the data to dig deeper:
- By channel (Google Ads, Facebook Ads, Microsoft Ads).
- By campaign name to see what resonated most with her audience.
- By country to pinpoint how her strategy performed across regions.
Suddenly, the insights she needed were just a few clicks away! ?
How you can do it too:
- Pick a template from Coupler.io’s gallery.
- Connect your data sources.
- Sit back and watch your KPIs visualized in just minutes. Done!
Choose what works for you
The above use cases illustrate how Coupler.io can simplify small business data analytics workflows. Whether you want to automate data imports, create custom reports, or use pre-made dashboards, Coupler.io has you covered.
For small business owners like Suzy (and you), tools like Coupler.io make all the difference. You save time, avoid headaches, and get clear, actionable insights. Instead of wrestling with raw data, you focus on growing your business.
With features like:
- Support for key data sources
- The ability to blend and unify data
- Pre-made dashboards that require no setup
Coupler.io empowers you to take control of your data analytics workflow. You free up time to concentrate on your business while still making smarter choices.
Try it out now and make your data workflows easier, just like Suzy did.
Small business success stories
Let’s explore inspiring cases where Coupler.io and small business data analytics improved efficiency, solved data problems, and accelerated growth. Discover how it’s making a difference for businesses like yours.
Fable: Saving $60K/Year with smarter data analytics

Problem: Fable, an Australian-based food company, struggled with scattered inventory data and manual financial reporting. Miscommunication between locations caused delays, and the risk of expired stock hurt their bottom line. Decision-making was slow and inefficient.
After: Coupler.io helped Fable save over $60,000 annually by automating data workflows. They achieved a 0% expiration rate for products and significantly reduced budget variance to 6–8%. Reporting became transparent, and proactive decisions became the new norm.
How Coupler.io helped: Coupler.io brought all their systems together, importing data seamlessly into BigQuery and then Power BI. It created global transparency across regions, improving inventory accuracy and enabling smarter budget planning. Fable’s team now relies on Coupler.io for real-time insights and efficient operations.
ClaritySeed: Saving over 40 hours monthly on reporting

Before: David Chau, founder of ClaritySeed, struggled with Google Analytics reports for clients. Manual data extraction from tools like Google Analytics and Facebook Ads was eating up time. He spent hours juggling raw data, leaving little room for making impactful business decisions. His promise of timely, data-driven strategies for clients felt increasingly out of reach.
After: With Coupler.io, David automated reporting workflows, freeing up over 10 hours a week. Daily reports for Google Sheets now update automatically, reducing delivery time by 5 hours. This efficiency allowed ClaritySeed to pivot faster and optimize marketing campaigns.
How Coupler.io helped: David used Coupler.io to integrate data from essential platforms like Google Analytics and Facebook Ads into ready-to-use dashboards in Google Sheets. This no-code tool simplifies data analytics for small businesses. It eliminates manual tasks and provides real-time, error-free reporting, making decision-making seamless.
PlumBooks

Before: PlumBooks, an accounting service for home contractors, struggled to visually present clients’ financial data. While QuickBooks worked for bookkeeping, clients needed an intuitive way to monitor crucial metrics like profit margins and expenses. Manual processes were clunky and time-consuming.
After: After adopting Coupler.io, PlumBooks provided clients with interactive dashboards that auto-update. Clients could instantly access their performance metrics, while PlumBooks saved 4–6 hours of setup per client. Their improved services led to a 40% revenue growth in one year.
How Coupler.io helped: Coupler.io seamlessly connected QuickBooks data with interactive Looker Studio dashboards. Customized templates allowed clients to track their goals independently, while automation streamlined setup for the PlumBooks team. This elevated service earned them loyal customers and a competitive advantage.
These success stories demonstrate how Coupler.io can transform data workflows for businesses of any size. Whether you’re struggling with scattered data sources, time-consuming manual reporting, or creating insightful dashboards, Coupler.io offers an affordable solution that grows with your business. With pricing plans starting at free, you can begin automating your data processes today without significant investment.
Ready to streamline your data analytics workflow? Try Coupler.io for free and join thousands of small businesses that are making smarter, data-driven decisions.
Automate reporting with Coupler.io
Get started for freeWhy data analytics matters for small businesses
Balancing revenue goals, customer needs, and daily operations can feel like a juggling act for small businesses. But data analytics can change everything, giving you the clarity and control you need to stay ahead.
Here’s why it matters:
Better understanding of your business and customers
Data analytics gives you insights into customer behavior, sales trends, and operational bottlenecks.
Take Netflix as an example. The streaming giant uses historical data, such as time spent watching and favorite genres, to create better recommendations and even decide on renewing shows. Small businesses can do the same on a smaller scale—tracking customer interactions, purchase histories, and preferences to better tailor offers that resonate. By understanding your data, you gain a clearer picture of your audience, fostering stronger relationships.
Improved decision-making
Analytics equips you to make informed decisions across critical areas like marketing, sales, and finance. It replaces guesswork with clarity.
Imagine you’re running campaigns across multiple channels. Without data, you might allocate your budget evenly or rely on intuition. But with analytics, you can identify which channels yield the best return. Your decisions become focused and cost-effective.
Staying competitive
The reality is, your competitors are already getting smarter with their data. To stay in the game, you need to do the same. At the very least 🙂
Better yet, it’s about staying one step ahead.
Consider this example. An e-commerce wholesaler used predictive analytics to forecast which products would align with the latest market trends. With those insights, they introduced trending products faster than anyone else. The result? A 35% boost in monthly orders.
Small business data analytics can do more than just help you keep pace. It can be your ticket to leading the market.
Big data for small businesses: Another challenge or a benefit?
When you hear the term “big data,” you might picture massive datasets used by big companies. However, for small businesses, it’s not the data size that makes it “big” but how diverse and complex it is.
Think about the information your business collects every day—from customer data, sales figures, and social media feedback to website analytics. Analyzing it means combining this diverse information (both structured and unstructured) to uncover patterns that help you make smarter business decisions.
Big challenges
One big challenge is the skill set it demands. You need people with a mix of expertise in math, technology, communication, and business analytics. This “ideal blend of skills” is hard to find, especially for small businesses with limited resources.
The second big challenge is the data itself. It’s often scattered across different systems and stored in various formats. Structured data, like spreadsheets, is easier to handle. However, unstructured data, like customer comments, online photos and videos, might be difficult to organize and analyze. Studies even show that 95% of businesses struggle with managing unstructured data.
Big data tools, AI, and how they help
Fortunately, modern technologies and powerful tools make big data easier to handle.
Many of these tools rely on Artificial Intelligence (AI) to do the heavy lifting. AI-powered systems can process unstructured data and automate complex, repetitive tasks.
Predictive analytics is another essential component of big data. It combines statistics, machine learning, and data mining to analyze past and current trends and make predictions about the future. This helps businesses make smarter, data-driven decisions more quickly.
Here’s an interesting fact: By 2025, 65% of organizations will use or actively explore AI in their data strategies. This highlights how crucial AI is becoming in turning raw data into useful insights with its powerful algorithms.
Big benefits
Big data delivers big rewards when used right. Some of these benefits include:
- Greater transparency by transforming scattered data into one clear picture of your business.
- A better understanding of customer behavior so that you can deliver more personalized customer experiences.
- Reveals new market opportunities you might not see otherwise.
At the end of the day, it’s not about how much data you have; it’s about how you use it. With the right tools, small businesses can harness big data to drive growth and gain a competitive edge. For example, Coupler.io allows you to consolidate customer data from CRMs with social media engagement metrics and financial data to create a 360-degree view of business performance. This unified approach turns scattered information into actionable insights without requiring specialized technical knowledge.
Automate reporting & analytics with Coupler.io
Get started for free