A social media dashboard is a consolidated report of your most important performance metrics that helps you track and improve your social media strategy. It provides actionable insights on what are your most profitable social media channels and informs your marketing strategy. SoMe dashboards can focus on one or multiple social media platforms, such as Facebook, Instagram, YouTube, or X, and is meant to act as your main social media reporting tool.
Getting started with a social media dashboard can feel overwhelming. Which metrics should you display and why? What type of chart best illustrates insights? Do you need a dedicated dashboard for each social media channel or a multi-channel one?
To help answer these questions, we’ve created a list of five essential dashboards to help social media managers start tracking performance. Read on to get insights into how each dashboard helps and what key metrics you can track using them.
Below are five examples of social media dashboards that every social media marketing team should use.
1. Instagram business dashboard
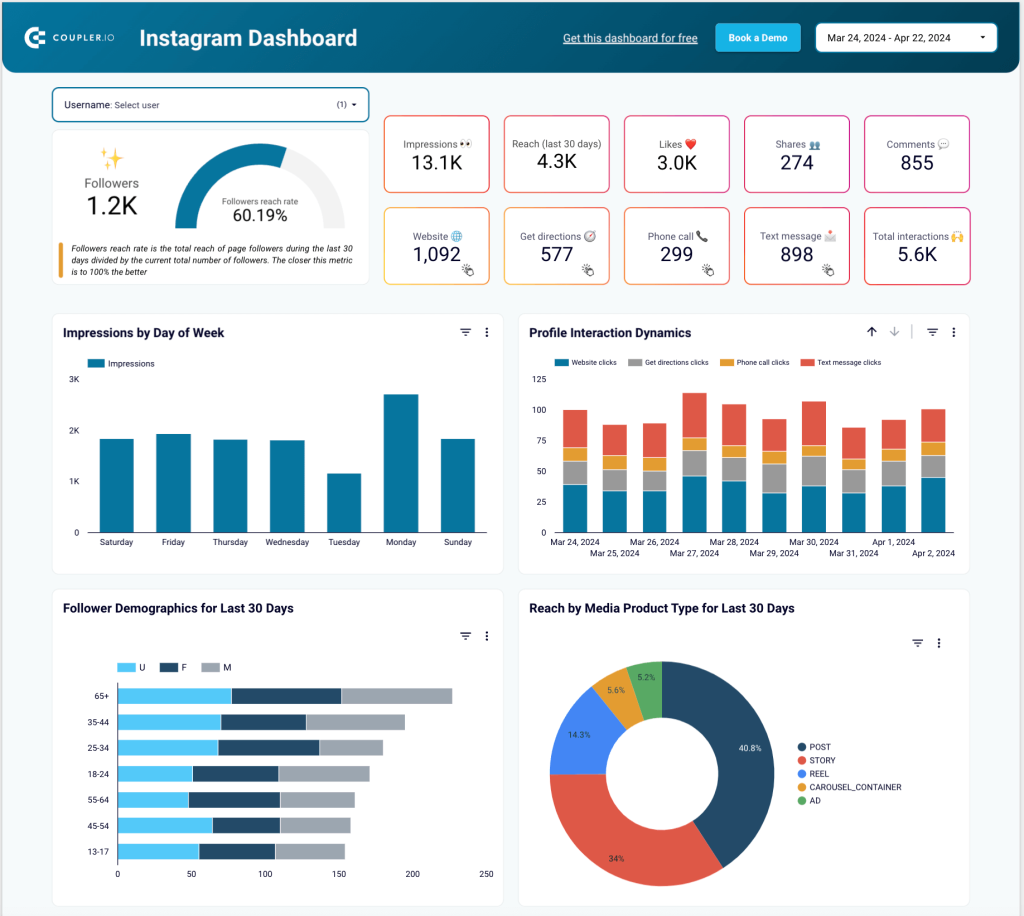
This Instagram business dashboard helps you understand your Instagram account’s overall engagement. This offers a more comprehensive view than Instagram Insights and the platform’s native analytics.
The dashboard is available as a free template equipped with the built-in Instagram connector by Coupler.io. This means you can start using it without any hassle right away.
- Why use this? Easily understand the types of media that perform best and drive growth.
- What does it help measure? Account growth over time and individual results generated by different posts.
- Data sources: Instagram business account.
- BI tool used: Looker Studio.
- Data connector: Coupler.io
Important metrics and KPIs
The Instagram business dashboard helps you track the following key metrics:
- Follower count and target audience demographic data.
- Impressions, reach, likes, shares, and comments for the last 30 days.
- Followers reach rate: total reach of page followers during the last 30 days divided by the current total number of followers.
- Total impressions and distribution based on days of the week.
- Reach by media type (post, story, reel, carousel, ad).
- Individual social media posts performance data.
2. TikTok analytics dashboard template
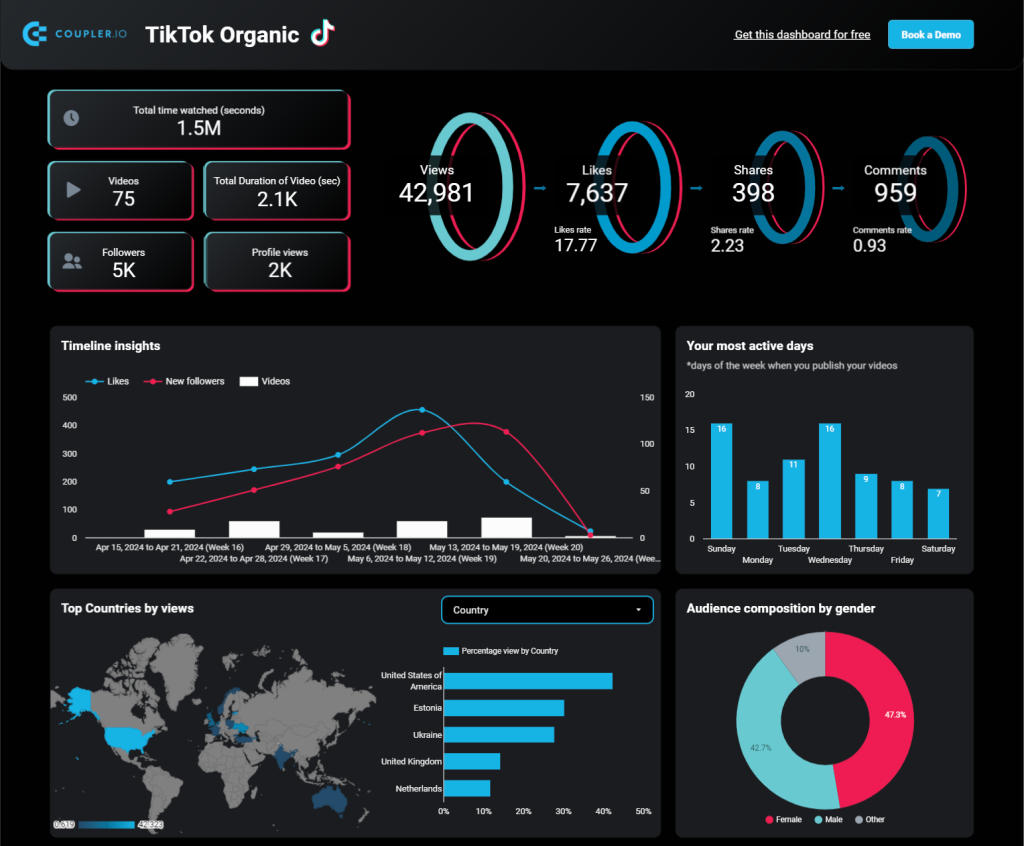
A TikTok analytics dashboard is a great tool for any social media team looking to improve their organic results on TikTok.
The dashboard is available as a free template equipped with the built-in TikTok connector by Coupler.io. This means you can start using it without any hassle right away.
- Why use this? To comprehensively view your TikTok performance metrics and understand which videos drive better results.
- What does it help measure? Your most active days and how these impact engagement and followers, audience demographics, and individual video performance.
- Data sources: TikTok organic data.
- BI tool used: Looker Studio.
- Data connector: Coupler.io
Important metrics and KPIs
The TikTok analytics dashboard helps you track the following key metrics:
- The total number of hours your videos were watched.
- Total number of videos and followers.
- Likes, Shares, and Comments rate to understand engagement.
- Top countries and audience composition by gender data.
- Individual engagement metrics for each video: duration, views, likes, shares, comments.
3. YouTube channel overview dashboard
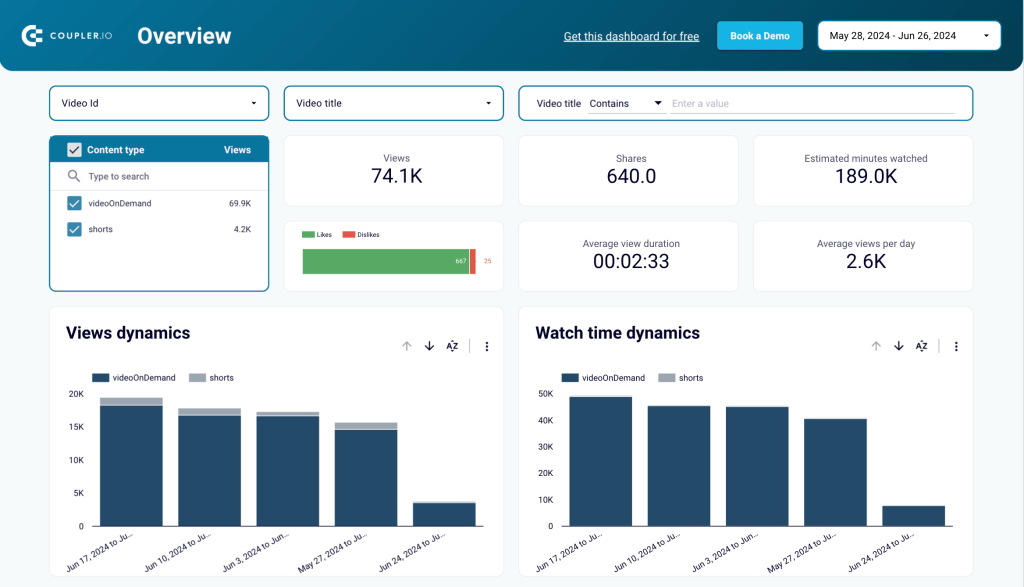
This YouTube analytics dashboard is a must-have tool for any business looking to enhance their online presence through video.
It’s a template by Coupler.io that you can use right away by connecting YouTube analytics with the help of the built-in connector.
- Why use this? Understand your YouTube channel growth over time and ensure your videos engage the right audience which will help increase your brand awareness and drive growth.
- What does it help measure? Video performance to get better insights into the main topics of interest and aggregated engagement data over the last 30 days.
- Data sources: YouTube
- BI tool used: Looker Studio
- Data connector: Coupler.io
Important metrics and KPIs
The YouTube channel overview dashboard helps you track the following key metrics:
- Views and average view duration of your videos for the past 30 days.
- Number of new subscribers in the last 30 days.
- Engagement metrics: likes, dislikes, comments, and shares.
- Audience demographics data: country, age, and gender of the people who view your videos.
- Individual engagement metrics for each video: views, average view duration, likes, dislikes, comments, shares, and new subscribers.
4. LinkedIn company page dashboard
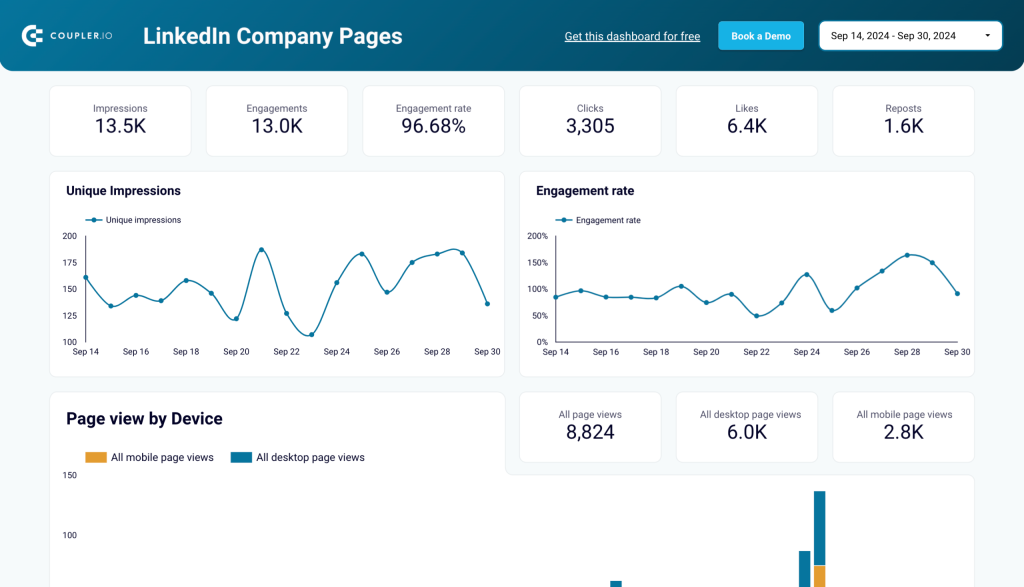
If you want to improve your brand presence on LinkedIn, the LinkedIn company page dashboard is perfect for you. It provides insights into content performance, audience behavior, and follower growth so that you can refine your strategies, target the right audience, and maximize engagement on LinkedIn.
It’s a template by Coupler.io which you can activate by connecting LinkedIn Company Pages through the built-in connector.
- Why use this? Monitor your company’s LinkedIn performance, understand audience behavior, and optimize your content to better engage professional audiences.
- What does it help measure? The dashboard tracks impressions, engagement rates, page views, and audience demographics to ensure content resonates with the right audience.
- Data sources: LinkedIn Company Pages
- BI tool used: Looker Studio
- Data connector: Coupler.io
Important metrics and KPIs
The LinkedIn Company Page Performance Dashboard helps you track the following key metrics:
- Total impressions and engagement rate over time to evaluate content visibility and audience interaction trends.
- Page views by device to optimize the user experience for desktop and mobile visitors.
- Visitor distribution by country to identify key markets and refine regional strategies.
- Posts performance metrics, including impressions, likes, reposts, comments, and engagement rate, to analyze content effectiveness and engagement.
- Follower insights, including growth trends, industry, seniority, job functions, and geographic location, to customize the content according to audience preferences and demographics.
5. Facebook page insights dashboard
This Facebook Page Insights dashboard is perfect for businesses and marketers who want to improve audience engagement and measure the impact of their content on Facebook.
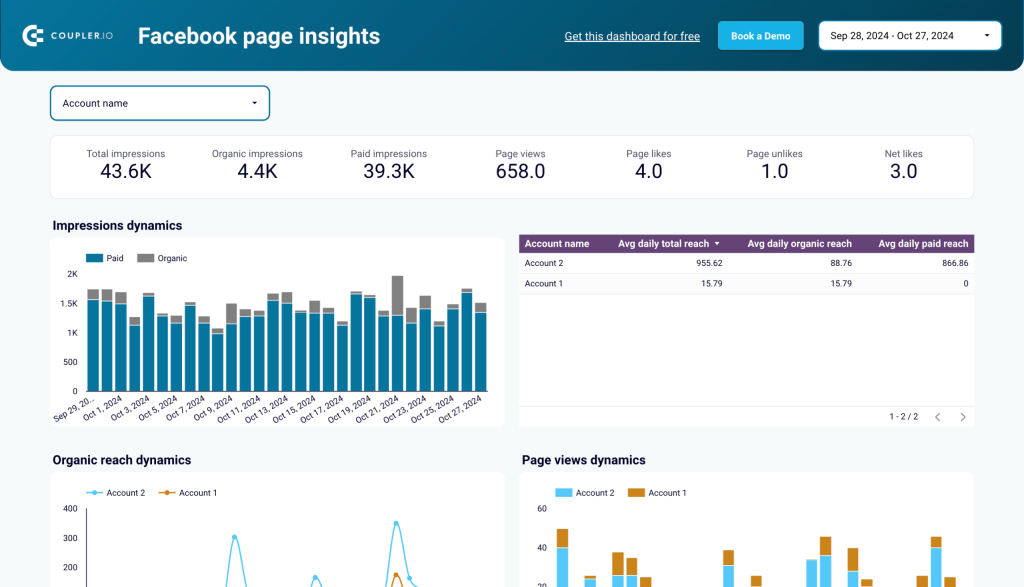
It’s a template by Coupler.io that you can use instantly by connecting Facebook Page Insights with the built-in connector.
- Why use this? You can track and compare the performance of multiple Facebook pages over time. This will help you understand the audience’s engagement trends and refine strategies to maximize reach and impact.
- What does it help measure? The dashboard provides insights into audience engagement, content performance, and geographic trends to help businesses align their strategies with audience preferences.
- Data sources: Facebook Page Insights
- BI tool used: Looker Studio
- Data connector: Coupler.io
Important metrics and KPIs
The Facebook Page Insights Dashboard helps you track the following key metrics:
- Total impressions, including paid and organic, to track content visibility and analyze reach effectiveness.
- Page views and likes to monitor audience interest and growth over time.
- Reach dynamics to measure the breadth of your audience and compare organic versus paid strategies.
- Post engagements, including likes, shares, and comments, to analyze user interaction and refine content strategies.
- Geographic distribution of page likes to understand audience location and optimize targeting efforts.
6. Social media performance dashboard
This social media performance dashboard provides a quick view of key metrics for the top four social media platforms.
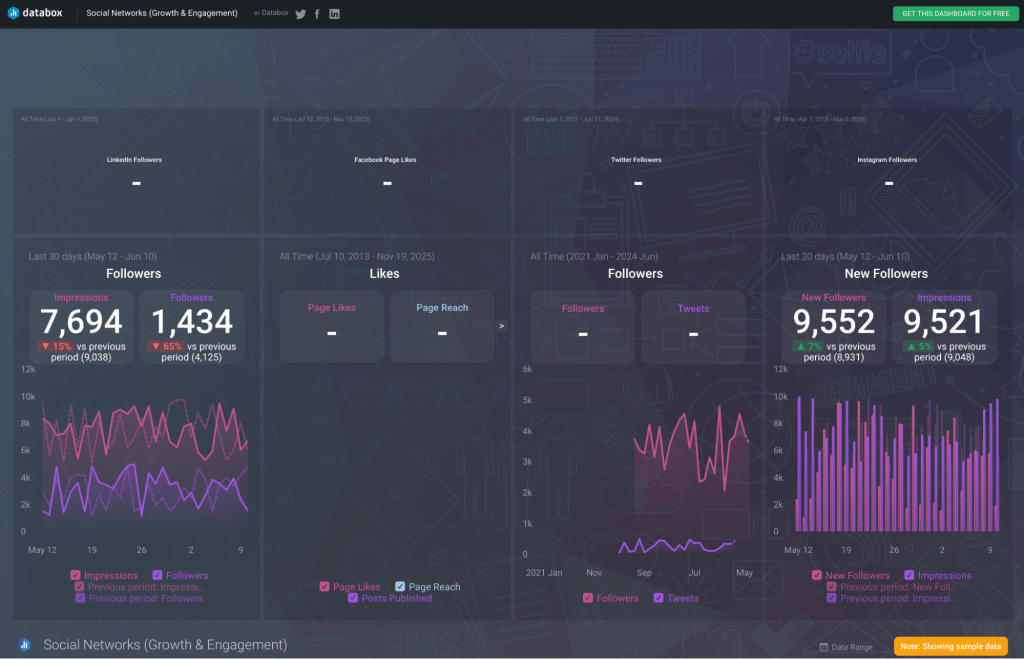
- Why use this? Analyze side-by-side engagement on your business’s LinkedIn, Facebook, X (Twitter), and Instagram accounts.
- What does it help measure? Keep track of follower growth and impressions on each social channel, month over month, to understand which is performing best.
- Data sources: Facebook Pages, Instagram Business, LinkedIn Company Pages, X (Twitter).
- BI tool used: Databox.
Important metrics
The Social Media Performance dashboard helps you track:
- All-time LinkedIn followers, Facebook page likes, Twitter followers, and Instagram followers.
- LinkedIn impressions and followers fluctuations and specific numbers for the past 30 days.
- Facebook page likes and reach evolution.
- X (Twitter) followers and tweets evolution.
- Instagram impressions and new followers for the past 30 days.
Every social media platform comes with its pre-defined analytics reports that sometimes don’t give you a granular view of your data. You either face limitations in building custom reports or get lost in the cluttered UI trying to understand your conversion rates. The same applies to the analytics sections of your social media management tool. That’s because these tools were built to facilitate publishing and managing different social media accounts, not to track performance.
In comparison, a social media marketing dashboard gives you the flexibility to view your data. You can analyze your business’s most important social media metrics using multiple visualization charts and table types. This gives you an overall view of your data from multiple data sources and makes it easier to understand the impact of your social media campaigns across different social networks.
You might need one or multiple social media reporting dashboards, depending on your business. A social media analytics dashboard focusing on one channel will provide more in-depth insights into how your main channel is driving conversions.
On the other hand, multi-channel social media dashboards can help you spot insights into which channel is performing best. This will inform your budget allocation based on various metrics across multiple social media accounts.
Must have features of a good digital marketing reporting dashboard
To inform your marketing efforts, a good reporting dashboard should give you enough functionality to:
- Make and share reports: Create visually appealing and comprehensive reports using data from multiple data sources and easily share them with your team.
- Automated data refresh: Ability to automatically connect and pull fresh data from your data sources so your reports display real-time data.
- Integrations with multiple channels: Google Analytics, Google Search Console, Social Media Channels, Google Ads, etc.
- Multiple visualization widgets: Bar charts, line charts, pivot tables, pie chart graphs, combo charts, time series, etc.
- Dashboard templates: To make it easy to get started.
We’ve talked about the importance of using social media dashboards for reporting and making informed decisions. But should you build one from scratch or use a template?
The short answer is it depends.
If you’re a small business, a template is a quick way to start tracking your social media presence and setting benchmarks for your growth goals. It helps you save time deciding which metrics to track and how best to visualize them.
With the multitude of social media templates available, you only need to choose an analytics tool and set up your tracking using a predefined template offered by that tool. We’ll cover existing tools shortly.
In comparison, experienced marketing teams might find some basic or standard templates and miss some specific insights they want to track. This doesn’t mean social media dashboard templates are not a good fit.
You can still start from a template and tweak it to better meet your needs. Remove unnecessary charts or add more dimensions or metrics. Using a dashboard template will be more efficient than starting from scratch.
To build a social media dashboard, you will need a BI tool first. Here’s a list of the most popular ones:
- Looker Studio: Google’s free and integrated data visualization tool that allows you to easily build customizable reports using several chart types. The tool offers ready-to-use templates to help you get started, and its user-friendly design is perfect for both beginners and advanced users.
- Power BI: Microsoft’s enterprise-level data visualization tool offering advanced data security. This tool is perfect for larger teams that have extensive data sets and need integrations with multiple apps.
- Tableau: A popular tool among data analysts as well as non-technical users, this data visualization tool offers an intuitive interface and multiple data connectors.
- Qlik: Cloud-based BI tool that uses associative analytics. Great for teams needing deeper insights as this tool offers AI-powered analytics, and predictive analytics, and comes with easy-to-set-up integrations.
All these tools offer native connectors to integrate your data from top social media platforms.
Still, automating your data load from your social media accounts will give you fresh data on a schedule and the flexibility to manipulate and transform your data before visualizing it with a BI tool.
Coupler.io is a solution that helps you easily connect your preferred BI tool with your social media accounts and automate your data load. You can blend data from multiple social media accounts and filter and organize your records to build multi-channel dashboards.
Connect your social media data sources to spreadsheets, data warehouses, and BI tools with Coupler.io
Get started for freeWe’ve covered the importance of using dashboards to track social media performance and the best templates available to get started.
Getting started is easy! Simply pick a template that best answers your needs and connect your data. If you’re looking for more examples, browse Coupler.io’s free dashboard reporting templates gallery. Discover and choose from templates that track organic and paid ad campaign metrics across different social media platforms.


