When conducting social media marketing activities, it is essential to understand whether they align with your goals. This can be achieved by analyzing your performance using data-driven social media reports.
Below, you’ll learn about important metrics, solutions to common challenges, and free report templates. Additionally, you’ll find some useful social media reporting tools.
Creating a social media report involves more than just entering data into a spreadsheet. It’s a complex process that presents a variety of challenges. Let’s examine these challenges and discuss practical solutions to overcome them.
Data accuracy and reliability
Social media reporting requires precise data, which you can extract from social media platforms and website tracking tools like GA4.
One way to do this is manually through native export features, but this option only works for one-time transfers and small datasets. If you need to create reports regularly or deal with large data volumes, the process becomes too time-consuming and prone to errors.
You can also create a custom API integration. However, this method is only suitable if you have coding skills or access to developers who can assist you.
Alternatively, you can use a SaaS connector like Coupler.io, which allows you to prepare insightful custom reports. It offers automated integrations with various social media platforms and Google Analytics 4. So, it’s possible to export accurate data, create reports on the go, and load them into spreadsheets or BI tools in minutes.
Marketing attribution is the process of identifying which digital marketing activities result in conversions. It relies on an attribution model, a framework for assigning value to different customer touchpoints. Various models are available, so you need to choose the appropriate one to accurately attribute your business outcomes to social media activities.
One common choice is the last-click attribution model. This gives full credit to the last interaction before a conversion. For example, if a customer buys after clicking a newsletter, that newsletter receives all the credit. However, this model overlooks earlier interactions, such as those on social networks, that may have impacted the decision.
You could also consider an alternative option. For instance, GA4 offers a data-driven model that uses machine learning to analyze each click’s contribution. It compares actual outcomes with potential scenarios to discover which touchpoints drive conversions. This way, credit goes to the interactions most likely to lead to the desired outcomes.
Another issue is the mismatch in attribution windows across platforms. The attribution, or lookback, window defines how long a platform tracks user activity to associate it with conversions. For Meta Ads, this is either 1 or 7 days. In contrast, GA4 offers 30, 60, or 90-day windows. This means if a user clicks a Facebook ad and purchases 8 days later, Meta Ads won’t assign credit to that interaction, while Google Analytics will. You must understand these differences to avoid discrepancies in attribution.
Keeping up with platform changes
Platform changes can impact your social media reporting workflow. For example, if you extract reports natively, updates to ad managers’ interfaces can shift the way you pull your data, so you must adapt. If you rely on custom integrations, API updates may disrupt your ability to export social media data. In that case, you have to make adjustments to fix your integration.
As a result, you should track developments across the social platforms you use and keep agile so you can respond quickly to any changes.
Information overload and analysis paralysis
In social media performance reporting, the overwhelming amount of insights can lead to analysis paralysis, making you overthink due to a lack of focus.
To navigate this challenge, prioritize overall campaign performance and metrics dynamics. While it’s helpful to analyze specifics, such as which video format gets the most views at a given moment, you should maintain a broad perspective. Additionally, focus on your key performance indicators instead of trying to absorb everything.
Cross-platform data integration
If you’re active on Facebook, Instagram, LinkedIn, and YouTube, you must report on each of them. However, doing this separately using built-in tools isn’t time-efficient. You have to jump between ads managers, export reports from them to share, and so on. Instead, you can use a ready-to-go template to have all your data in one place for social media automated reporting.
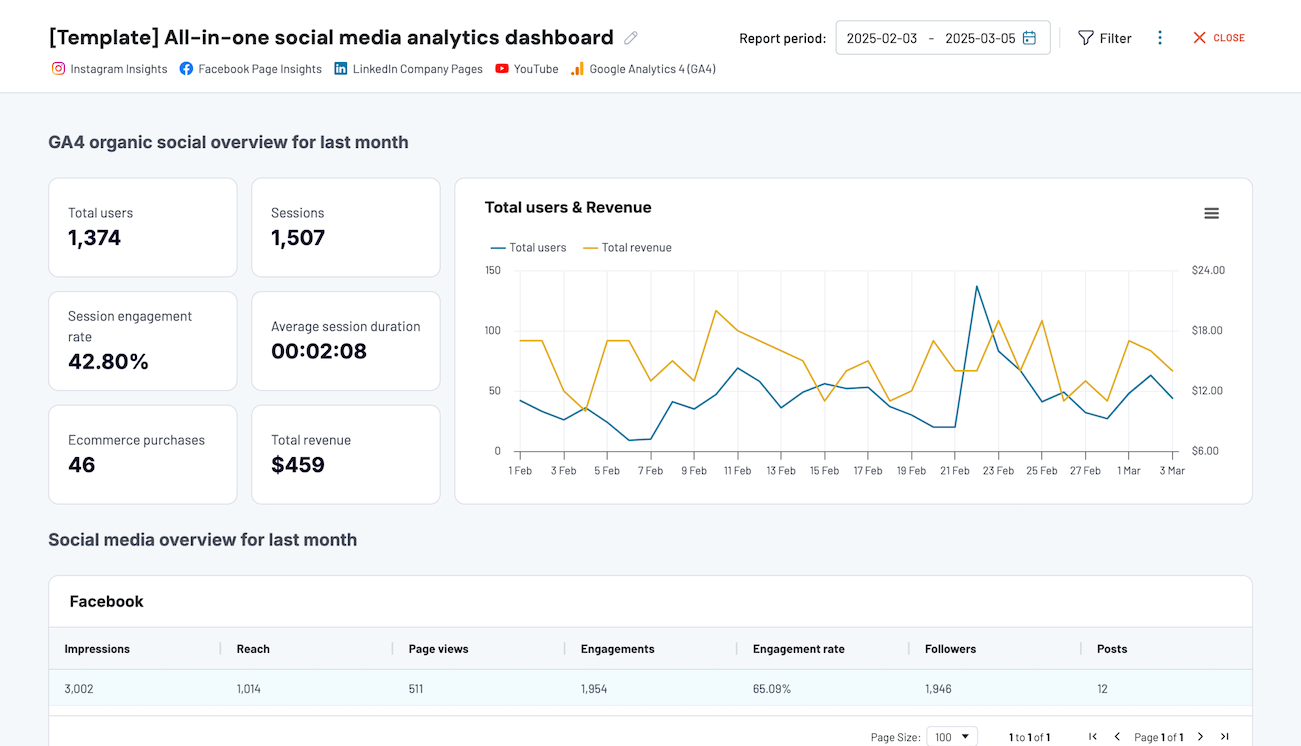
For example, Coupler.io’s all-in-one social media reporting dashboard integrates data from the mentioned channels and GA4. This template is designed in Looker Studio and features a built-in connector by Coupler.io. So, you can automatically export data from your platforms and send it to the dashboard on the go.
All-in-one social media analytics dashboard
 Preview dashboard
All-in-one social media analytics dashboard
Preview dashboardYour report should be based on critical metrics to determine the impact of your social media marketing efforts. Consider the following list of metrics, which you can apply fully or selectively, depending on your reporting goals:
- Reach indicates how many people see your content on social media platforms. It’s possible to monitor both the average reach and that of individual posts, stories, or videos. You can also reveal how much comes from followers vs. non-followers to assess visibility beyond the immediate audience.
- Impressions reflect the number of times people view your social media content. It can exceed the reach if one person generates multiple impressions by looking at your content more than once.
- Likes demonstrate how well your content resonates with the audience. A high like count suggests positive engagement.
- Comments offer direct user feedback and qualitative insights into how people feel about your content.
- Shares signify your content is valuable enough for users to spread within their networks.
- Website traffic shows the number of users who come from social media to your website. It reflects how effectively your content brings potential customers to your brand.
- Key events or conversions refer to specific actions, such as signups or purchases. This metric lets you know how well your social media activities lead to desired outcomes.
- Revenue represents the income generated from your social media efforts. It enables you to evaluate the direct financial impact of your content.
Using Coupler.io’s free social media report templates means you won’t have to create anything from scratch. Simply link your platforms using Coupler.io’s connector and transform your data into visual insights.
Social media overview dashboard
This dashboard provides a performance overview of Facebook, Instagram, LinkedIn, and YouTube. It allows you to analyze your cross-platform social media efforts within a single interface.
All-in-one social media analytics dashboard
Preview dashboard
All-in-one social media analytics dashboard
Preview dashboardWhat you can get to know from this dashboard template:
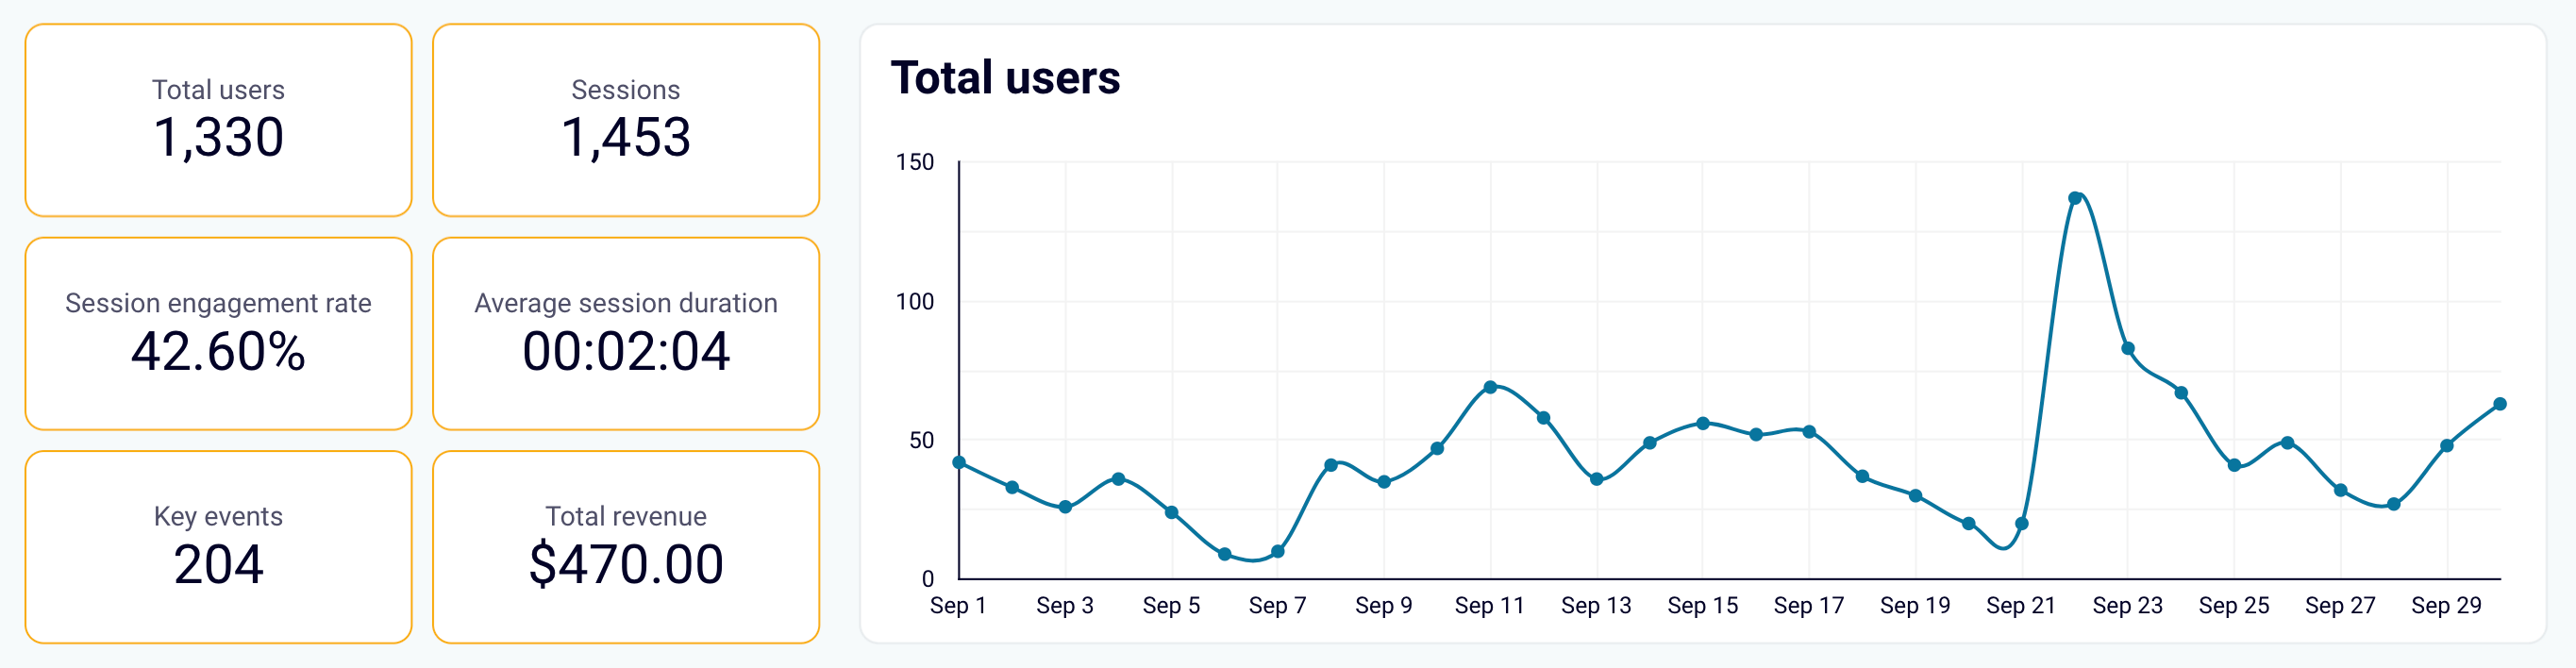
- Traffic insights: See how your content drives website traffic and conversions based on integrated data from GA4.
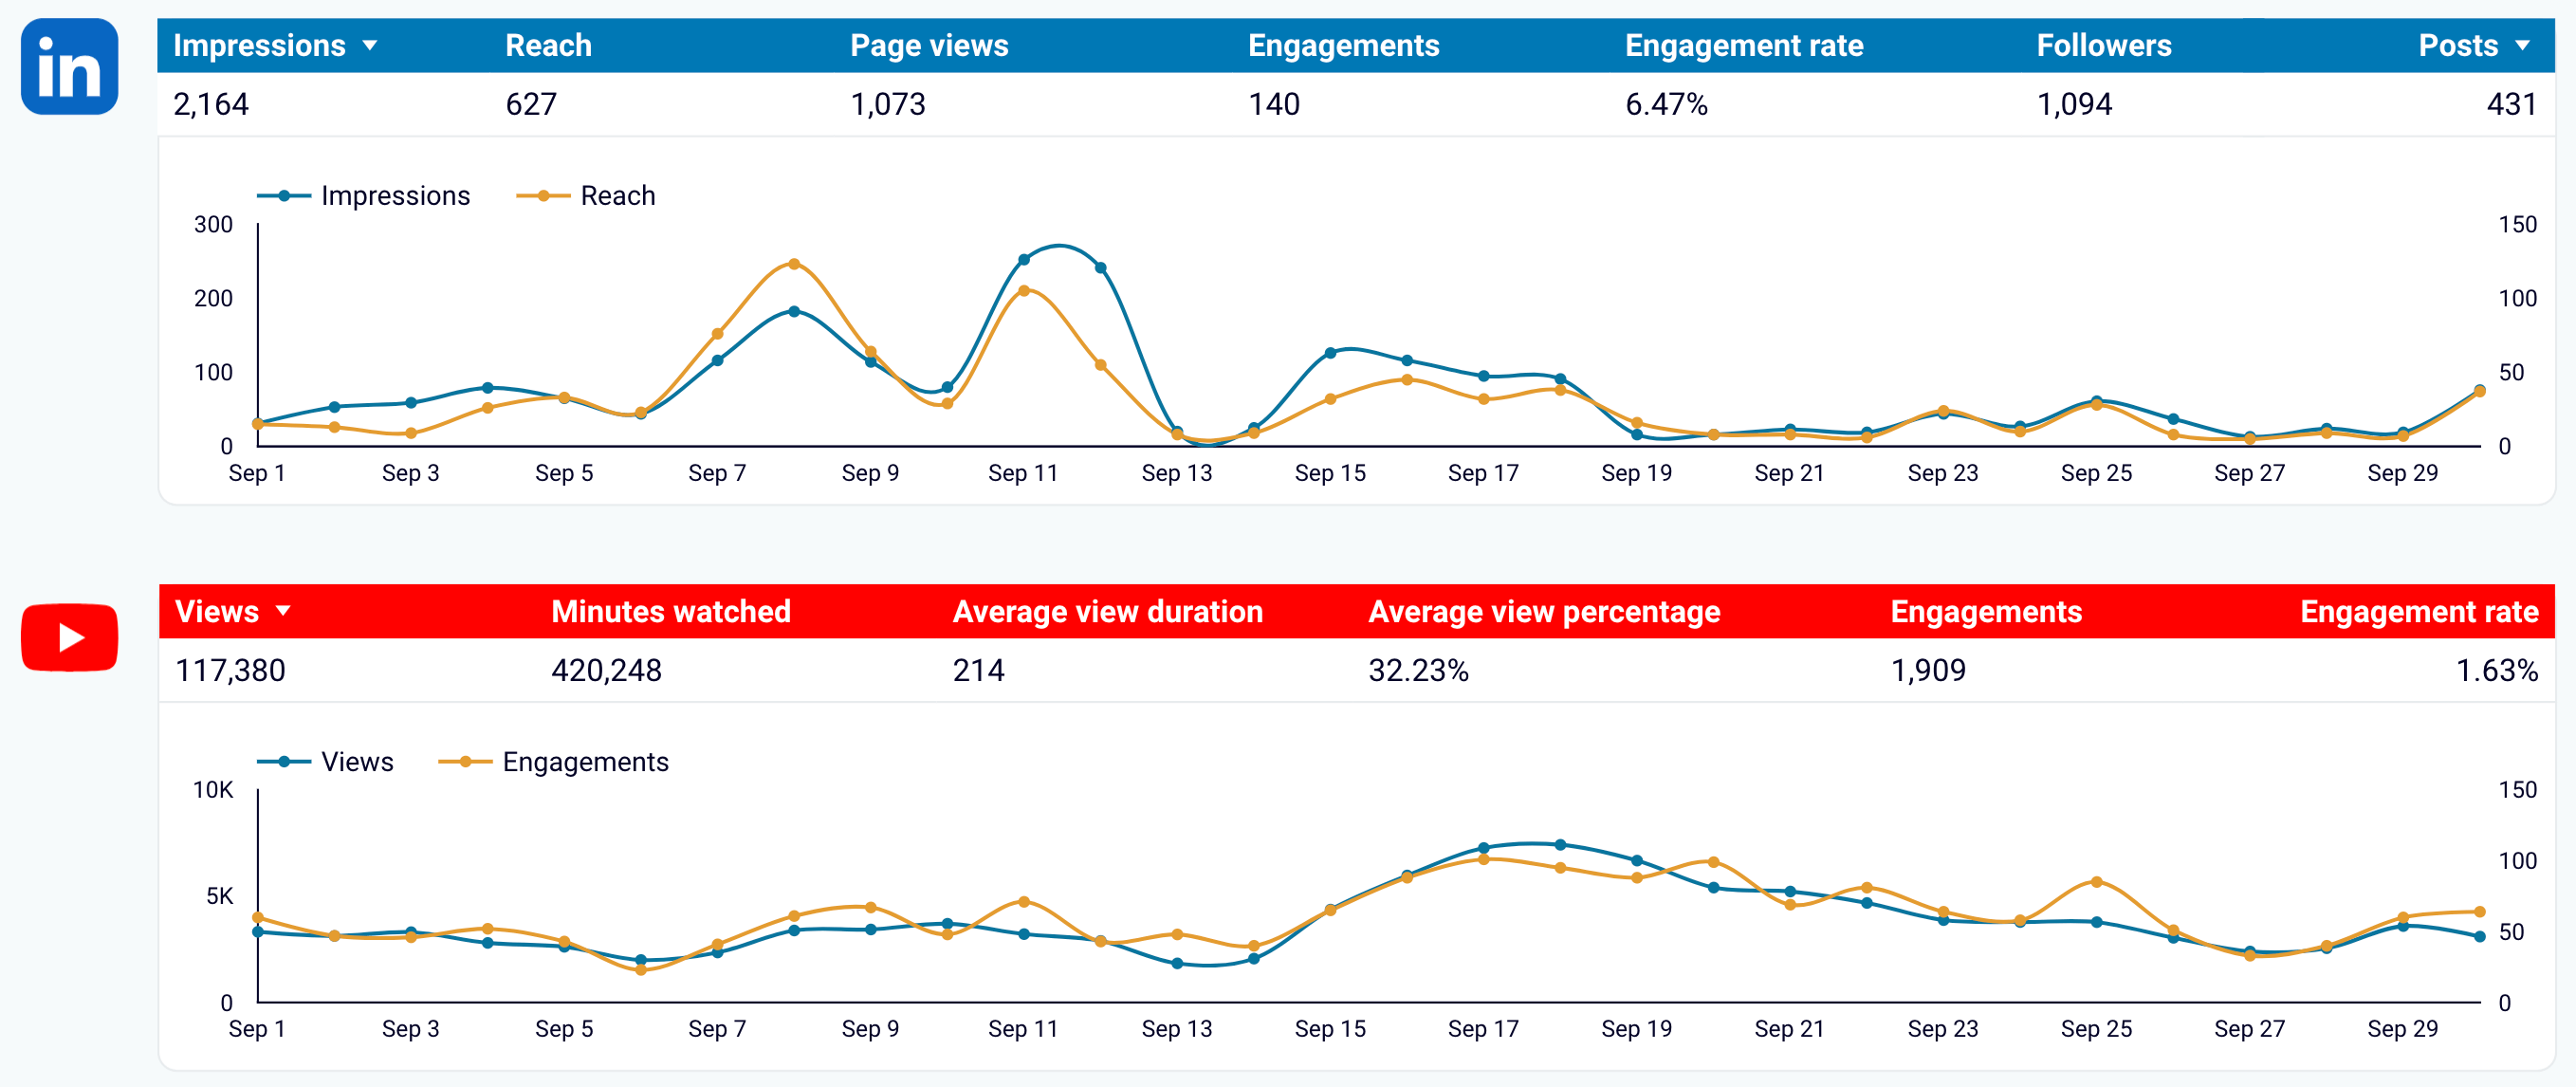
- Performance breakdown: Dive into performance metrics for each social media platform. You can also explore last month’s dynamics across platforms to identify performance trends.
The dashboard is available in the Coupler.io interface and as a Looker Studio template.
To use the template, follow the straightforward instructions in the Readme tab. It only takes a few minutes to sign up to Coupler.io, connect your social media accounts, and load your data to the dashboard.
Facebook page insights dashboard
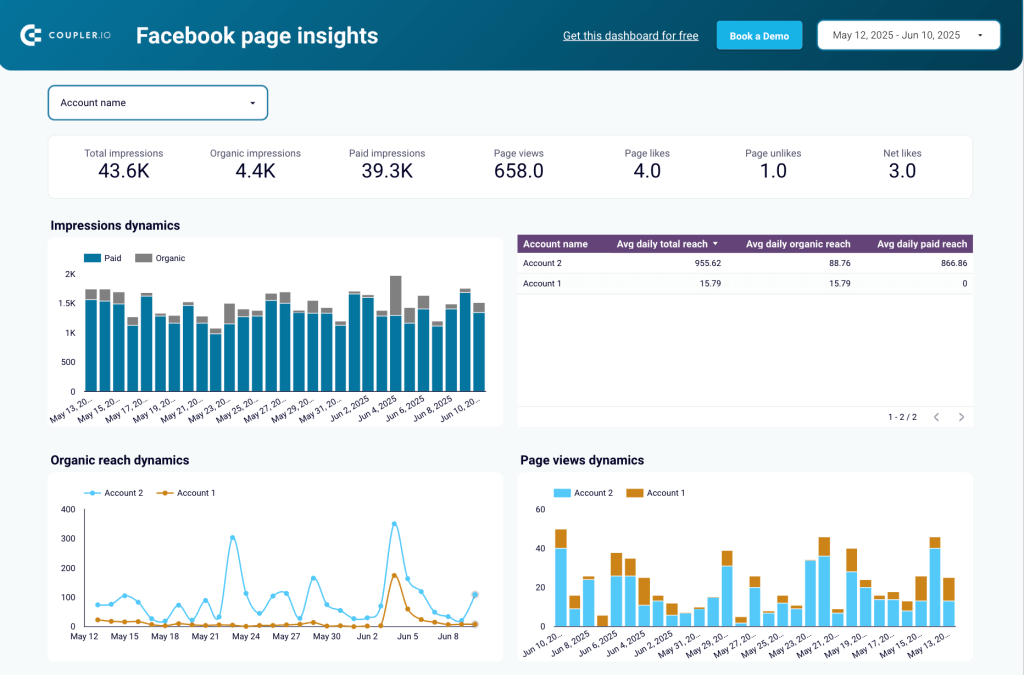
This dashboard has been designed to let you track your Facebook business page performance. Business owners and marketers alike can benefit from it to gain insights that will help them improve engagement, understand content impact, and work on refining social media strategies.
This dashboard is a great way to learn about the following:
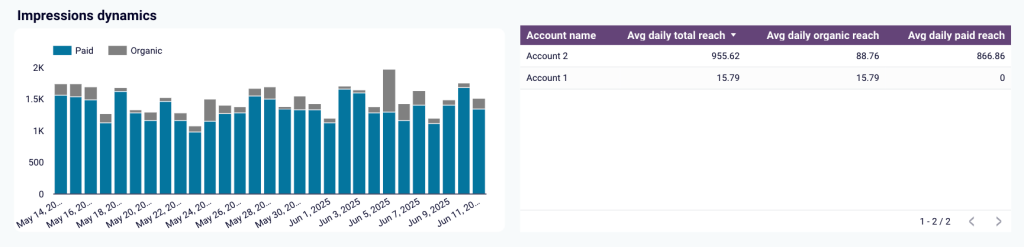
- The daily organic and paid performance of your Facebook profiles in terms of impressions and average reach. This helps you track the visibility and impact of your content on a regular basis.
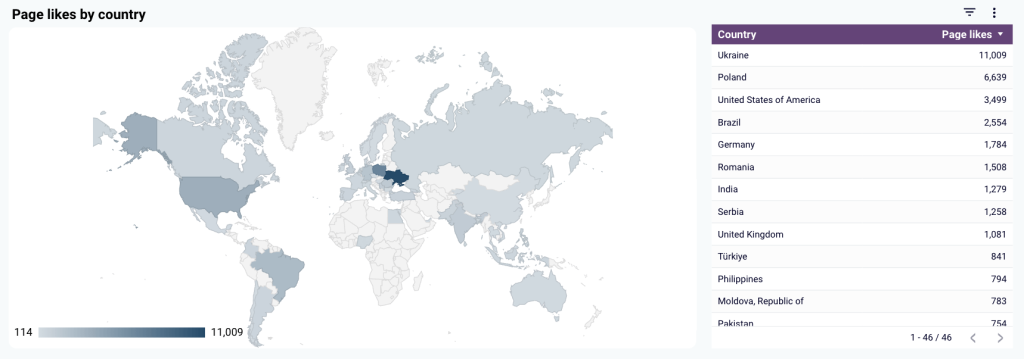
- If you target multiple geographies, you’ll find the page likes map really helpful. With it, you can easily see which countries account for the most users that interact with your content. Also, you can use the map to make decisions about promoting your business in specific geographies to build a larger follower-base there.
The dashboard is available for Looker Studio, a popular business intelligence (BI) tool. It features the Coupler.io connector to reliably transfer your Facebook data to the destination. Click the button below to start configuring the dashboard and be sure to follow easy setup steps on the Readme tab.
LinkedIn Company Pages dashboard
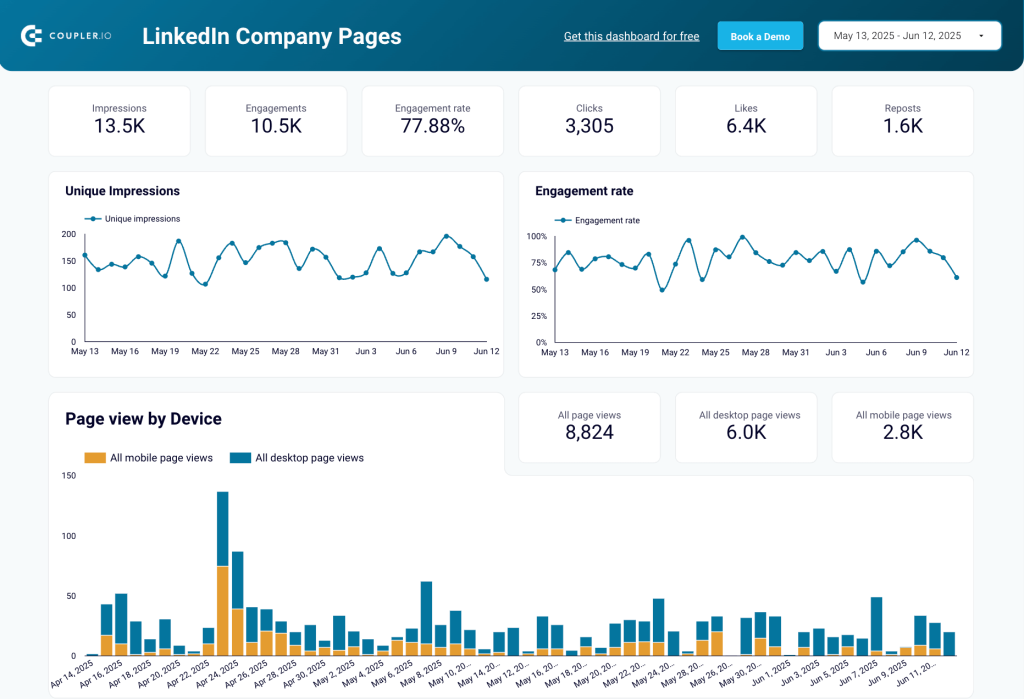
The LinkedIn Company Pages dashboard is your one-stop-shop solution to track the performance of your company LinkedIn profile. With the dashboard, you get all the most important metrics in one place to monitor content relevance to users, understand users’ behaviors, track follower base growth, and work on targeting.
This dashboard is your go-to resource to:
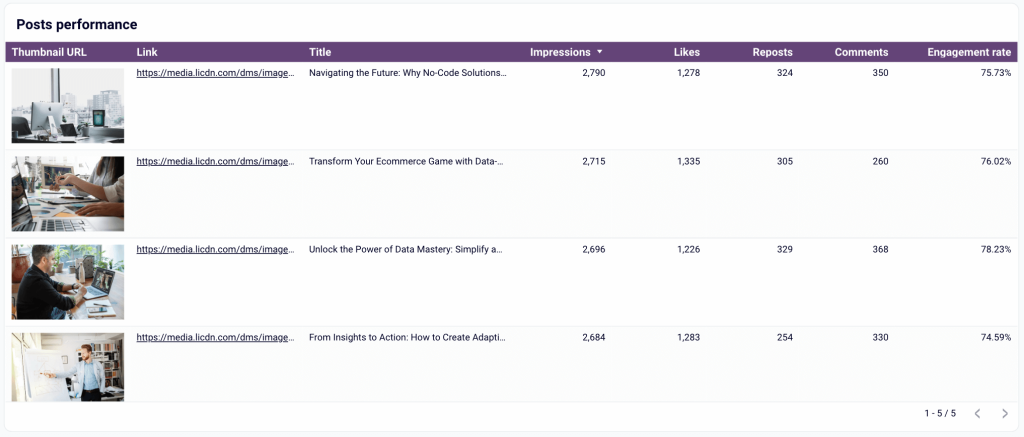
- Drill down to the performance stats for each post that you publish in the company profile to see exact numbers for impressions, likes, reposts, comments, and engagement rate, plus identify the content that works best for your followers.
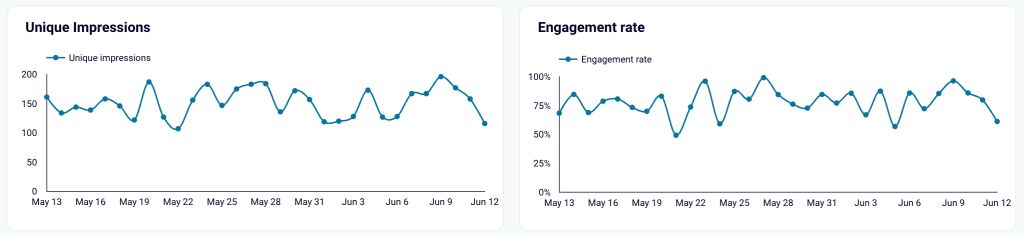
- Track unique impressions and engagement rate over time to see if your marketing and communication efforts are effective for engaging LinkedIn audience.
After configuring the Coupler.io connector, you can start using this template in Looker Studio for free. For easy setup steps, head over to the Readme tab of the dashboard.
TikTok organic dashboard
The TikTok organic dashboard in Looker Studio provides details of your TikTok audience, engagement dynamics, and performance trends.
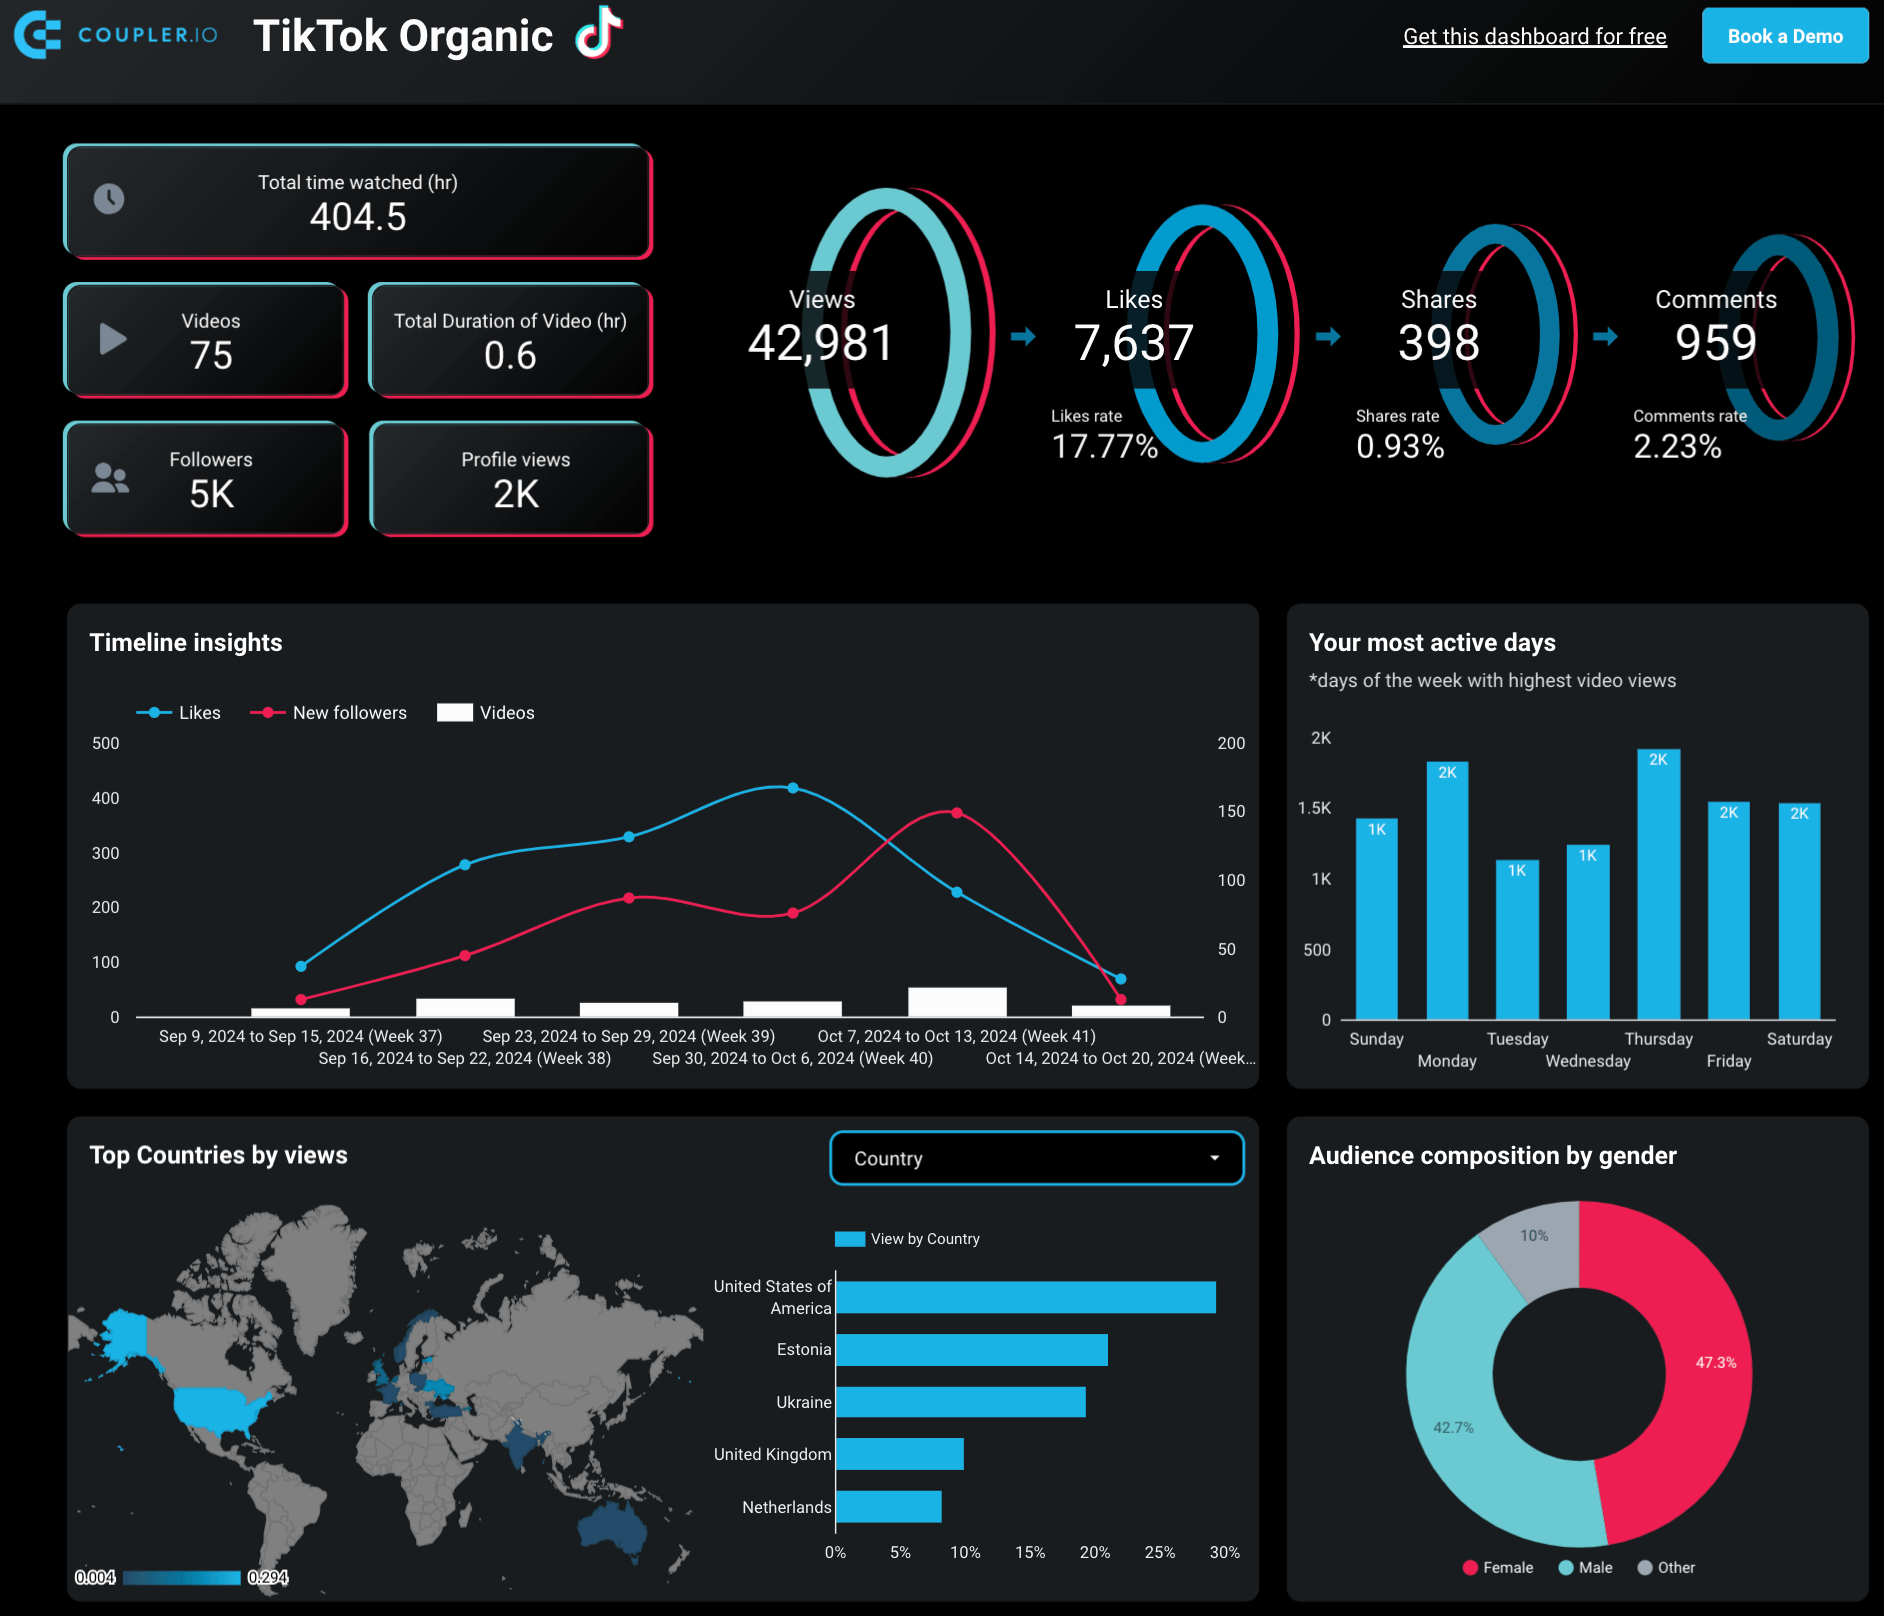
Use this dashboard template to derive the following valuable insights:
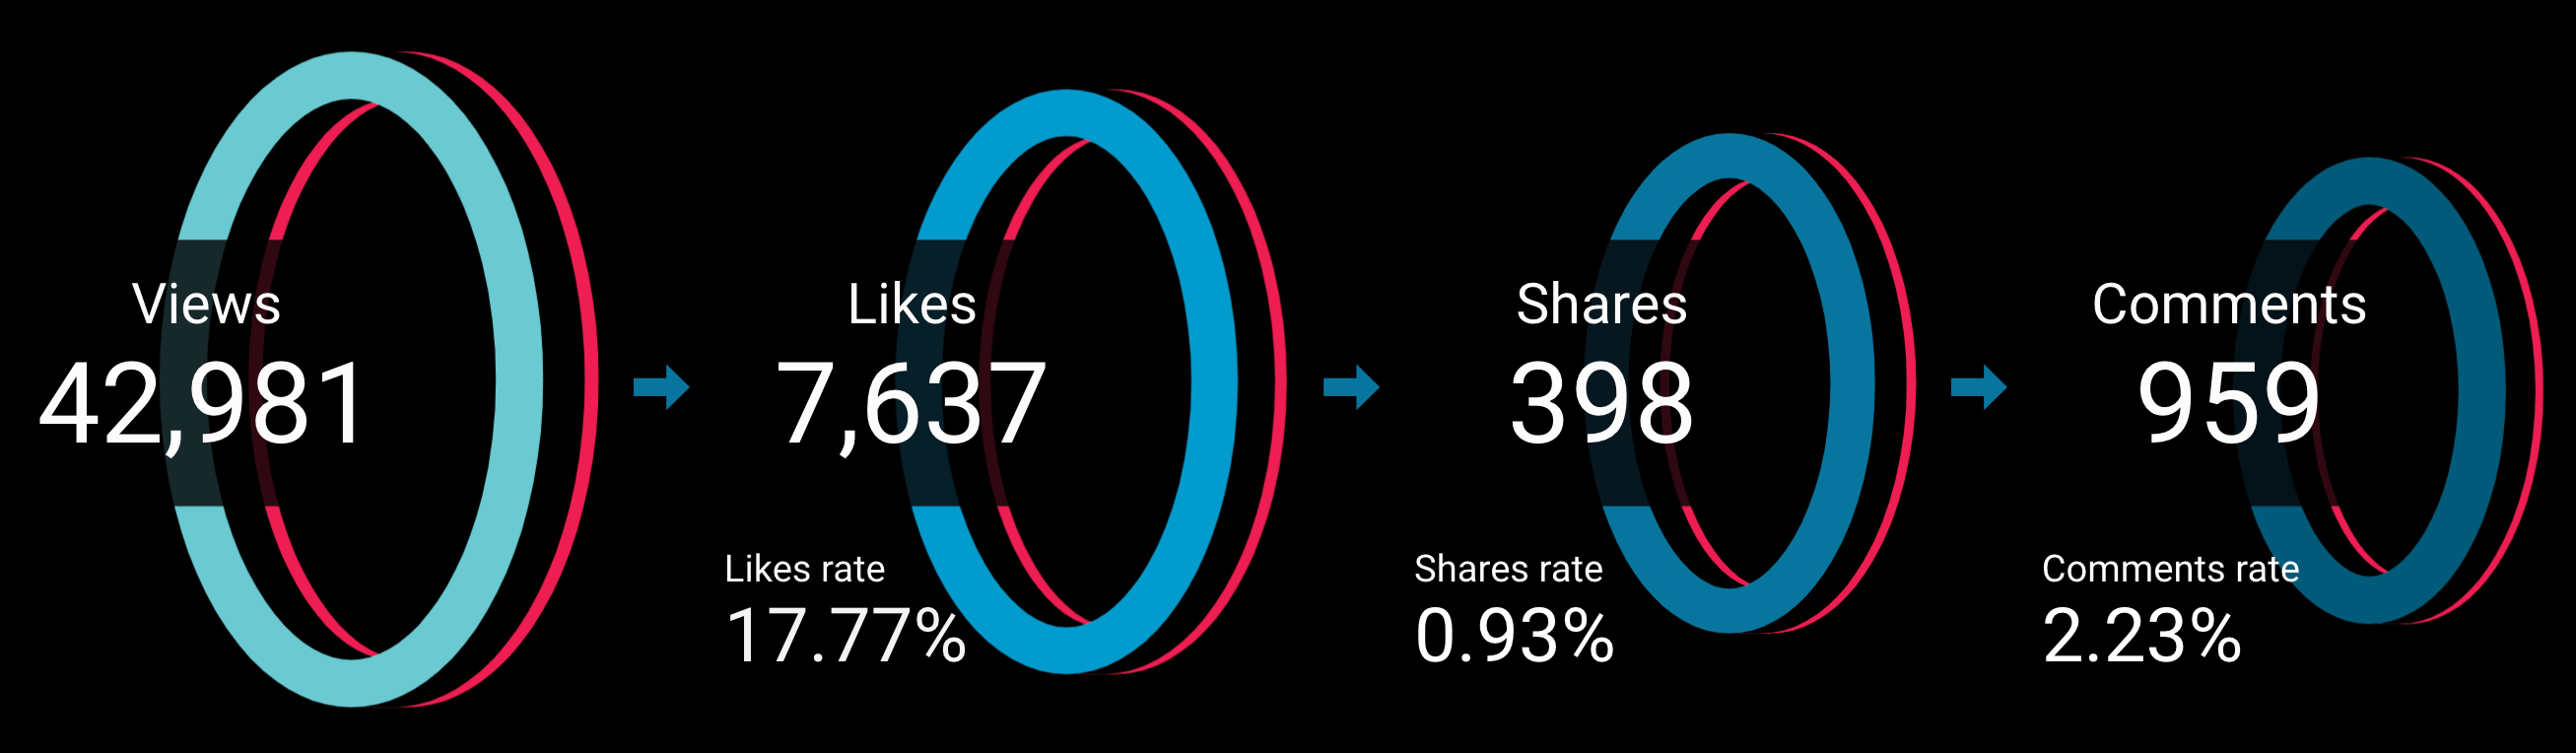
- Engagement funnel: Track customer engagement flow with metrics: Views ? Likes ? Shares ? Comments.
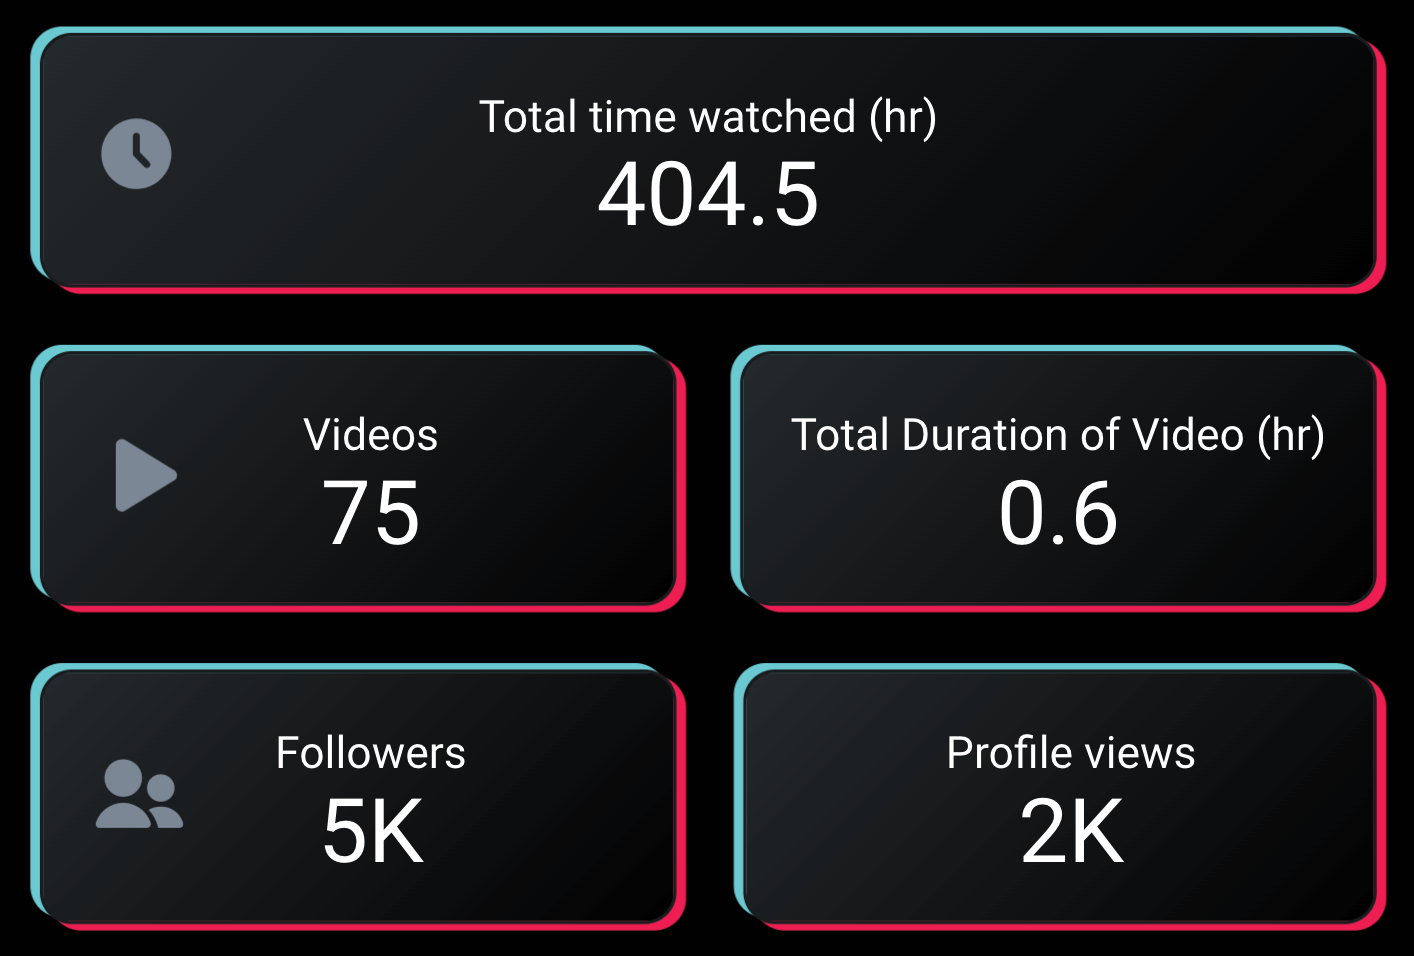
- Content appeal: Measure how many hours viewers spend watching your content. You can also see the total number of videos posted, follower count, profile views, and the total duration of all videos.
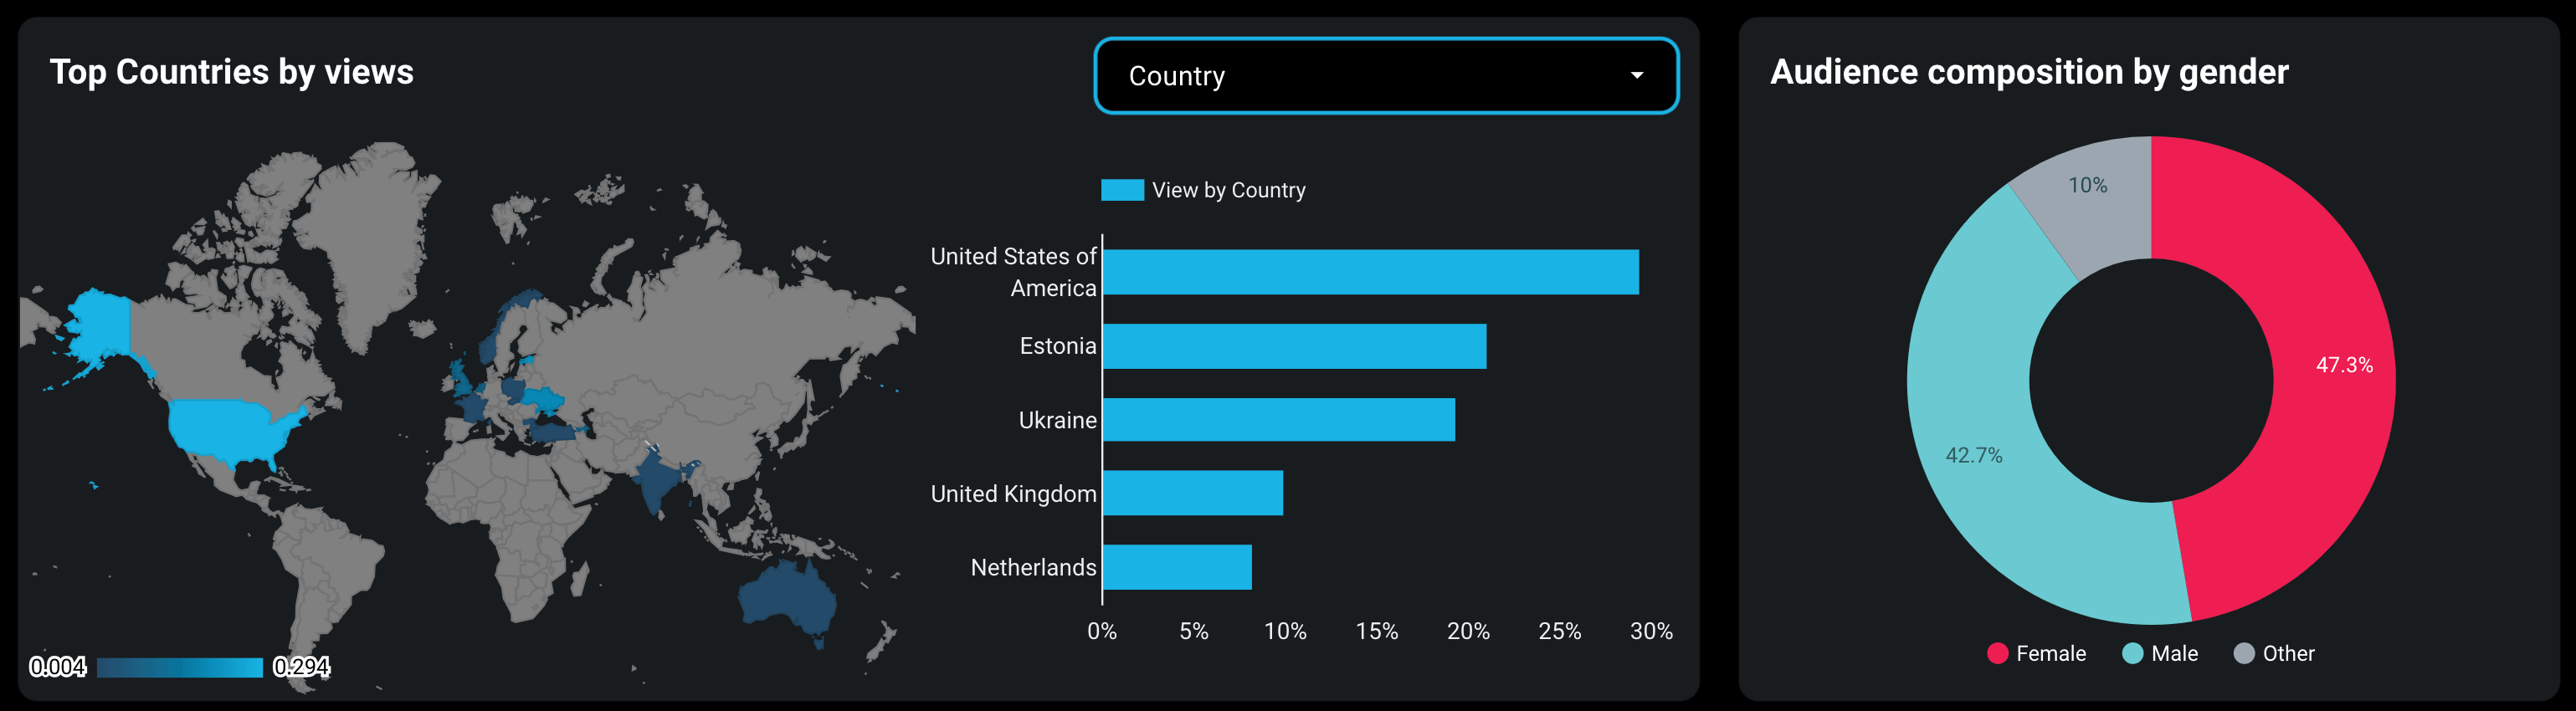
- Audience insights: Learn how the target audience engages with your videos in different regions. You can also explore audience composition by gender to better customize your content.
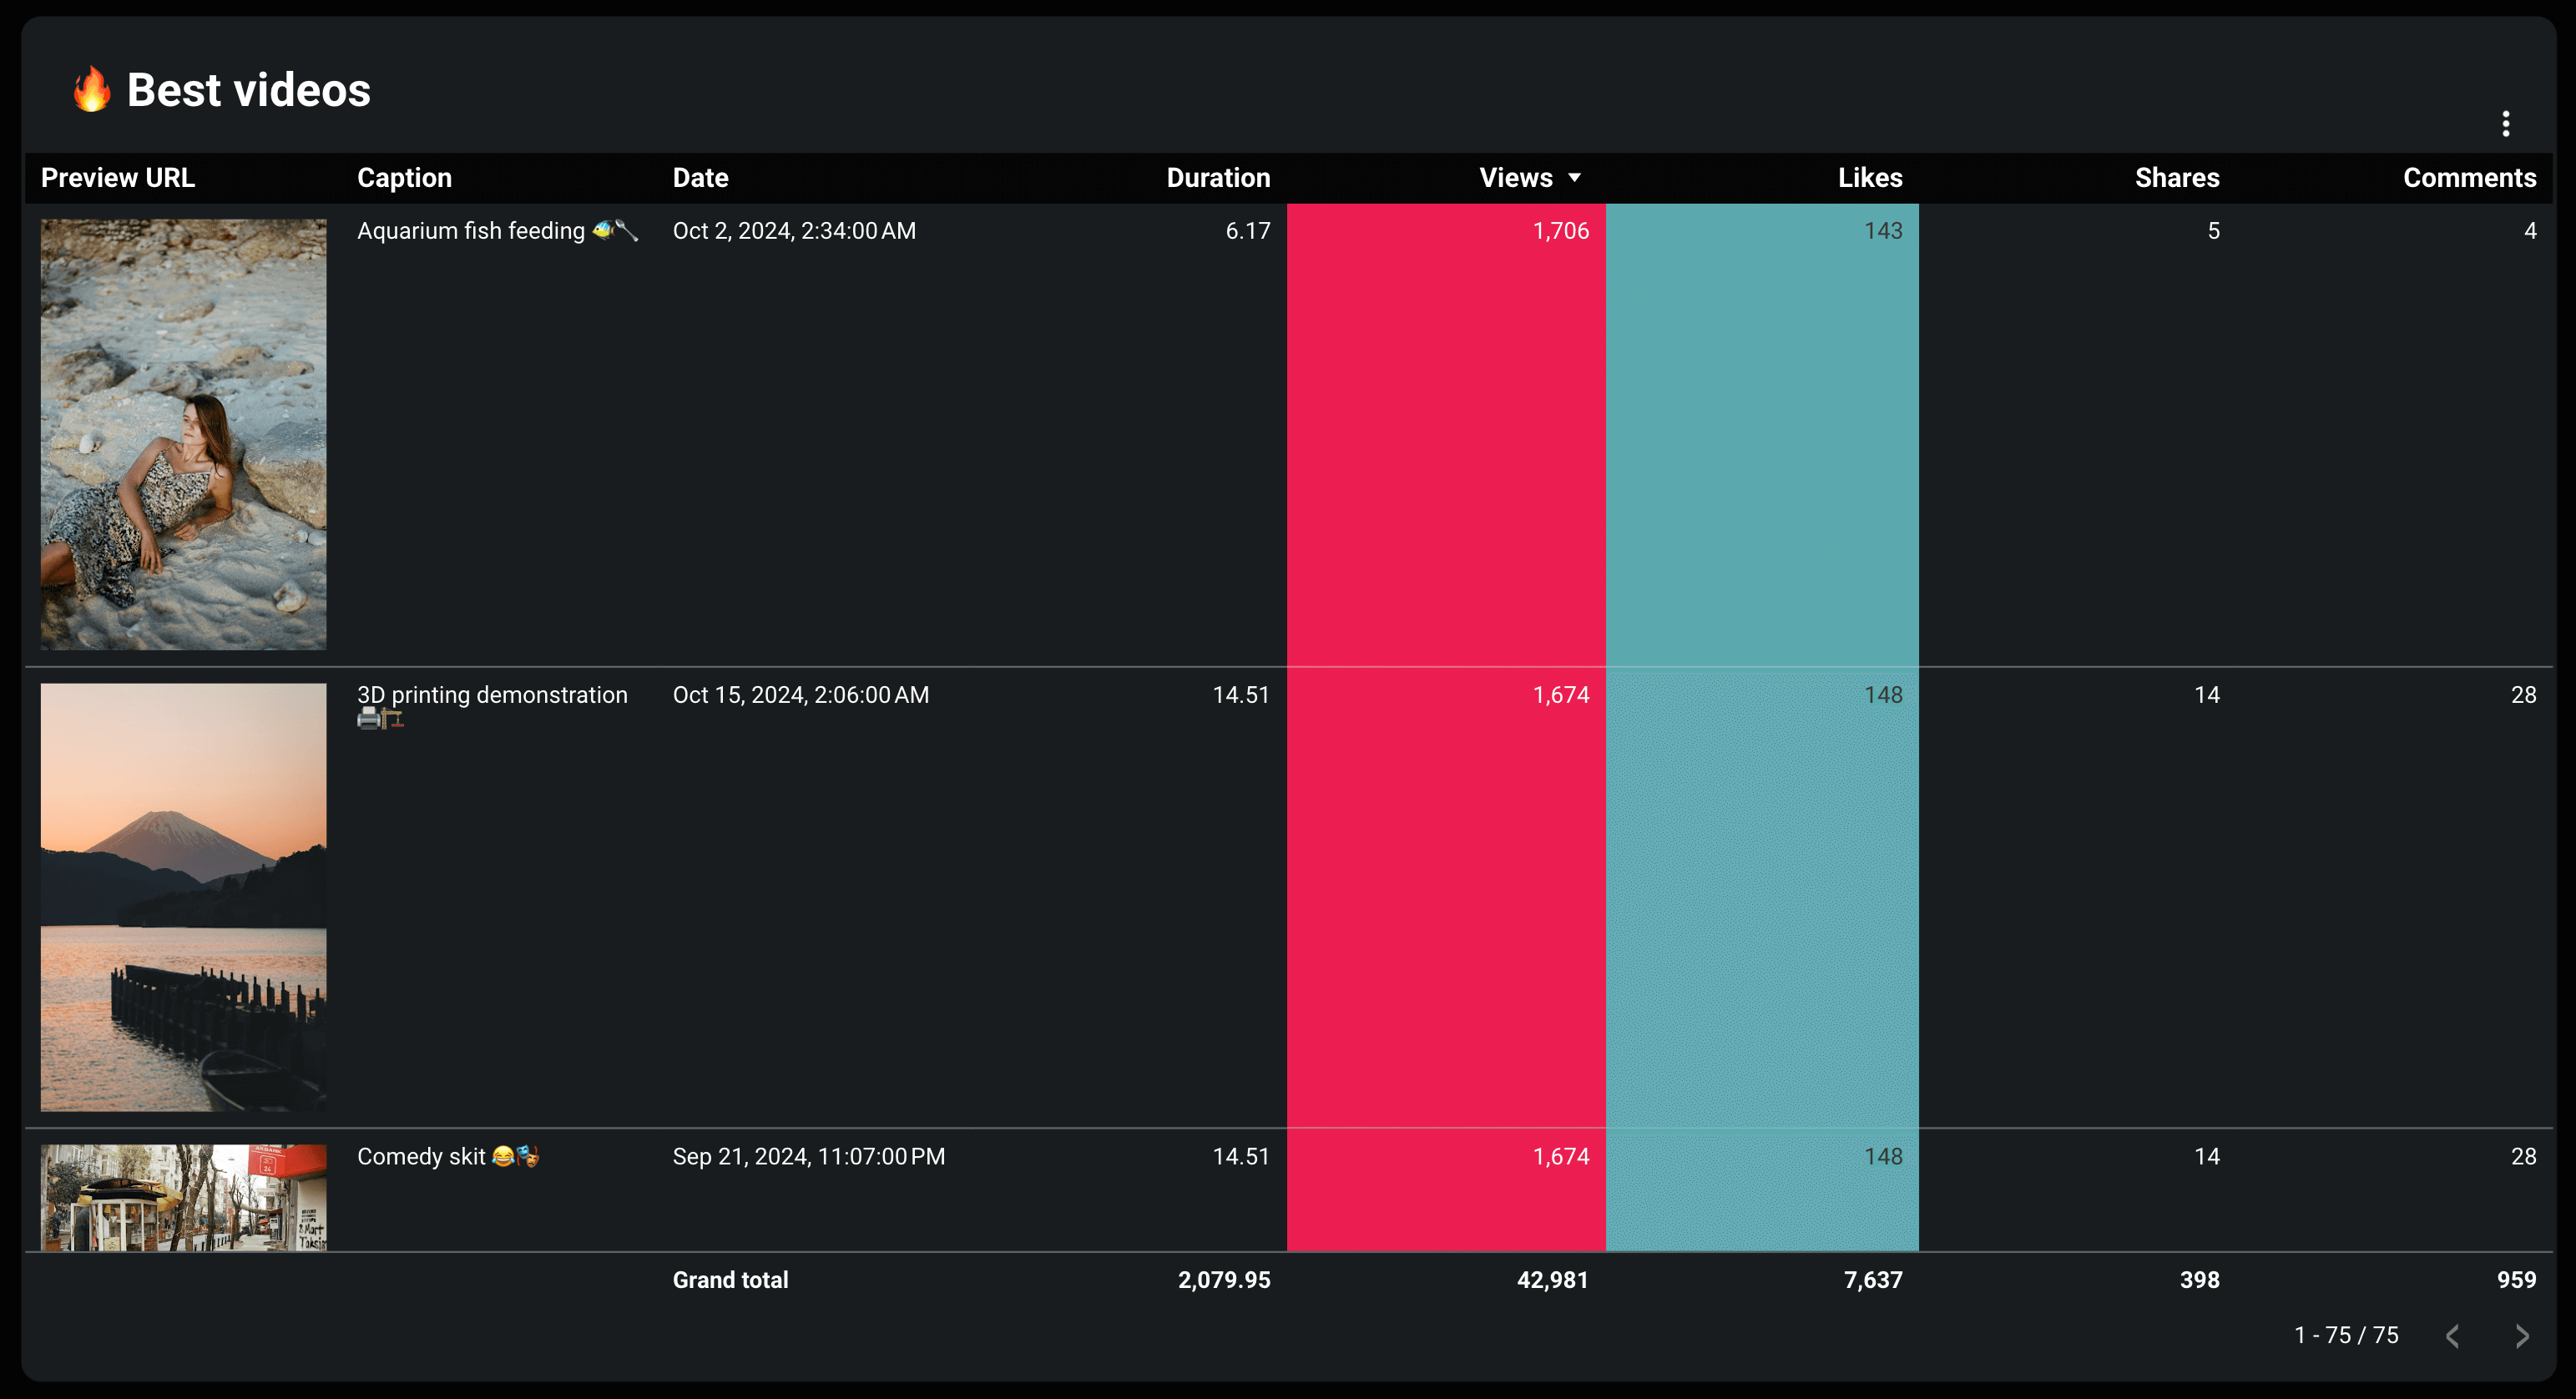
- Content performance: Access a list of your top videos sorted by different engagement metrics. For example, you can sort videos by likes to identify which content generated the most interaction.
To begin using the template, check the Readme tab for instructions. All you need to do is log in to Coupler.io and link your TikTok account to turn your data into a meaningful report.
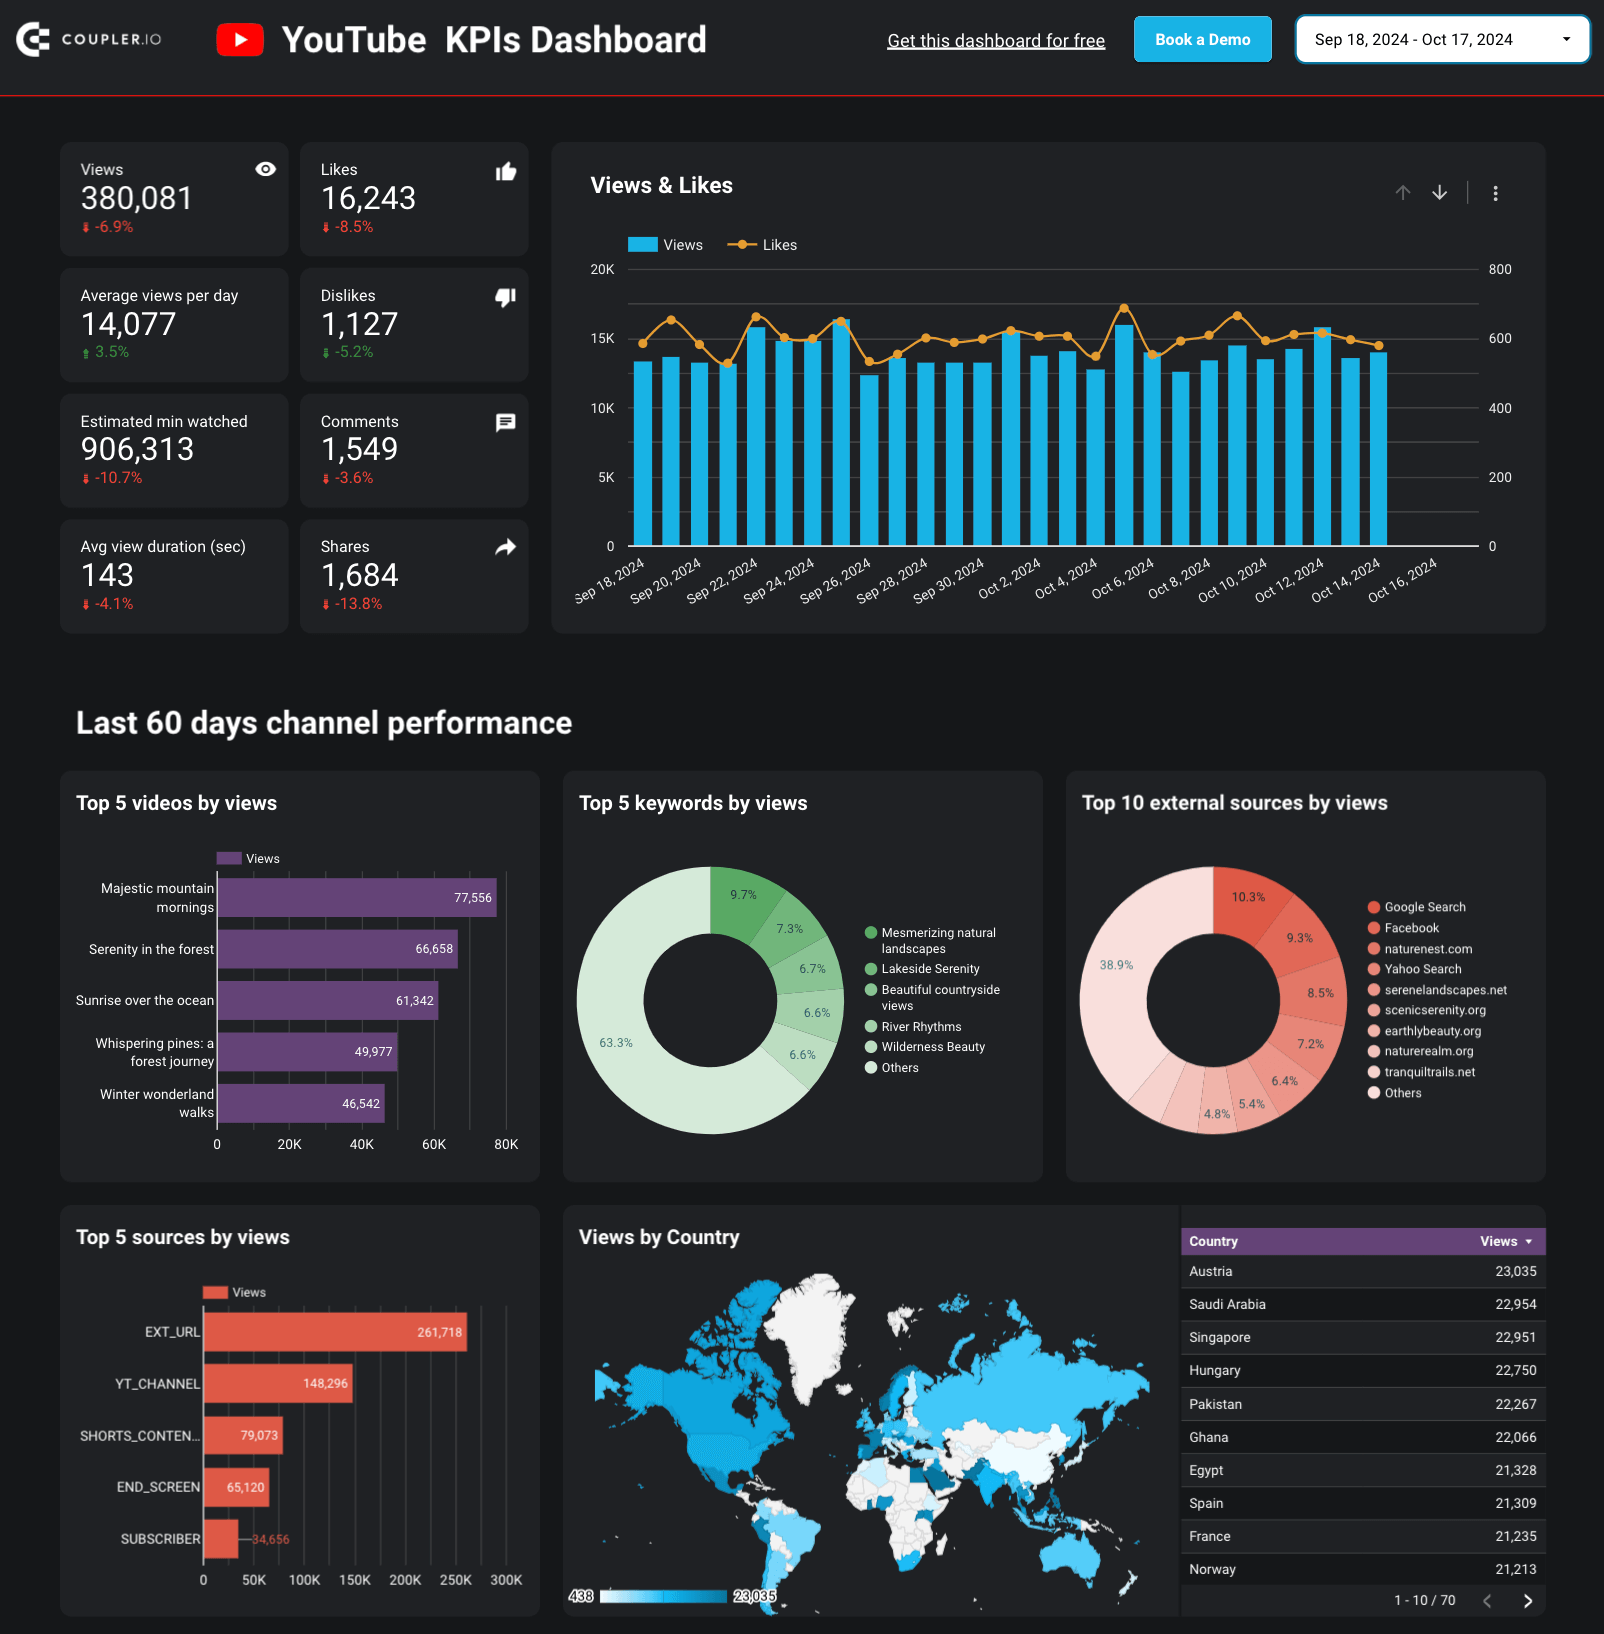
YouTube KPIs dashboard
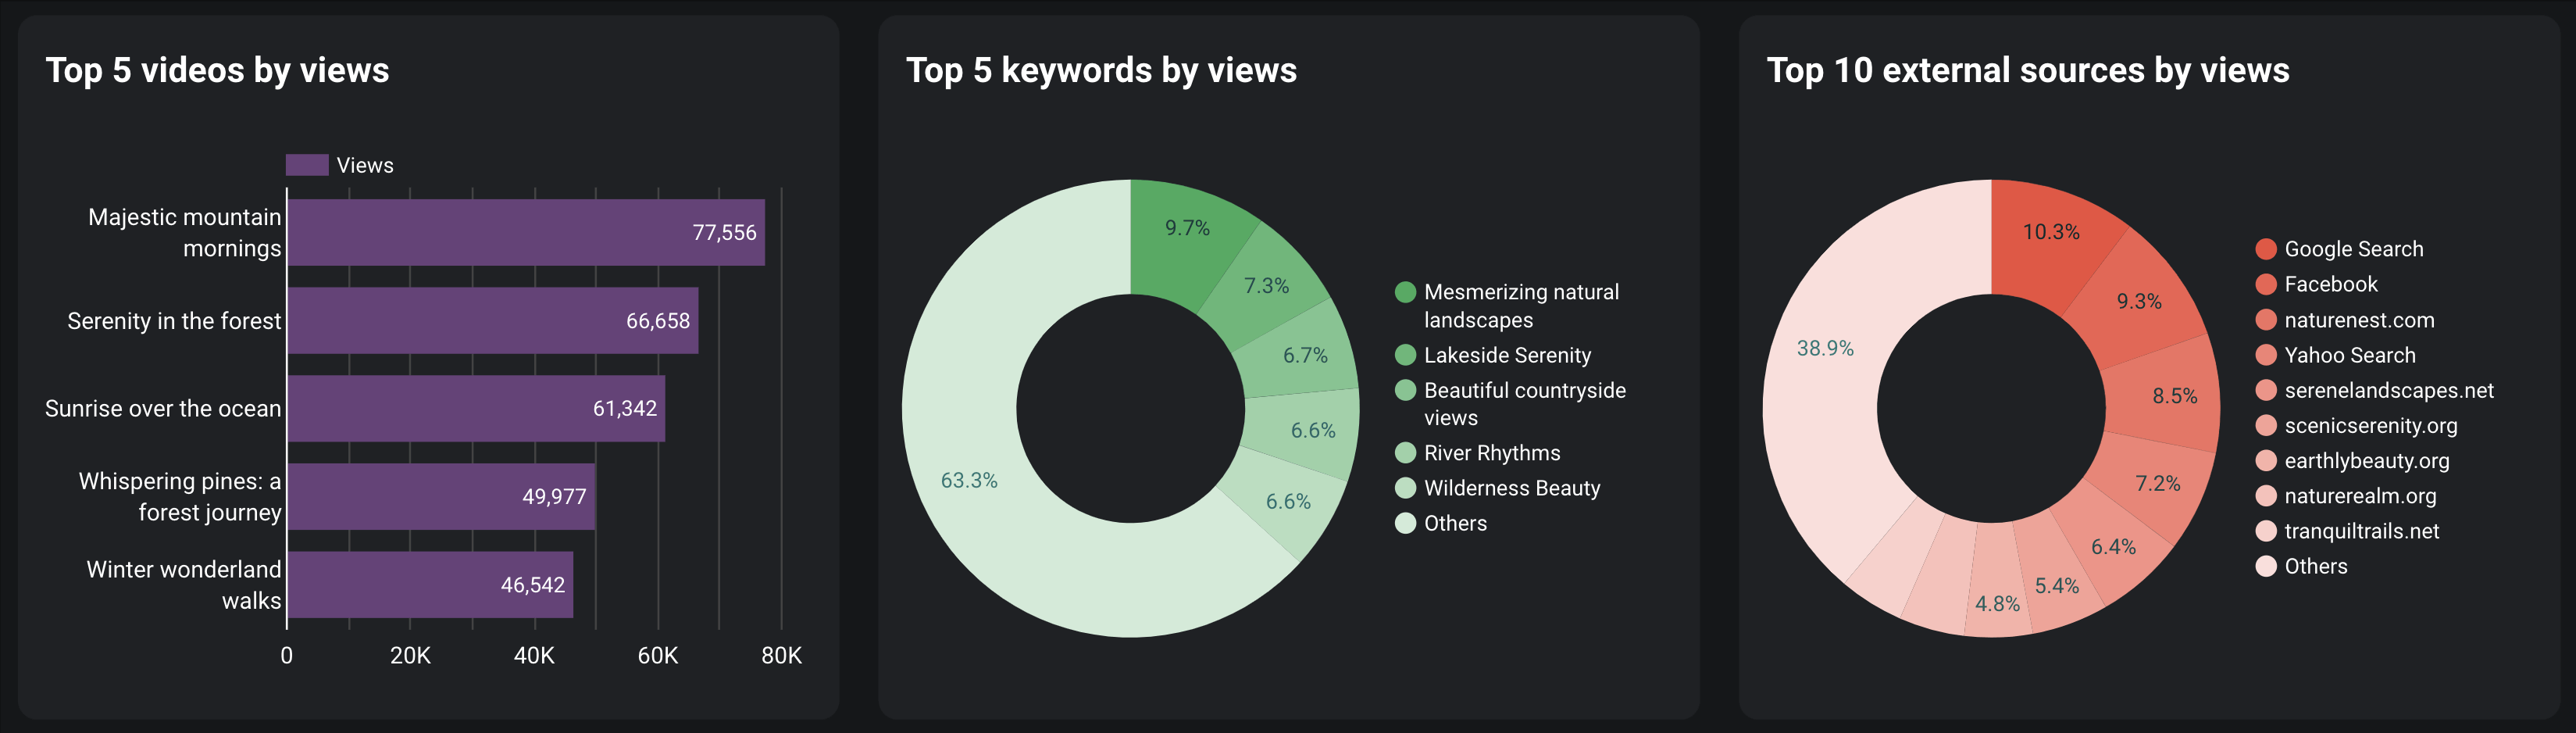
The YouTube KPIs dashboard in Looker Studio helps you track content performance, monitor subscriber growth, and analyze the sources of the views on your YouTube channel.
With this dashboard, you can learn the following:
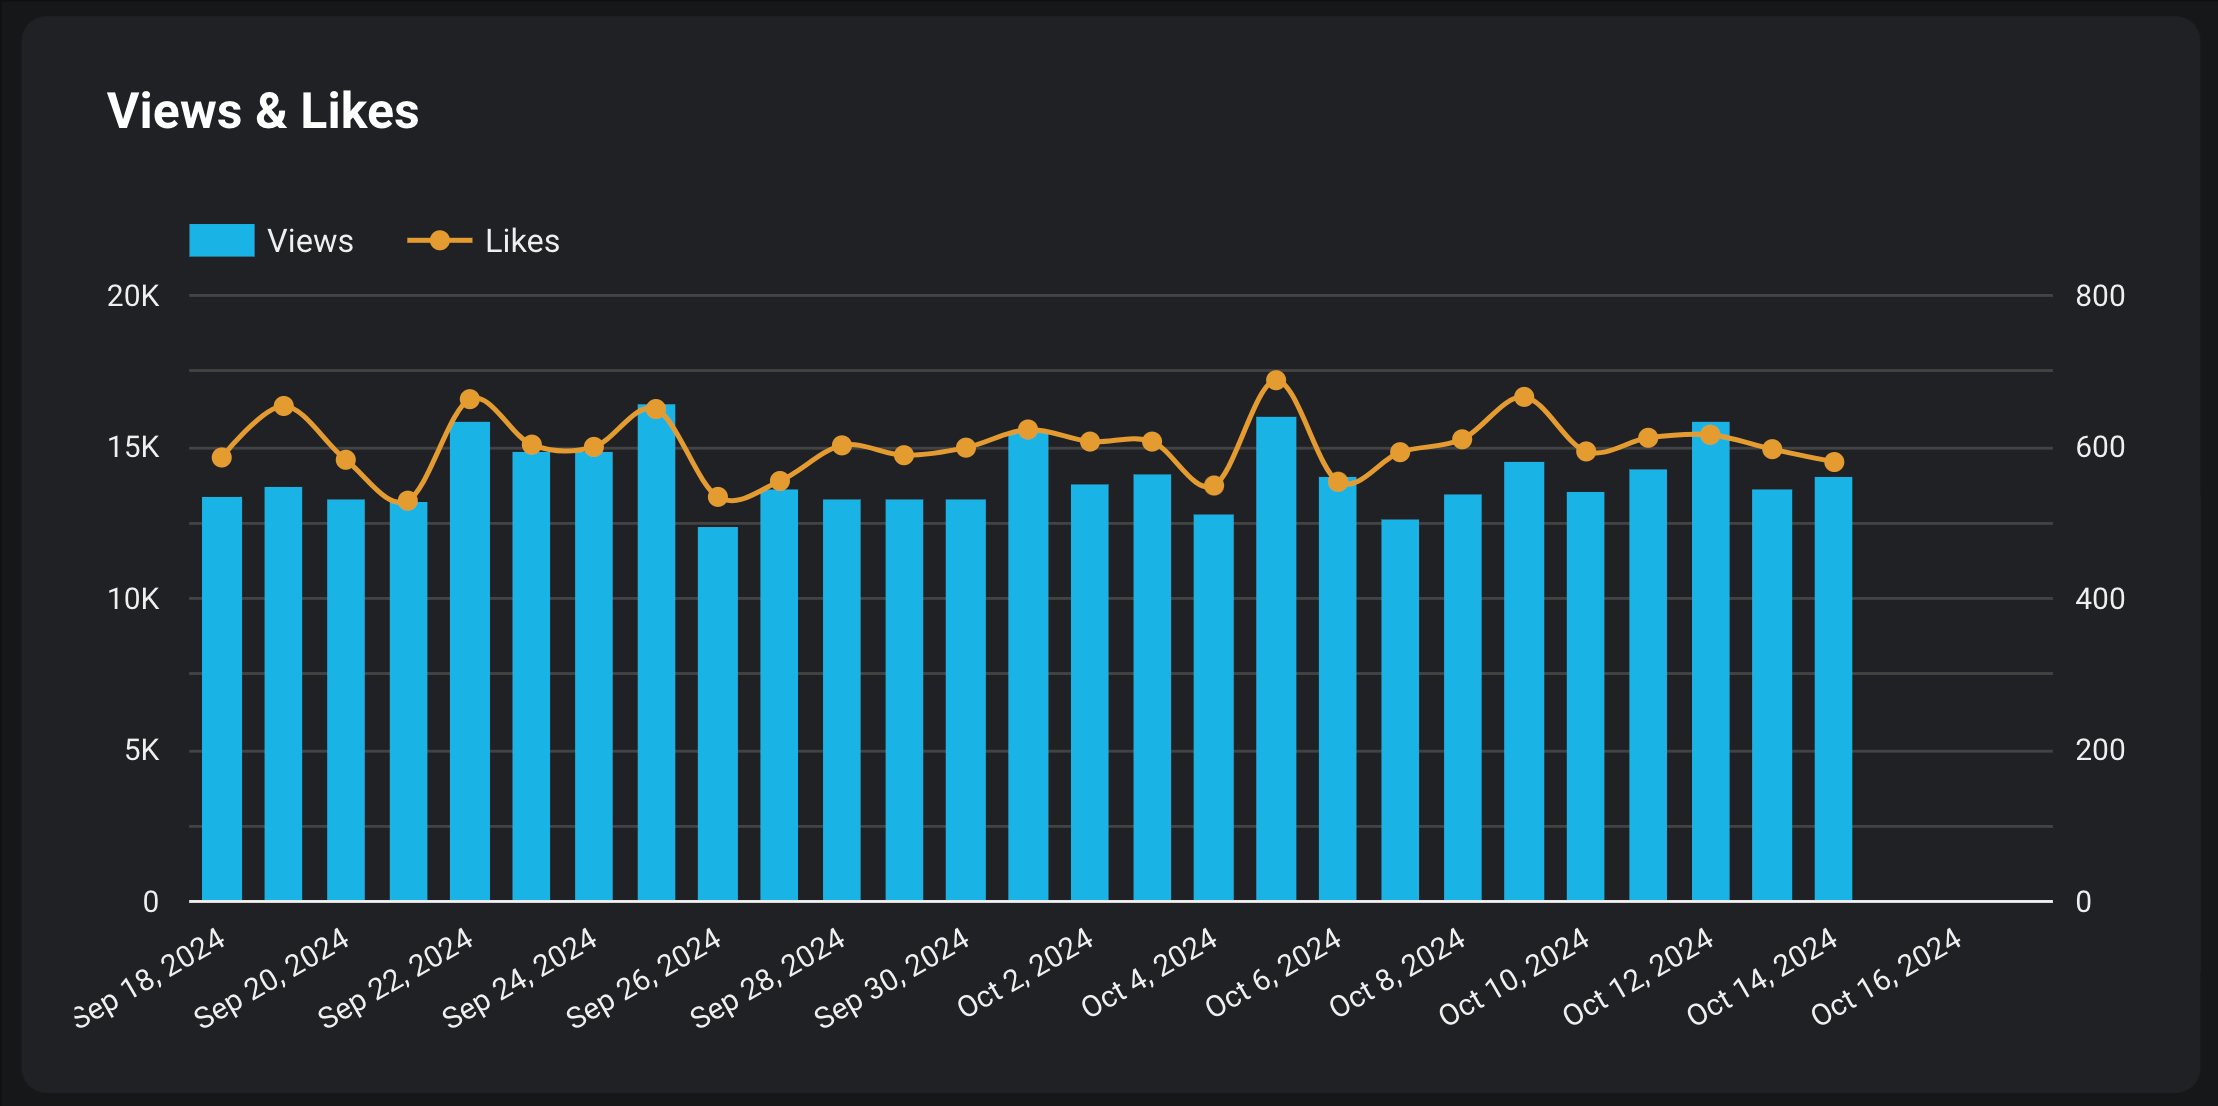
- Content effectiveness: Monitor video performance over time. This way, you can identify successful content strategies.
- Channel performance: Check out the top sources and keywords driving traffic to your channel. This will show you how and where to promote your content better.
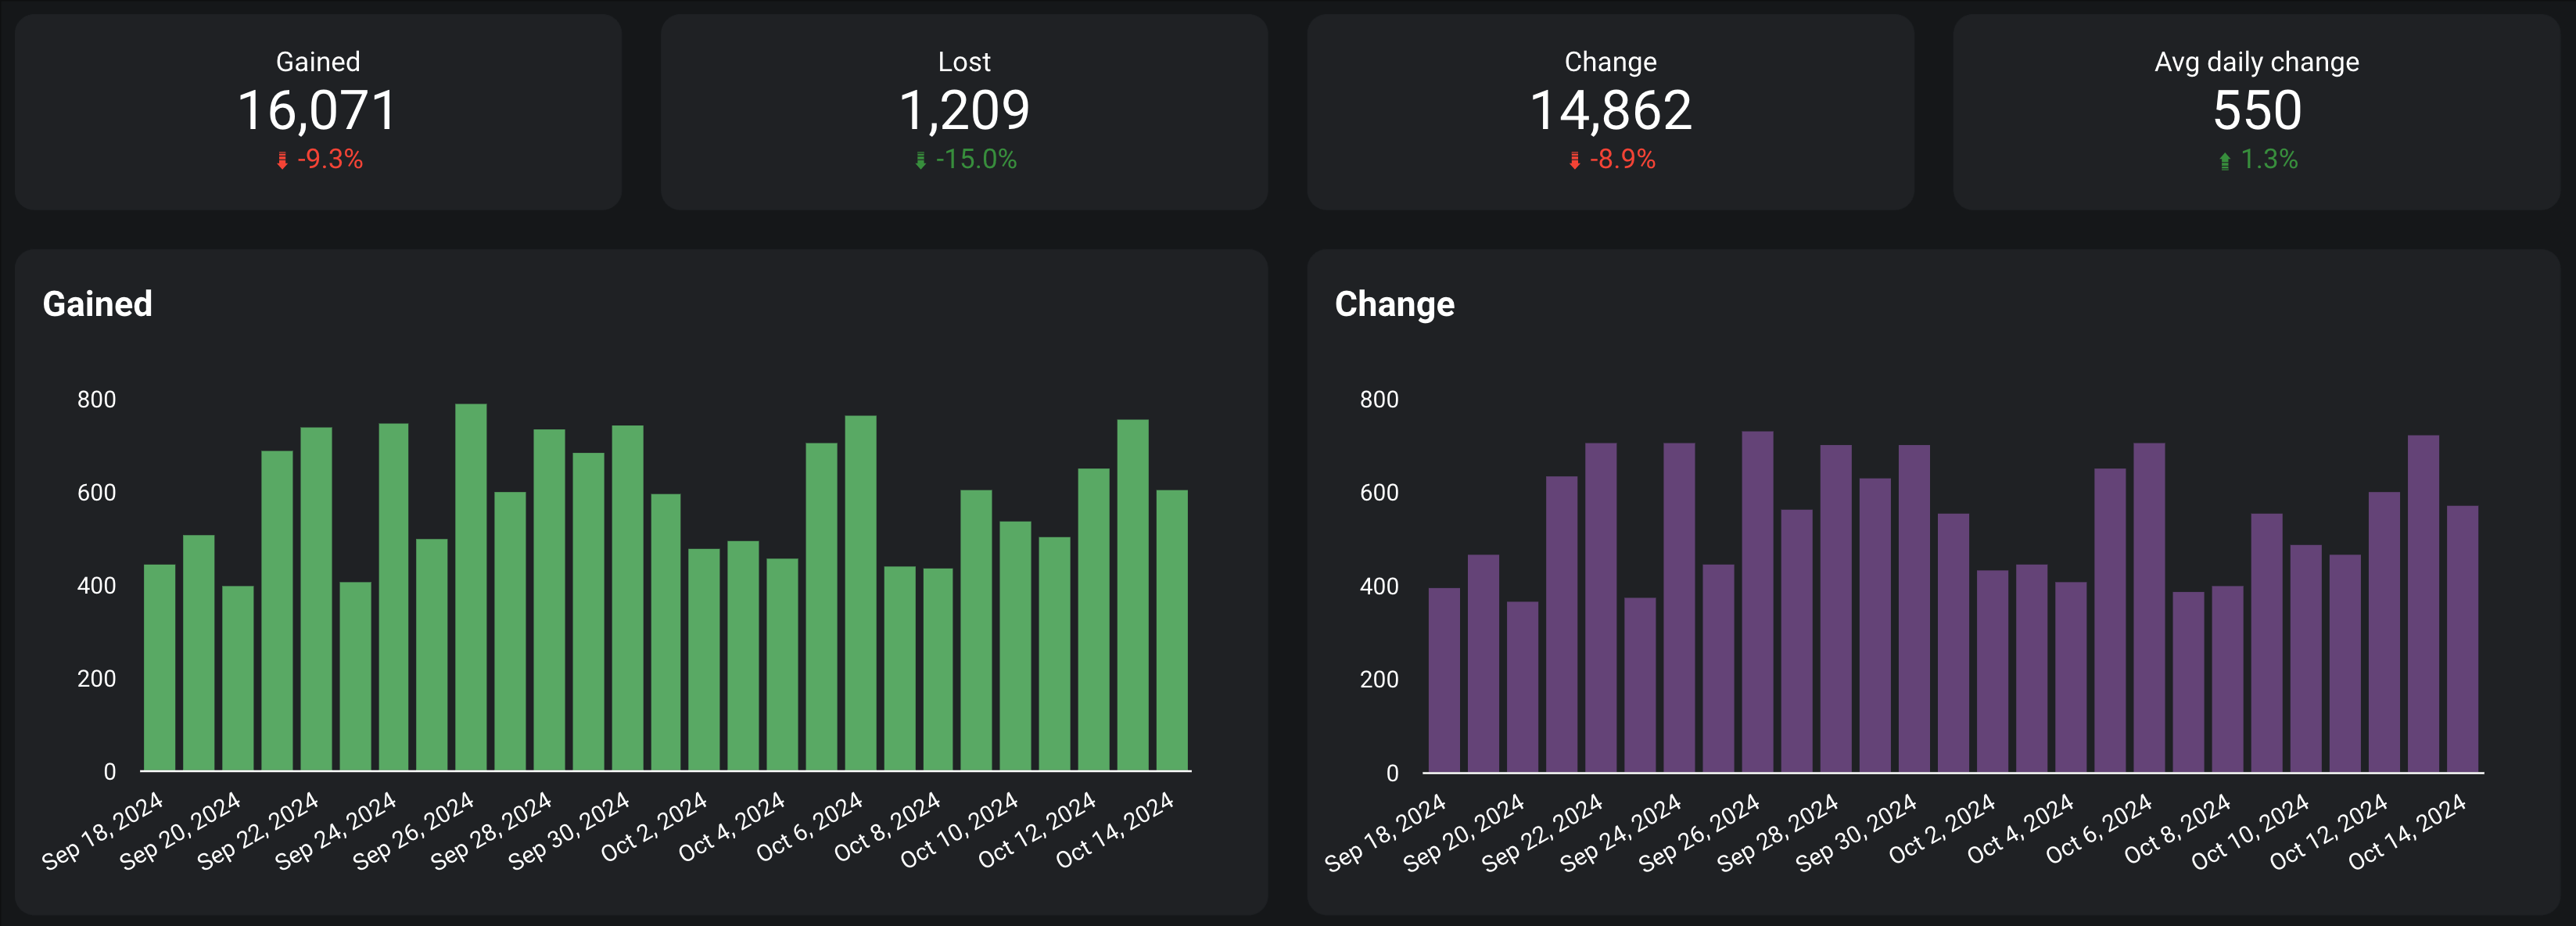
- Subscriber growth: Observe changes in your subscriber base. This knowledge is crucial for keeping your YouTube engagement on track.
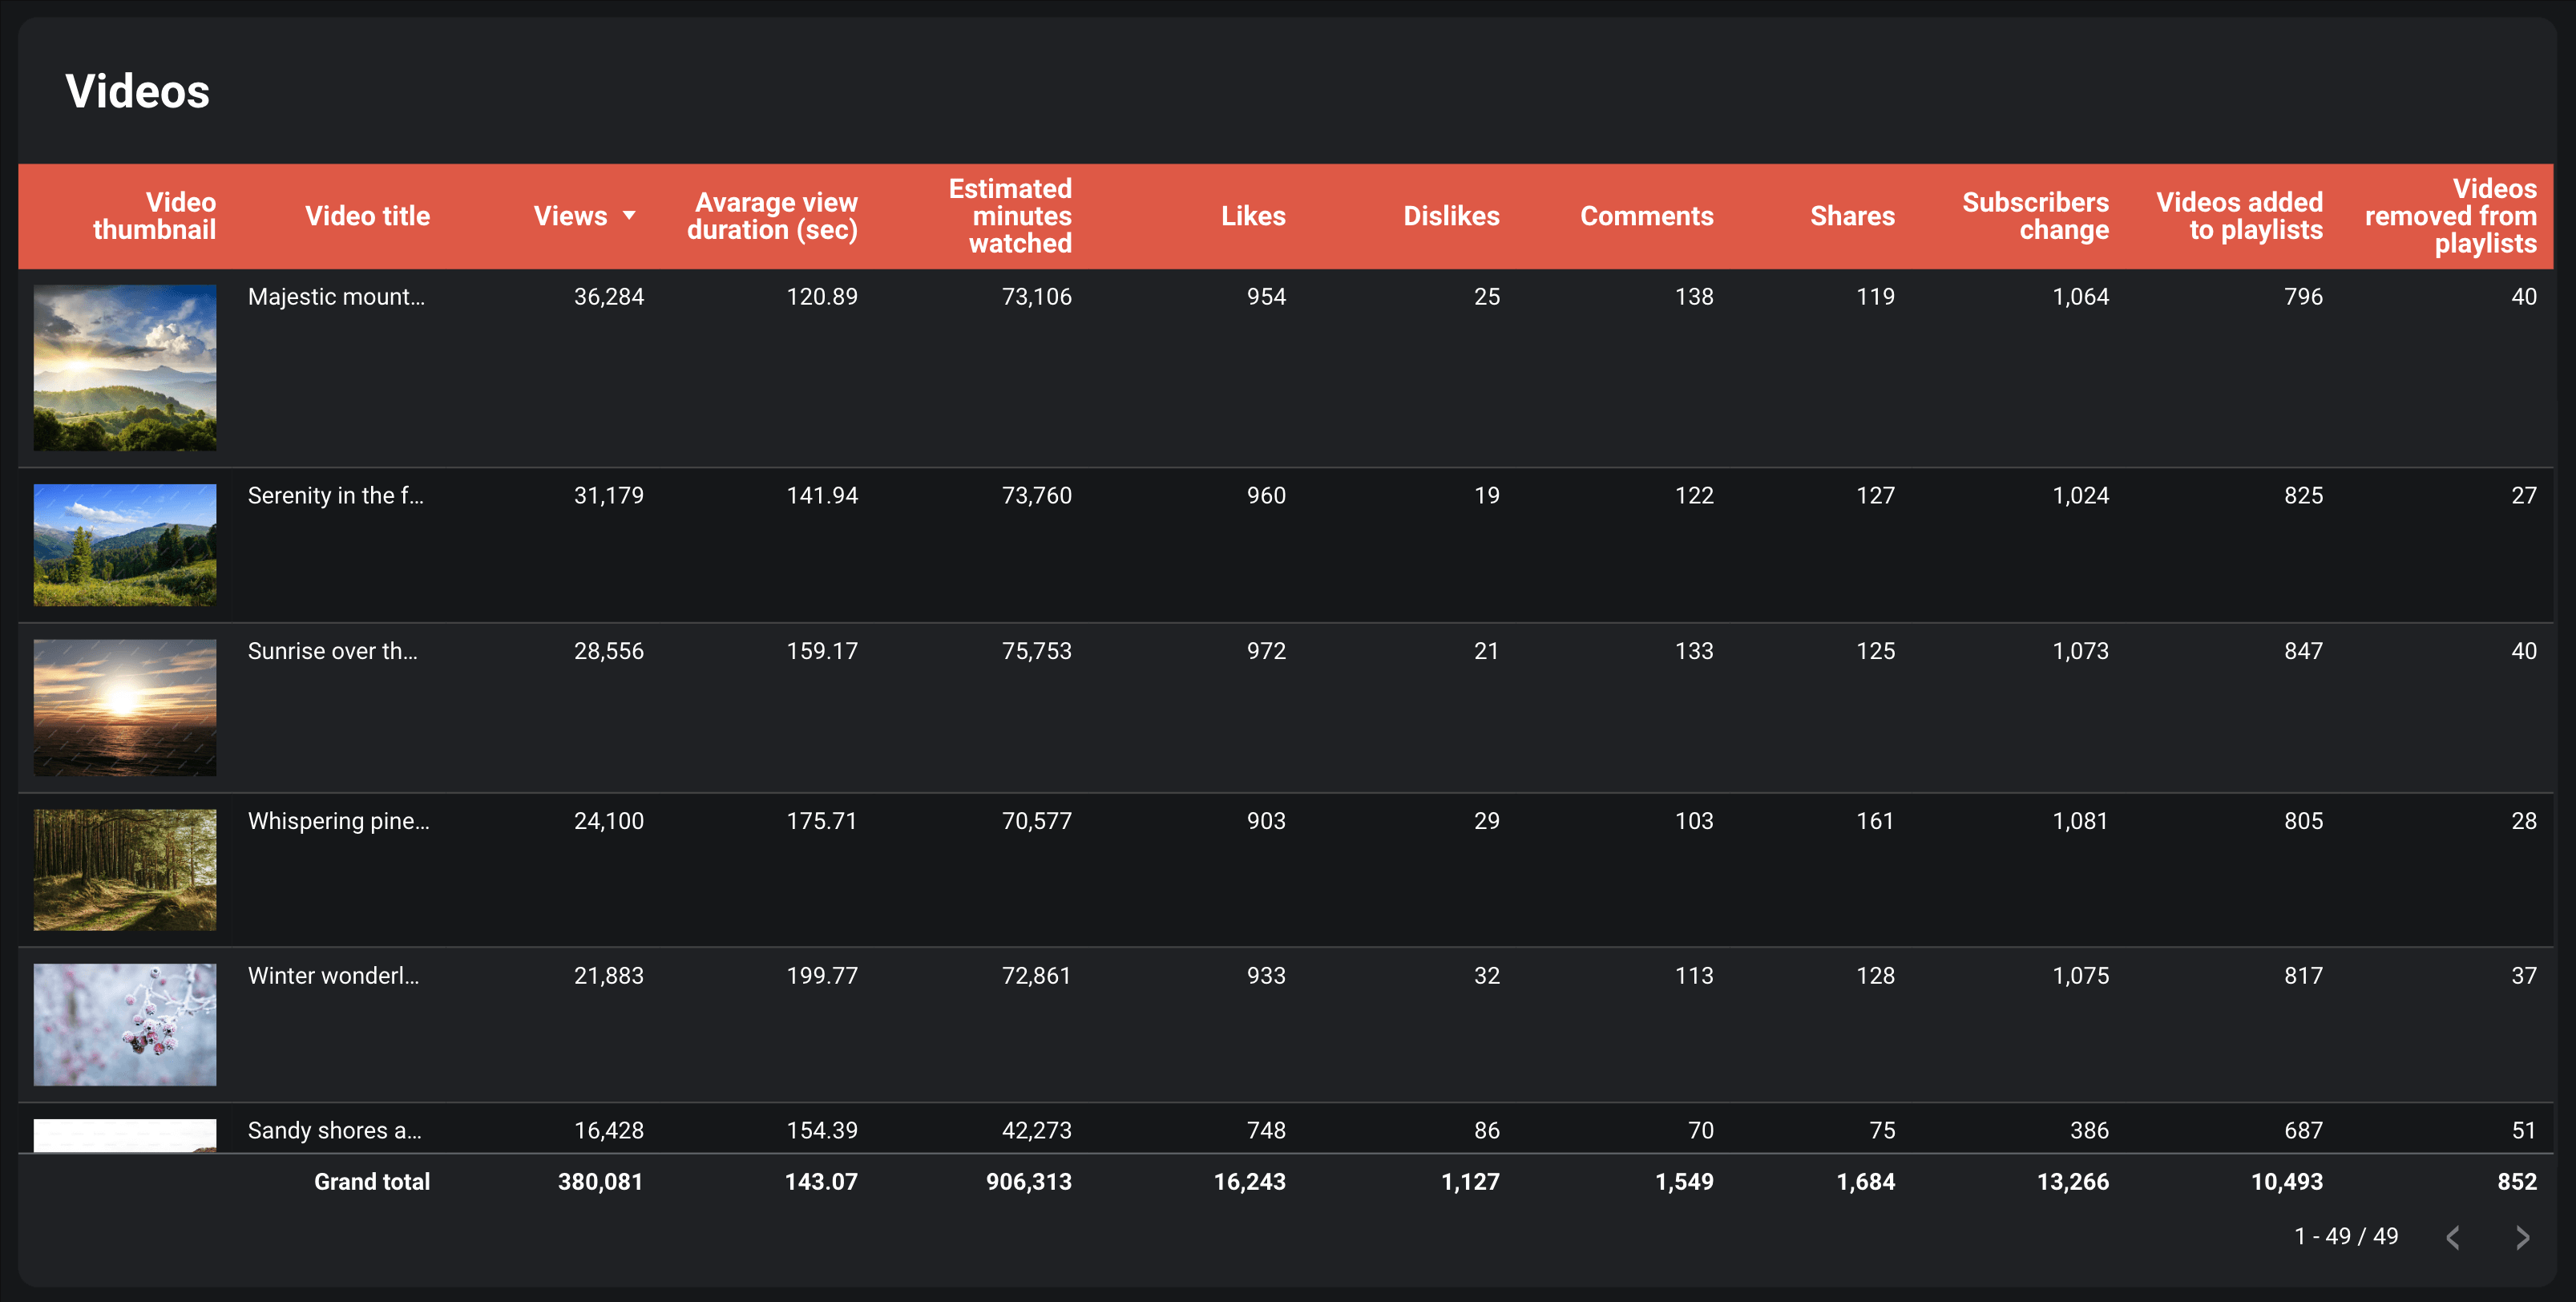
- Video insights: Review detailed metrics for each video. This analysis reveals strengths and highlights areas for improvement in your content strategy.
Check the Readme tab for step-by-step instructions on using the template, and then proceed to insightful reporting.
YouTube traffic performance
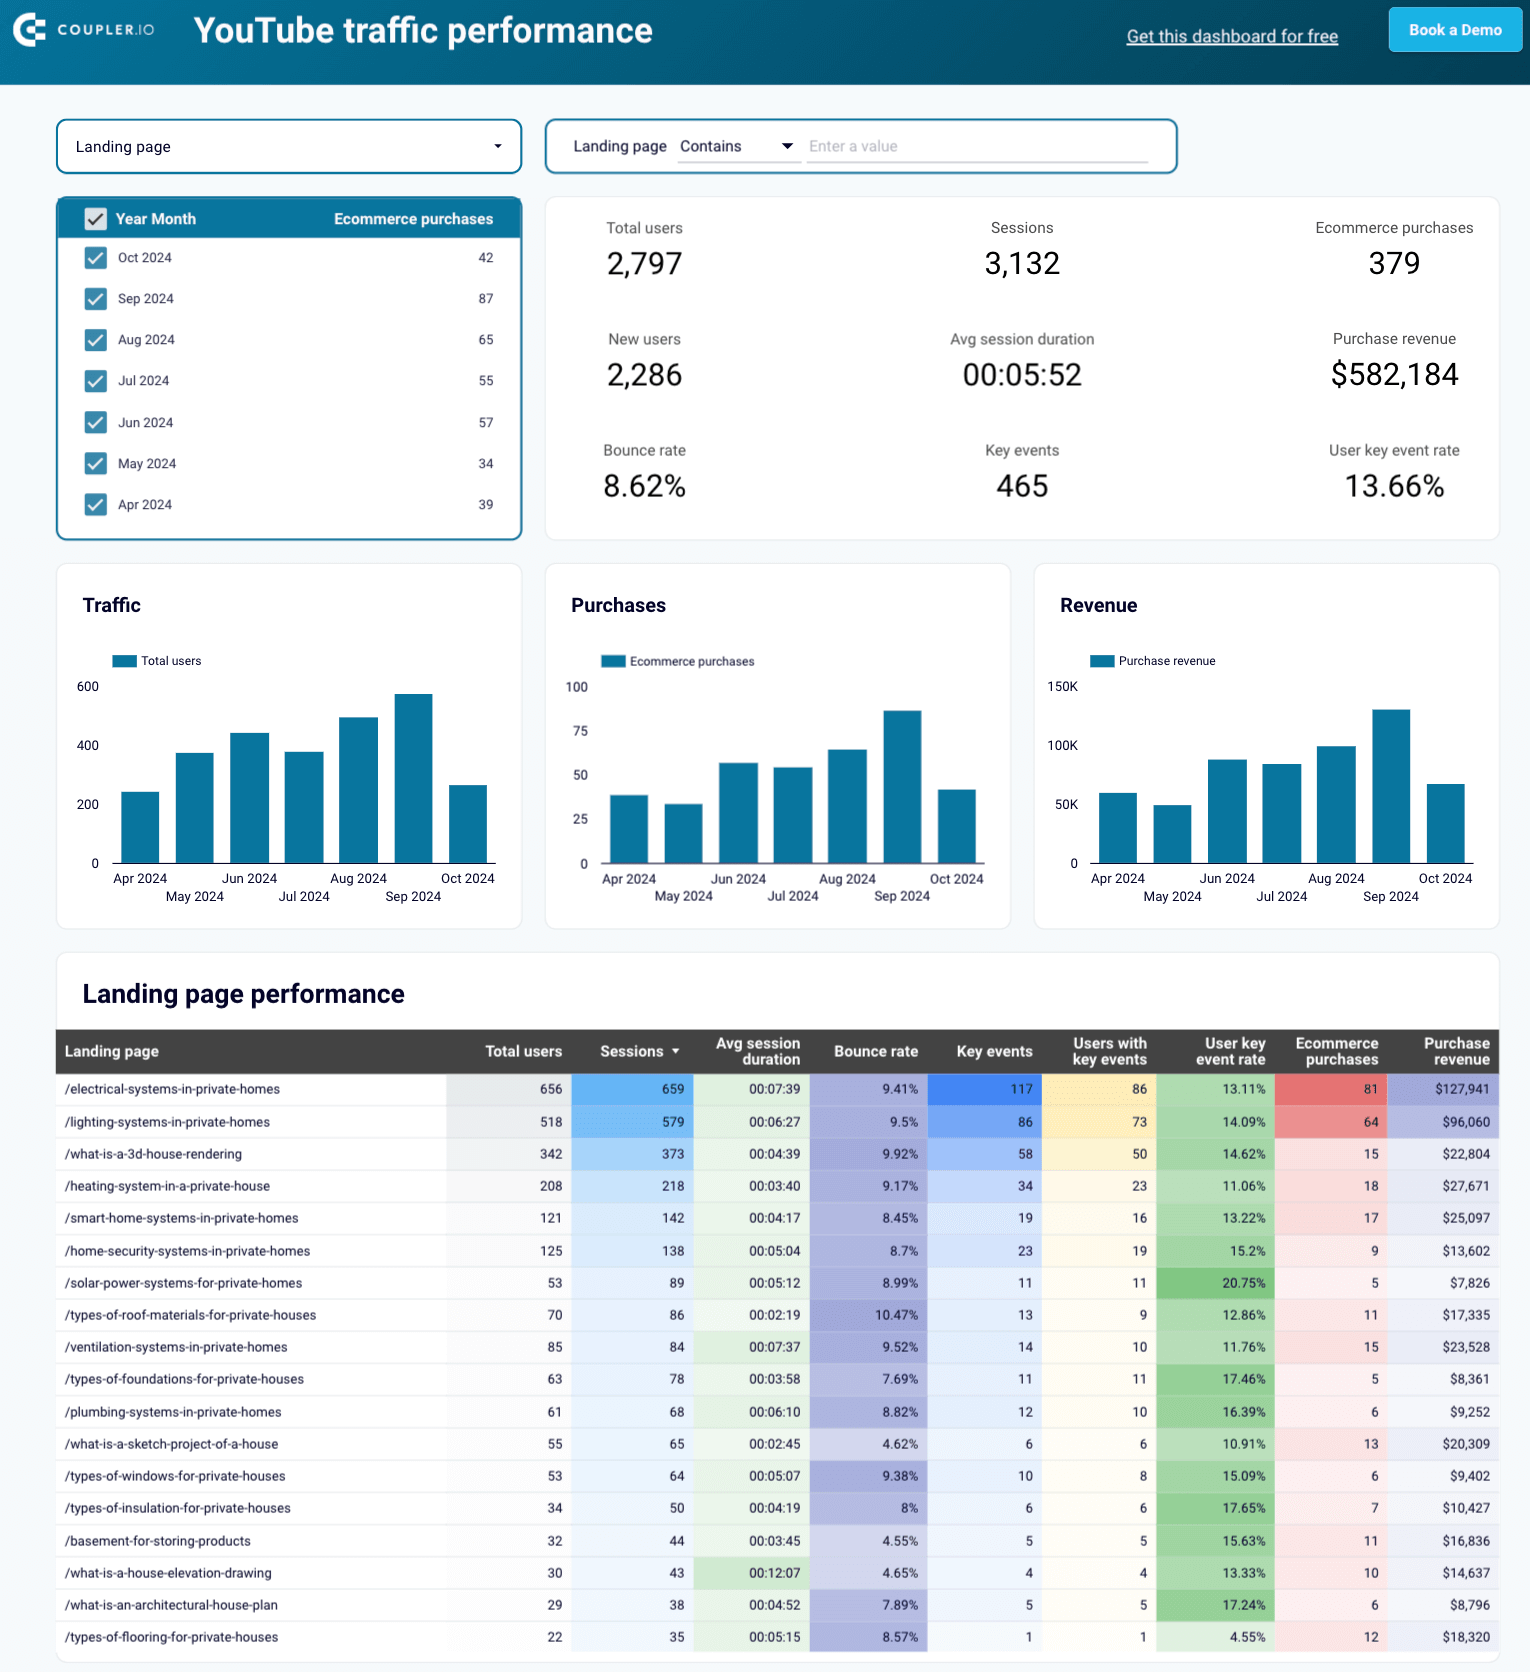
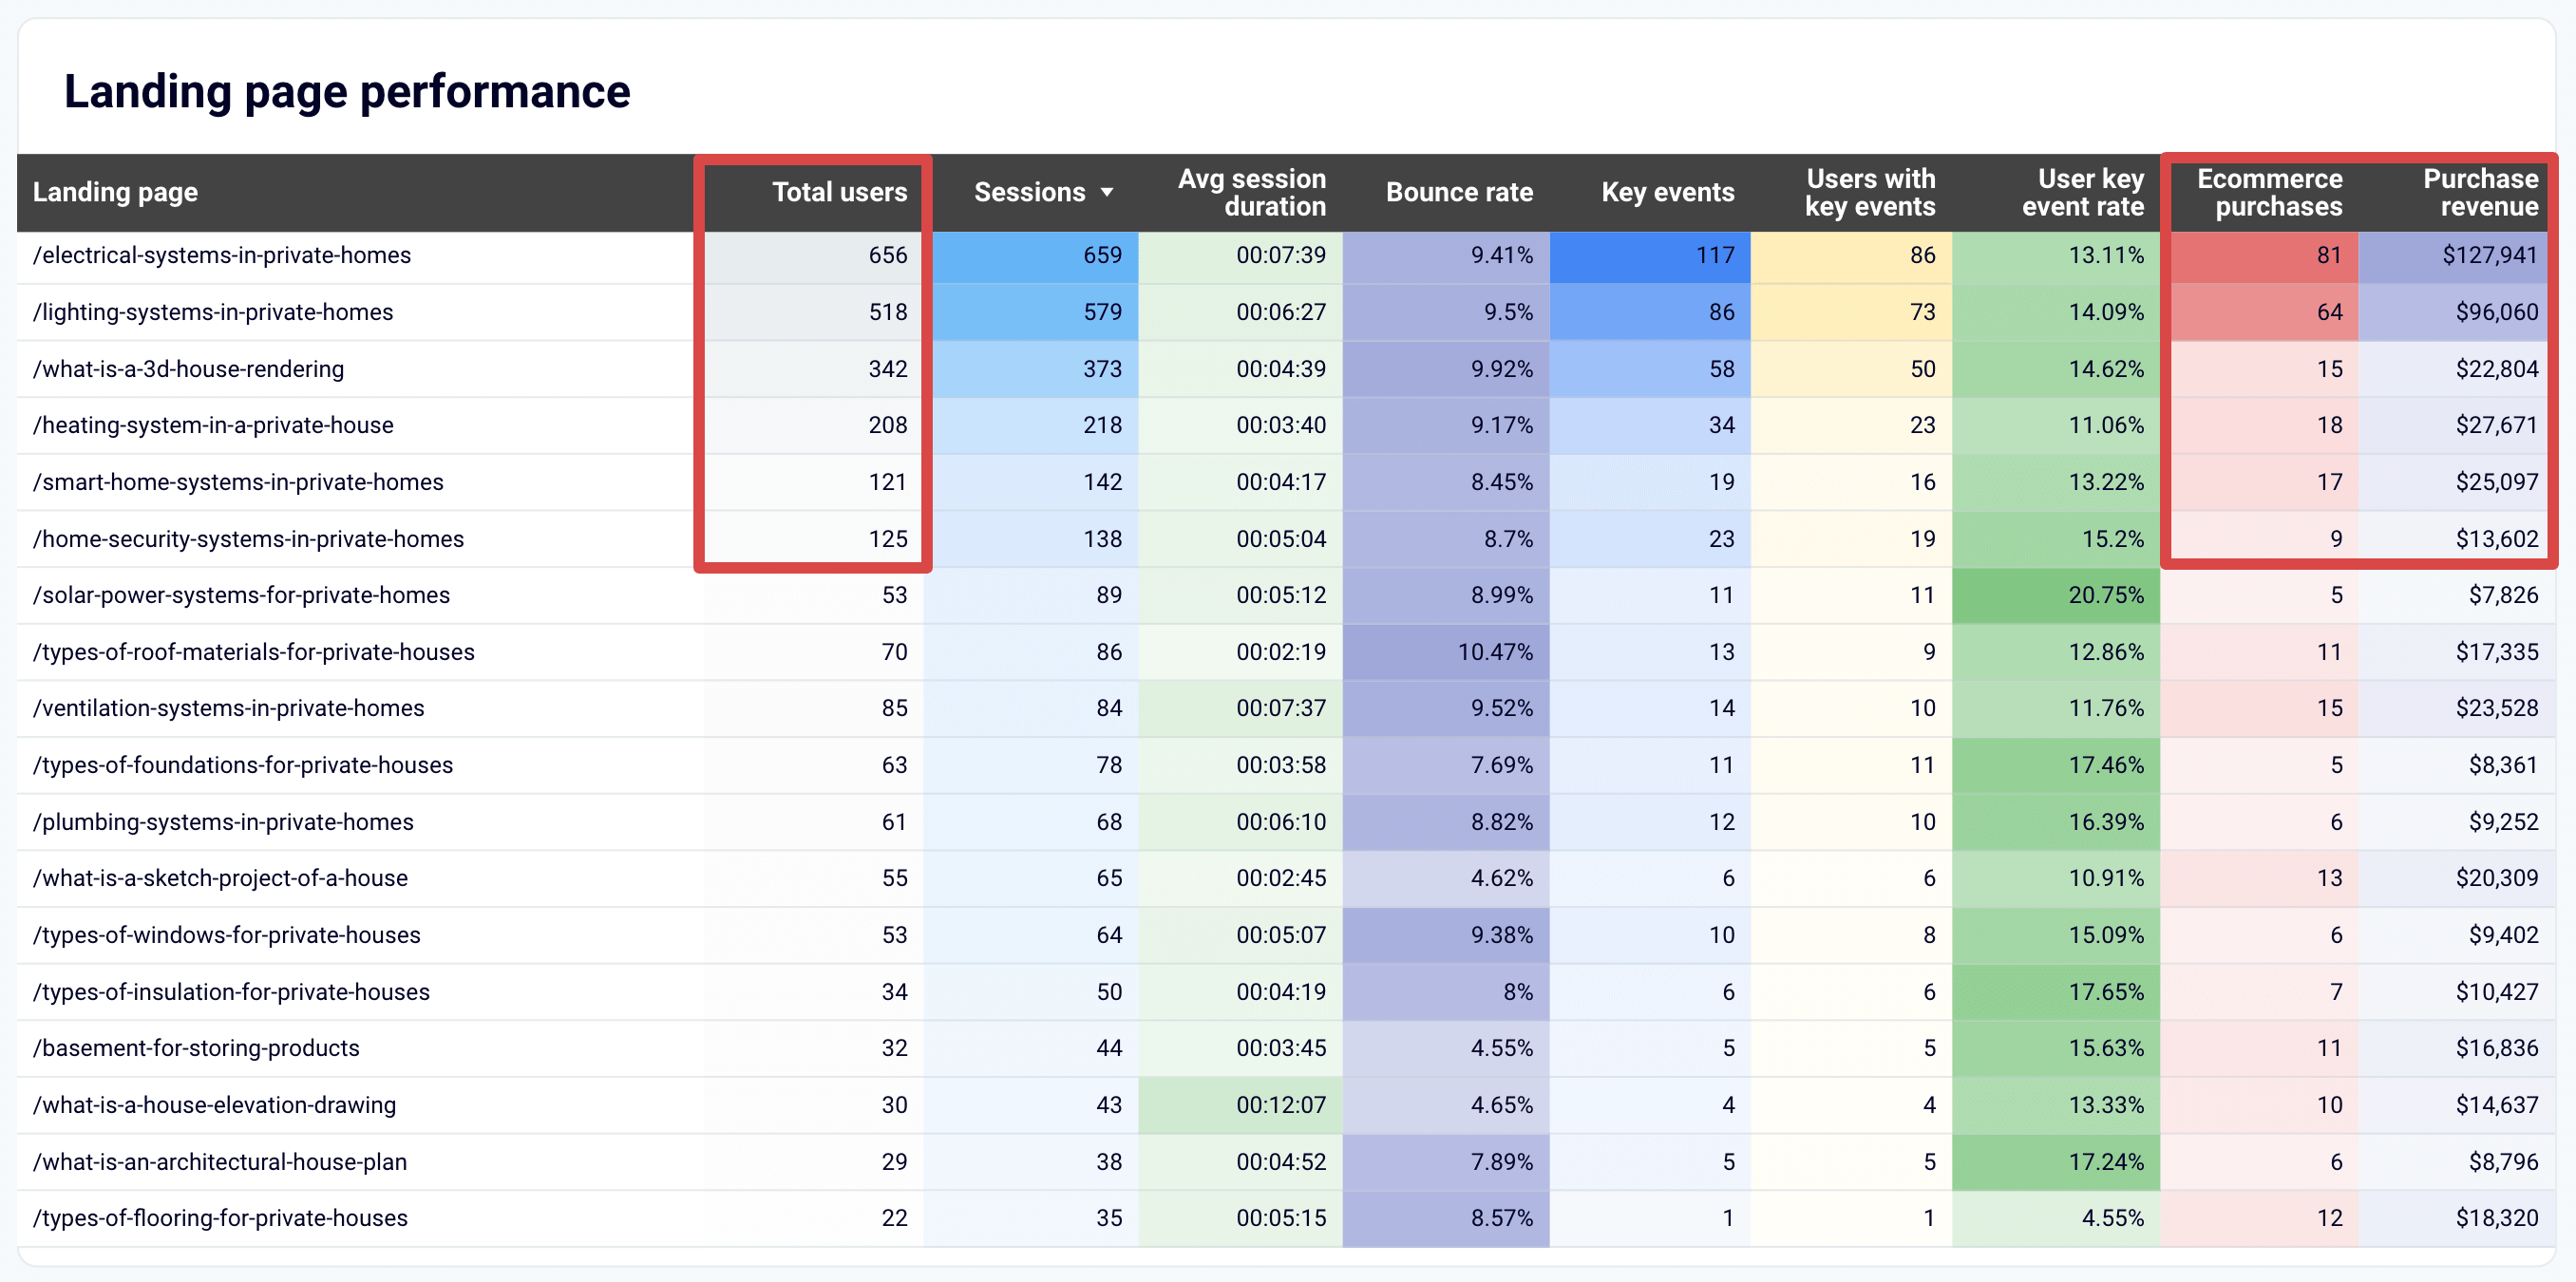
The YouTube traffic performance report displays how well your content drives traffic to your landing pages and how much revenue this traffic generates. It shows data from GA4 to help you track website visits coming from YouTube. Use the filter to select a specific landing page and view its data.
This YouTube Analytics report template covers the following data points:
- Video link performance: Consider you’ve used the same link across several videos. In that case, the dashboard lets you know whether people clicked on it. Filter the data by the link and check how well the videos drive website visits, purchases, and revenue.
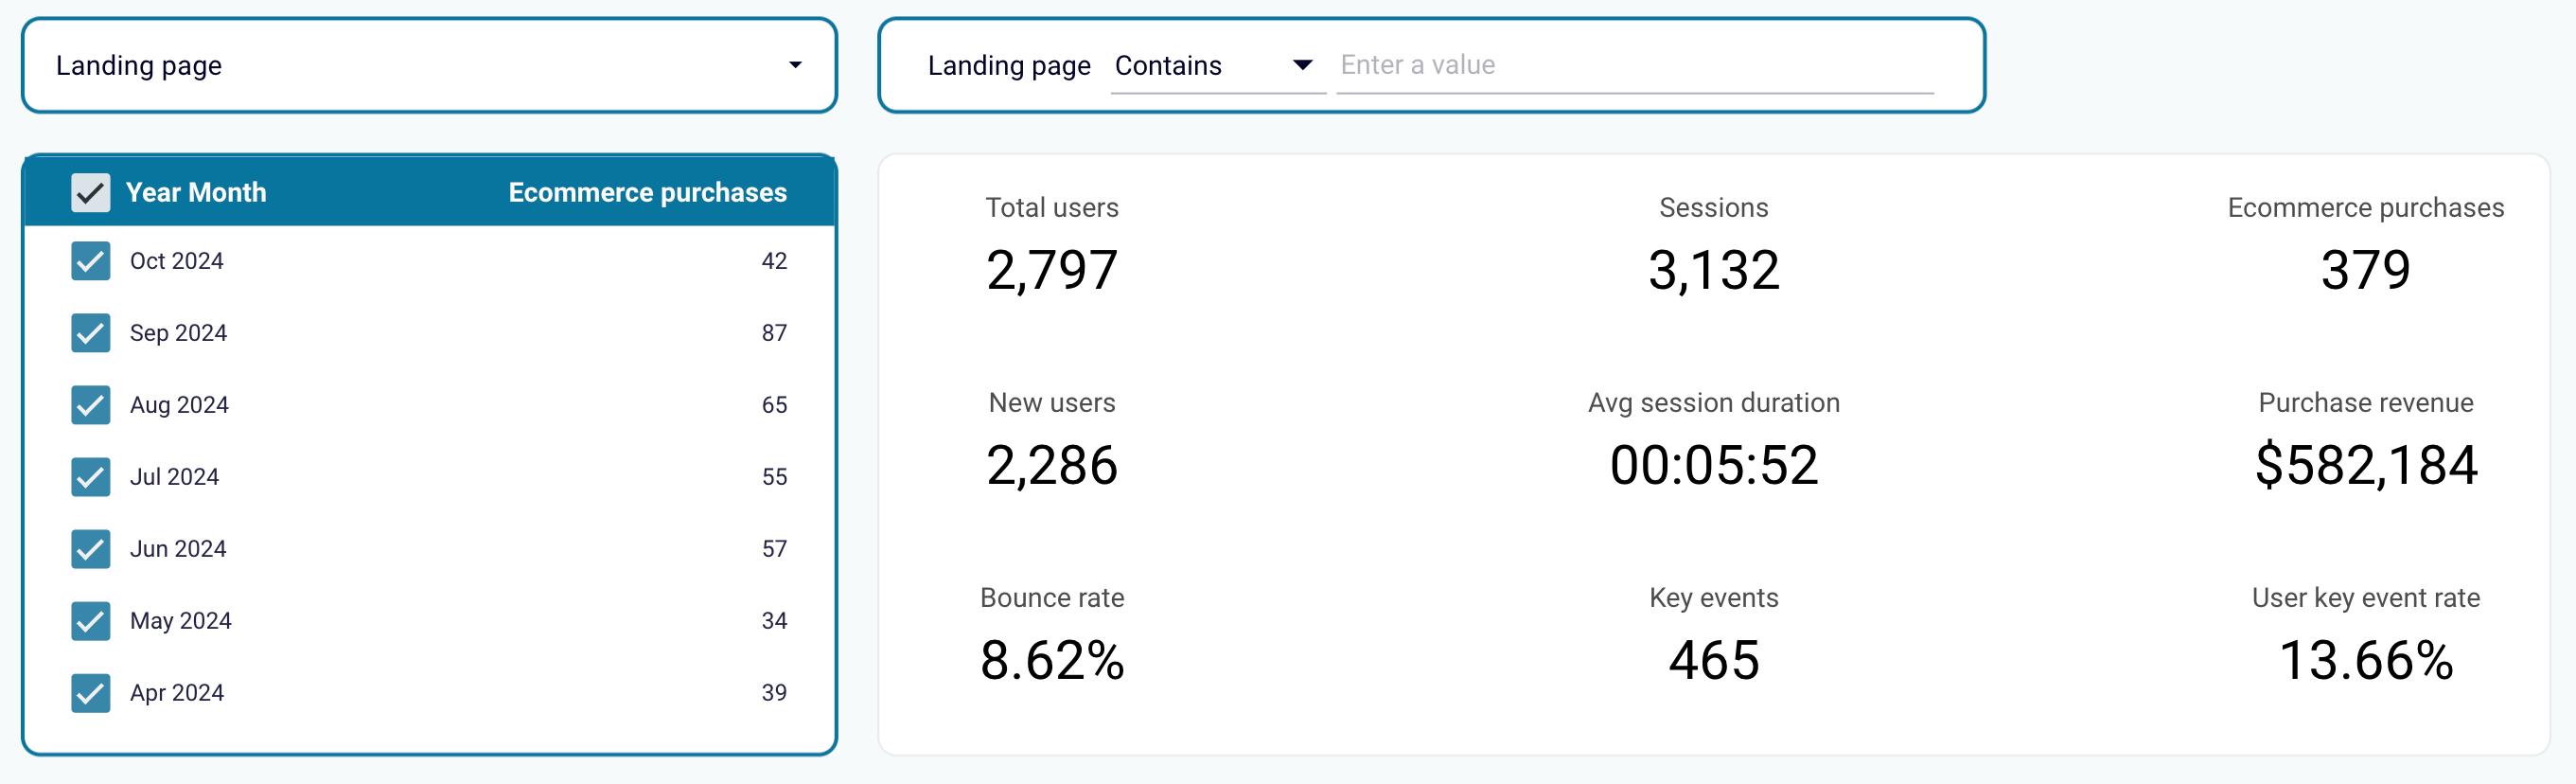
- Top pages and videos: Sort the data by clicks, purchases, and revenue to find your best-performing website pages. Then, identify which YouTube videos feature those links.
The template is available in Looker Studio and Google Sheets. To start reporting, navigate to the template’s Readme tab and follow the instructions for connecting YouTube data to the dashboard.
YouTube traffic performance report for Looker Studio
Get an overview of your YouTube channel’s traffic performance based on the data loaded from Google Analytics 4.


YouTube traffic performance report for Google Sheets
Analyze the traffic performance of your YouTube channel using the dashboard powered by data from Google Analytics 4.

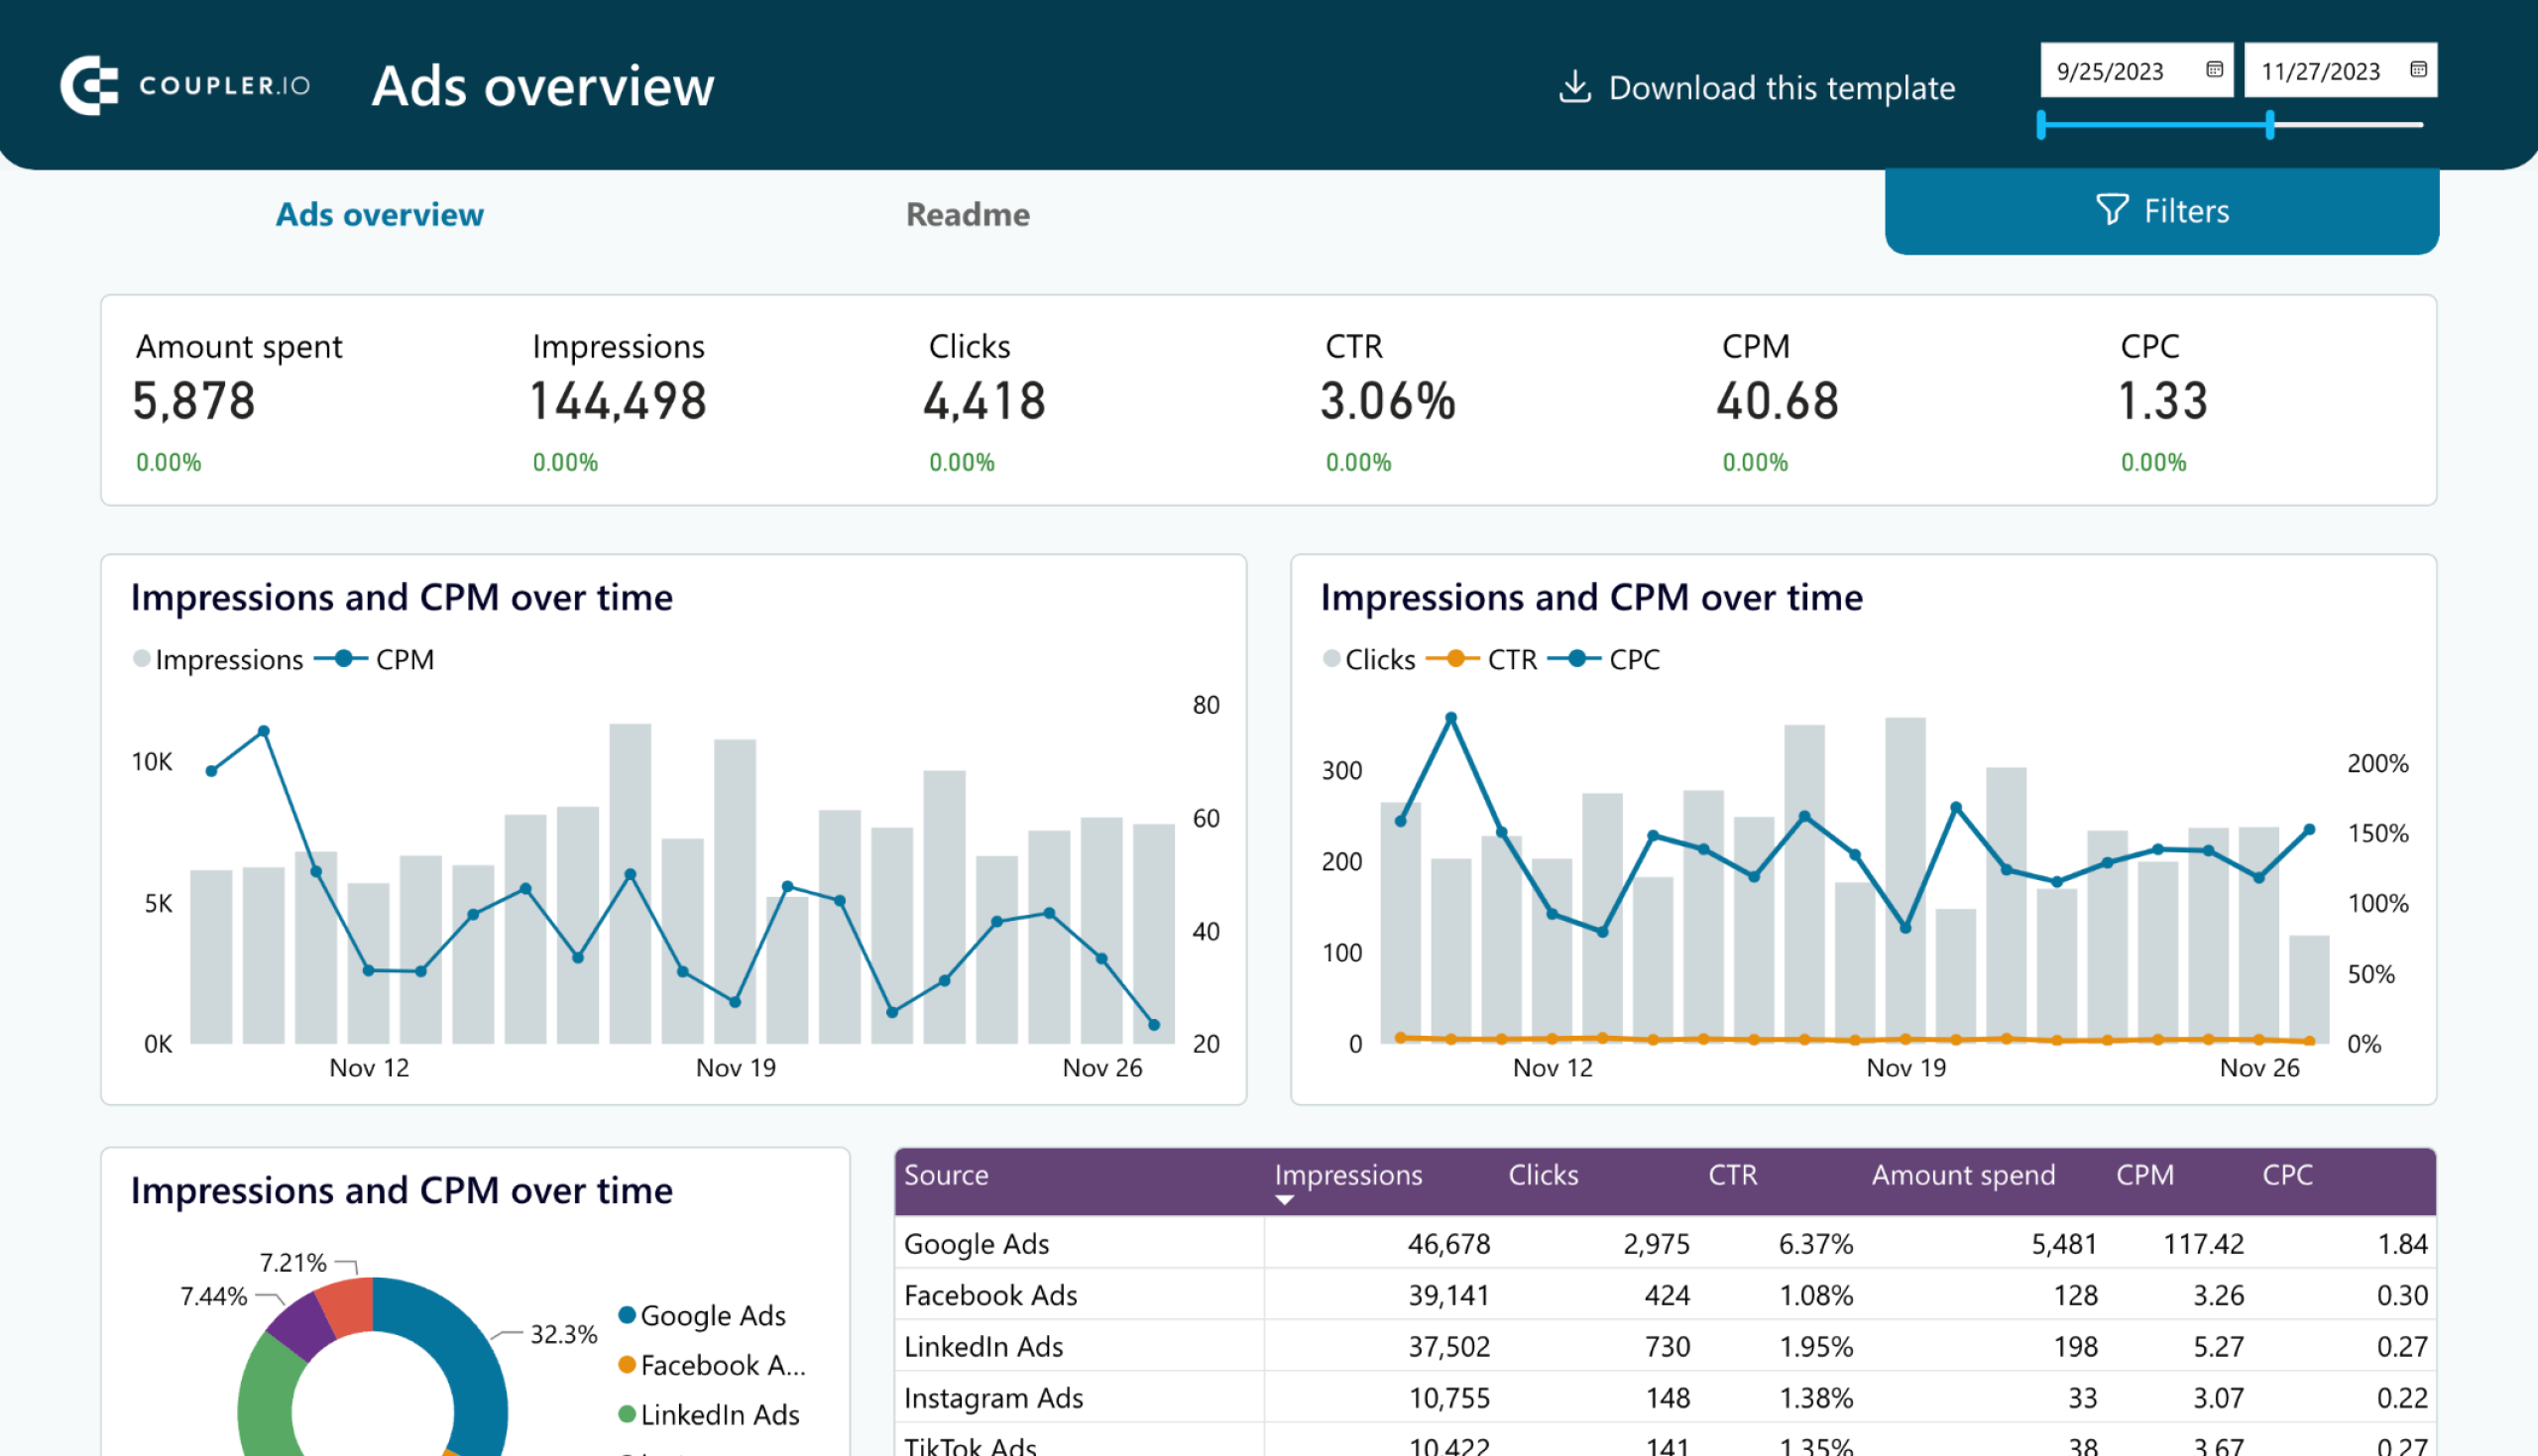
Multi-channel PPC dashboard
The PPC multi-channel dashboard lets you analyze your social media advertising performance across platforms. You can compare data from X, LinkedIn, Meta, Quora, and TikTok Ads, as well as non-social media platforms like Google and Microsoft Ads.
Here’s what you can do with this template:
- Filter data by date: Monitor performance fluctuations over time. This will help you understand how seasonal trends or changes affect your social media marketing campaigns.
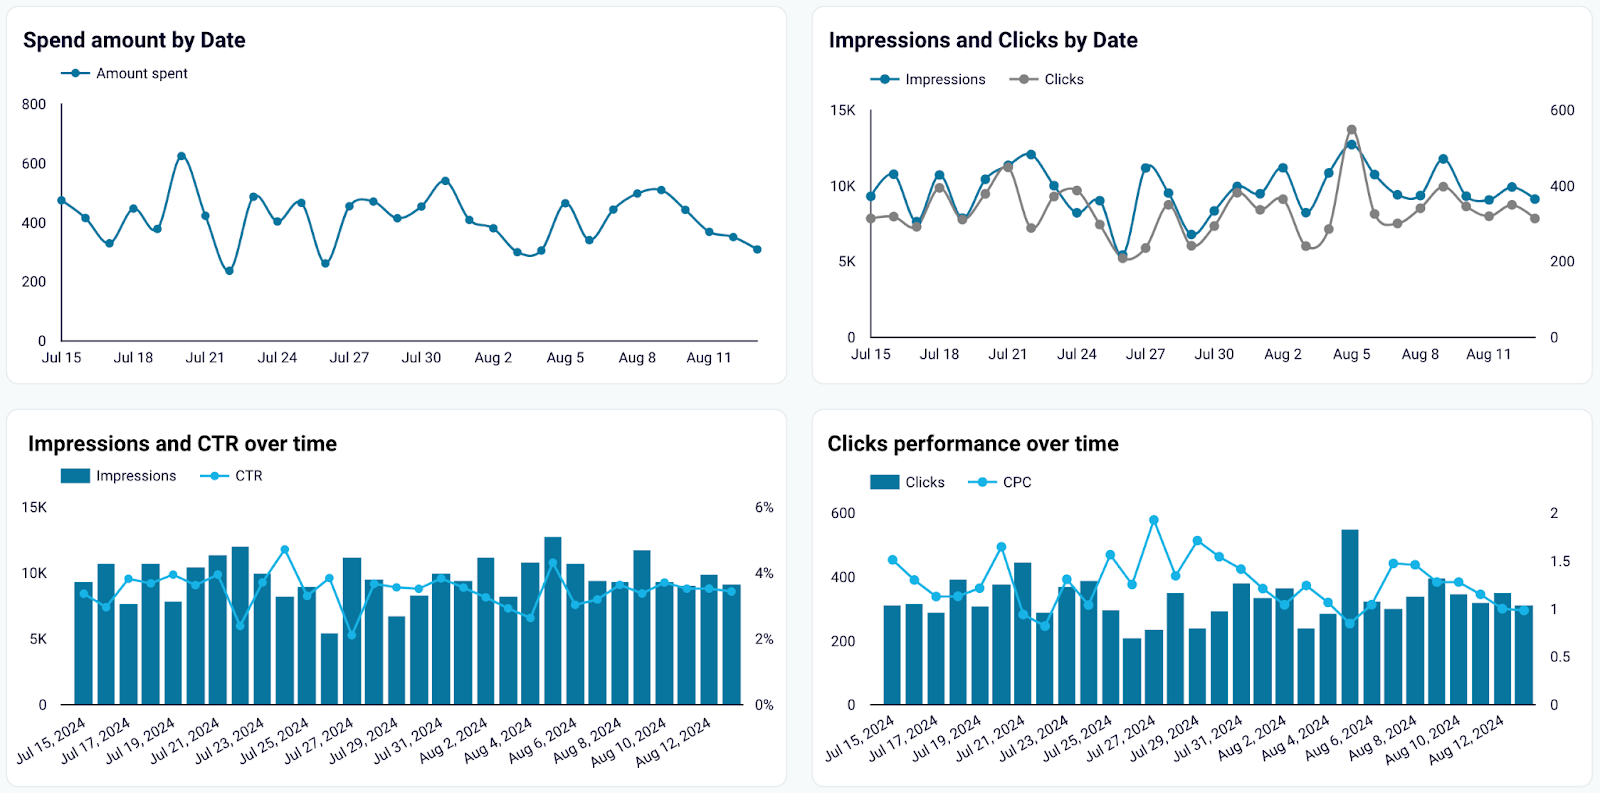
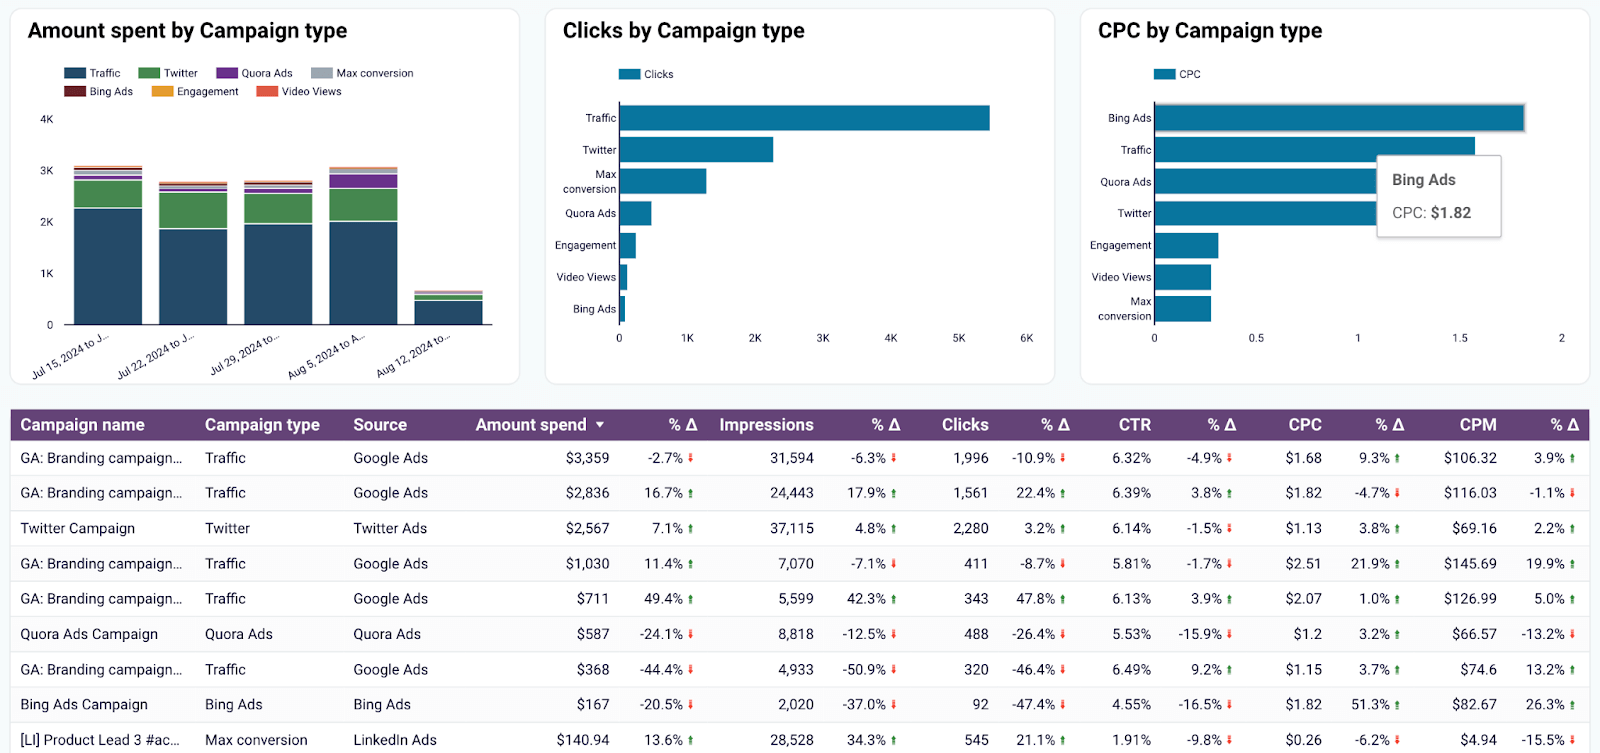
- Control key spending metrics: Track your spending, including cost per click and cost per mille. This will keep you updated about your advertising budget and help evaluate the cost efficiency of your campaigns.

- Analyze social media channels’ performance: Define how well each ad platform performs. Compare critical metrics like click-through rates and impressions to measure each channel’s effectiveness.
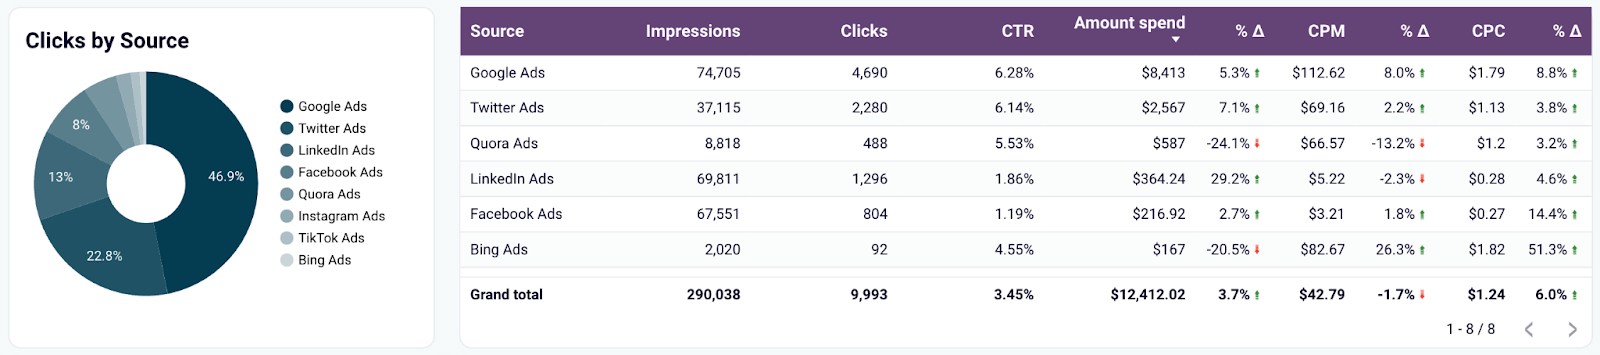
- Compare campaigns: Determine which campaigns generate the highest social media ROI by analyzing their performance side-by-side.
This dashboard is available in Coupler.io UI and as a template in Google Sheets, Looker Studio, Power BI, and Tableau. Go to the Readme/Setup guide to discover how to connect your ad accounts to the dashboard.
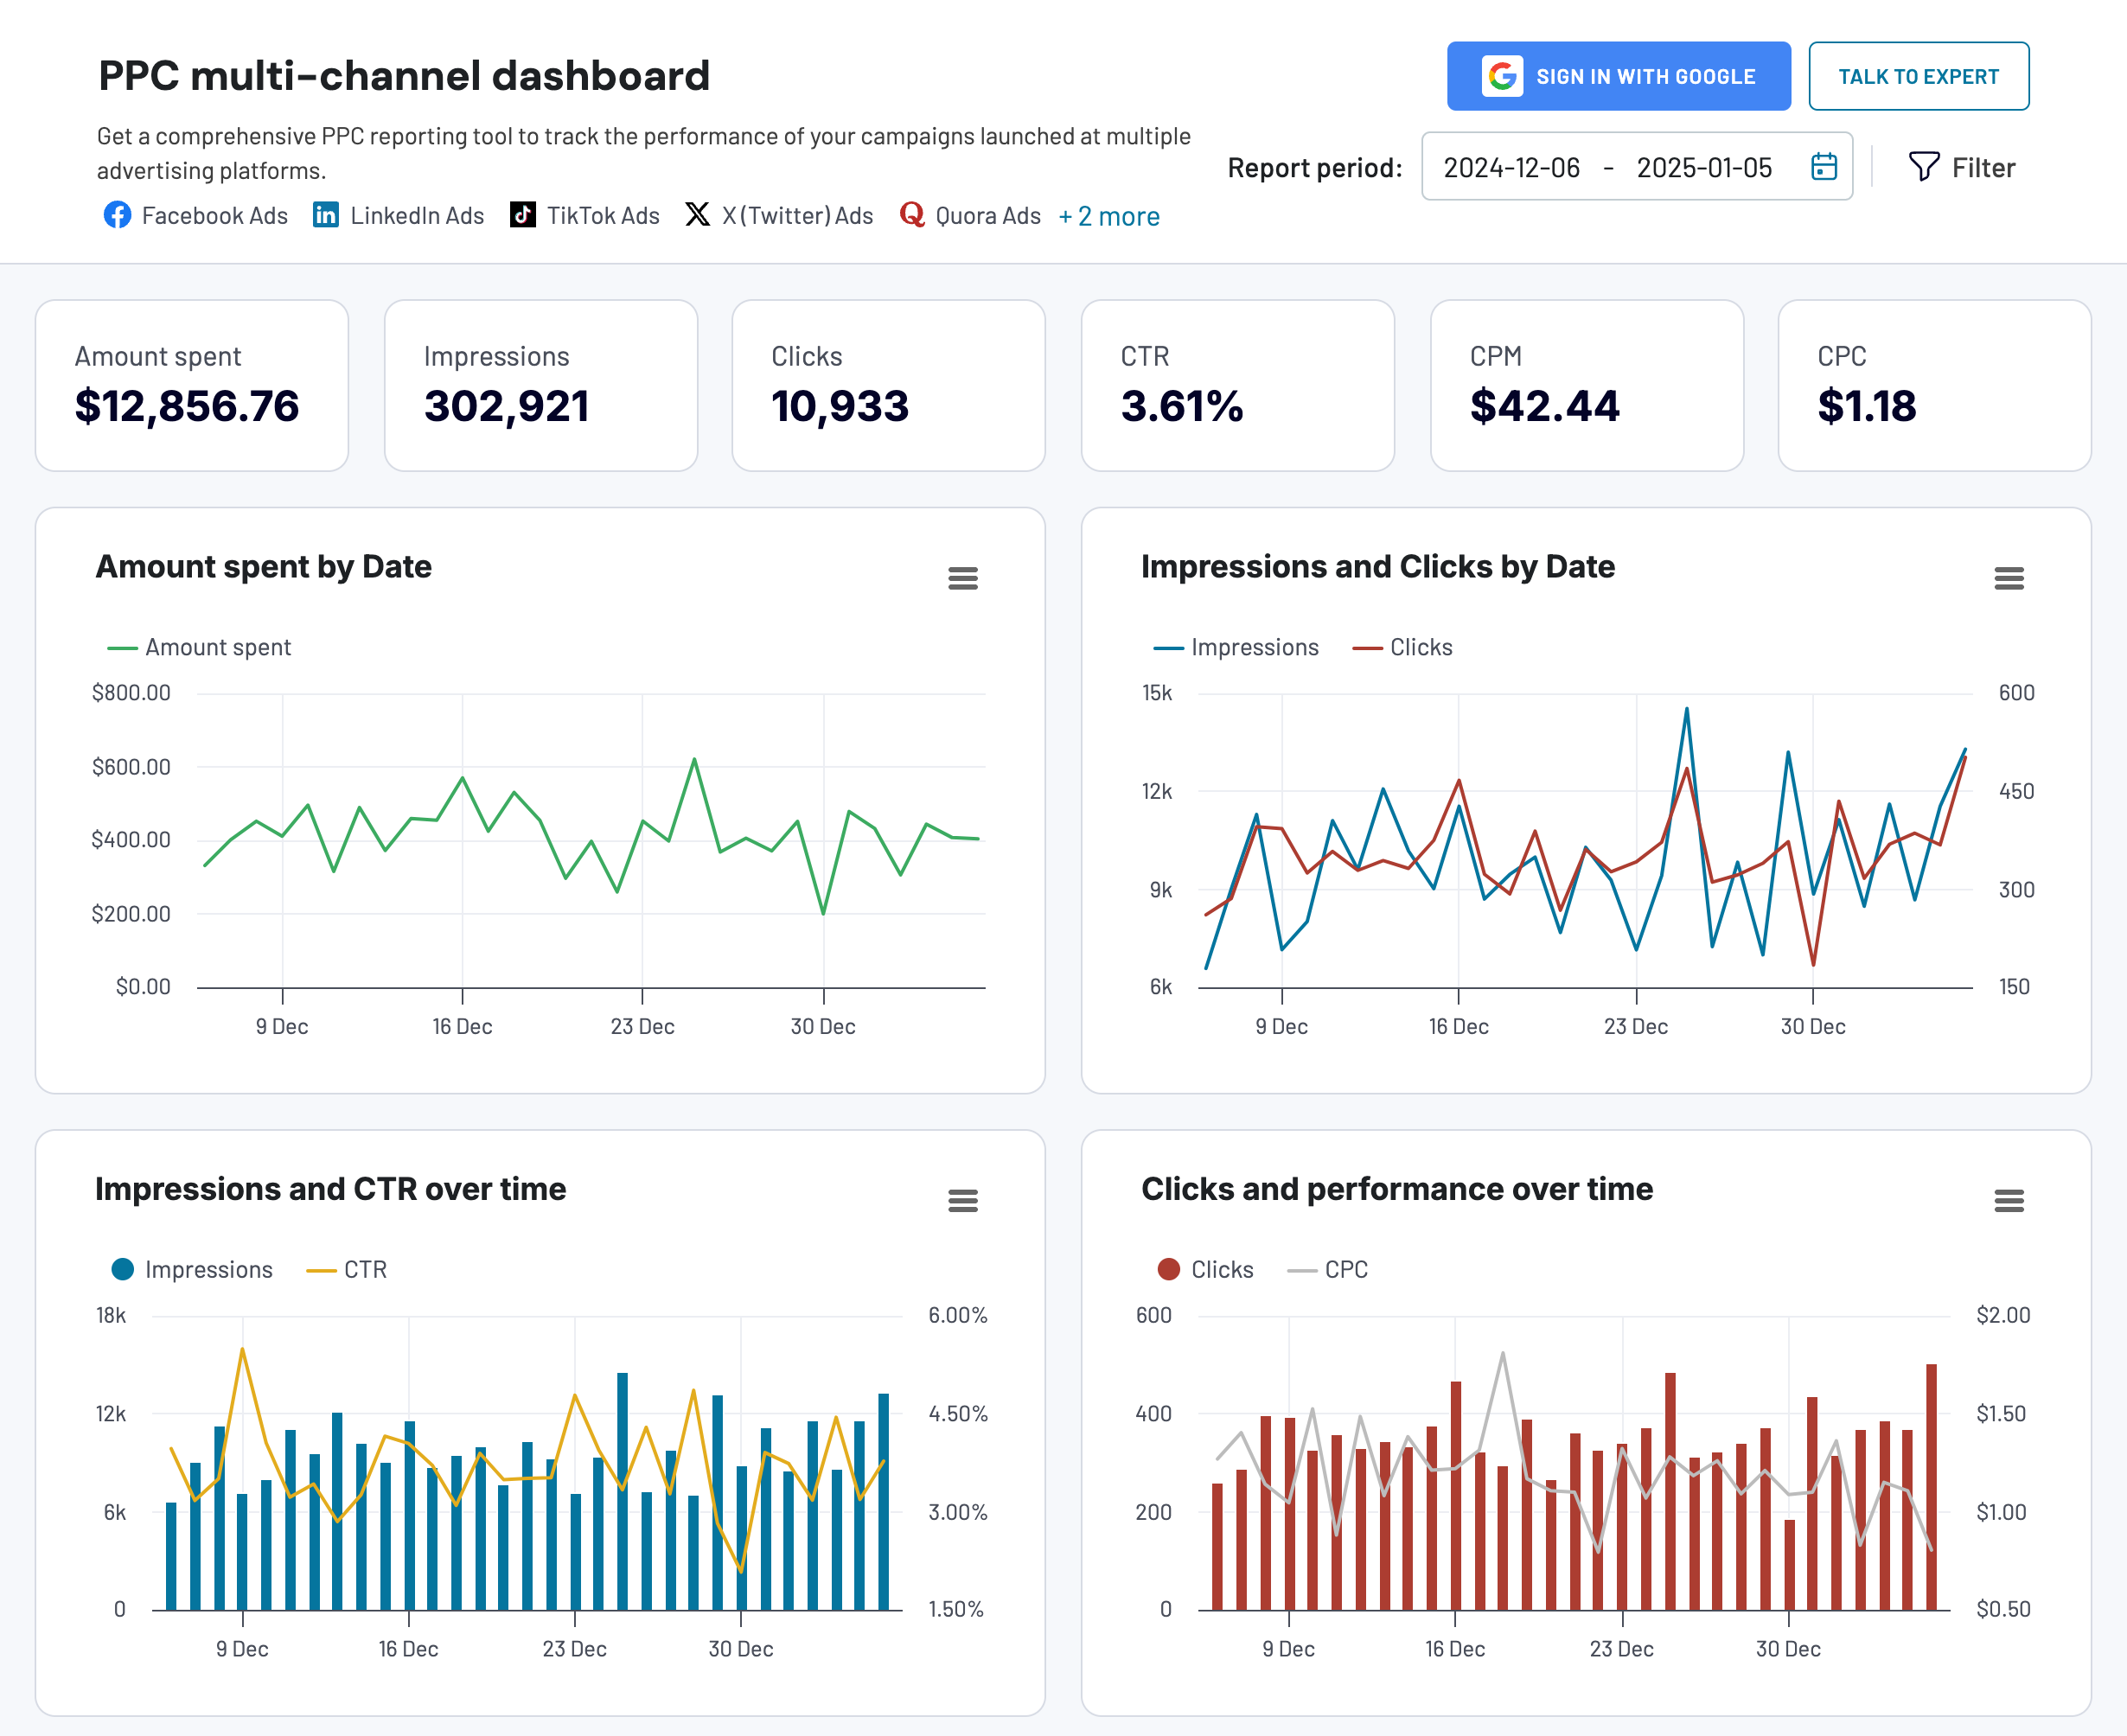
PPC multi-channel dashboard
Consolidate data from multiple advertising platforms including Google, Facebook, LinkedIn, TikTok, and more to track campaign performance, analyze spend efficiency, and optimize your PPC budget allocation across channels.


PPC multi-channel dashboard in Google Sheets
Use a PPC dashboard designed for Google Sheets to track the performance of your campaigns across multiple advertising platforms.

PPC multi-channel dashboard in Looker Studio
Get a comprehensive PPC reporting tool to track the performance of your campaigns launched at multiple advertising platforms.
PPC multi-channel dashboard in Power BI
Use a Power BI PPC dashboard for tracking and analyzing your advertising campaigns across multiple platforms.


PPC multi-channel dashboard in Tableau
Track and analyze the performance of your advertising campaigns across various platforms using a one-stop PPC dashboard in Tableau

Facebook Ads & brand awareness
This report template in Looker Studio allows you to compare social media ad impressions with branded search impressions from Google Search Console (GSC). This way, you can see how often users search for your brand name or related keywords after interacting with your ads.
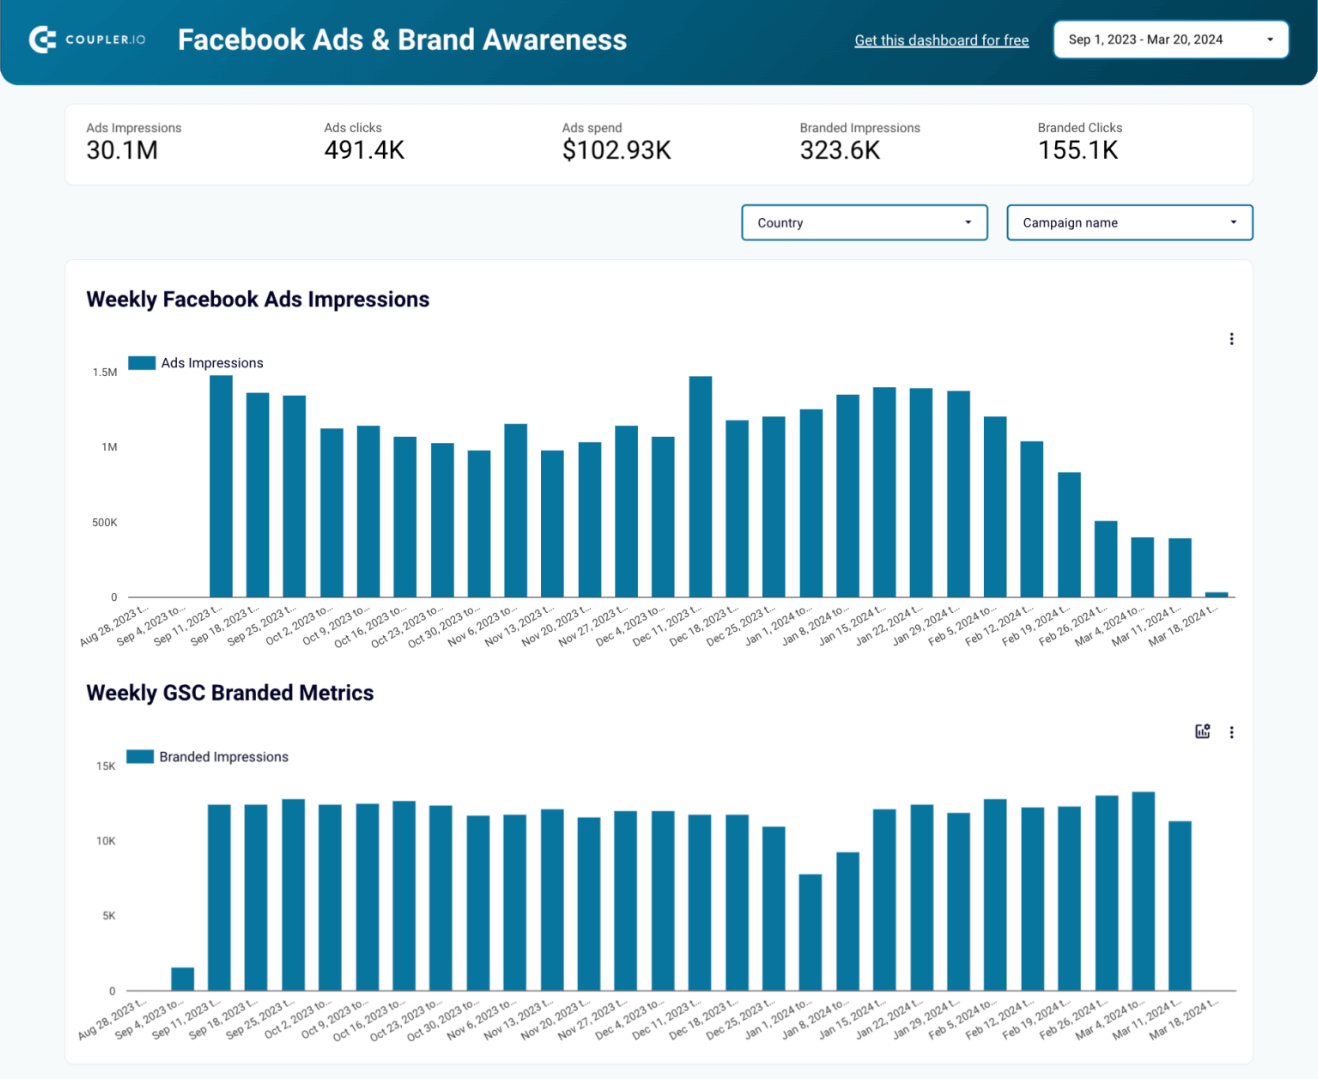
You can use this template for the following purposes:
- Assess brand awareness globally: Measure the worldwide impact of the ad campaigns you run for global brands. Choose the period you’re interested in and compare the graphs.
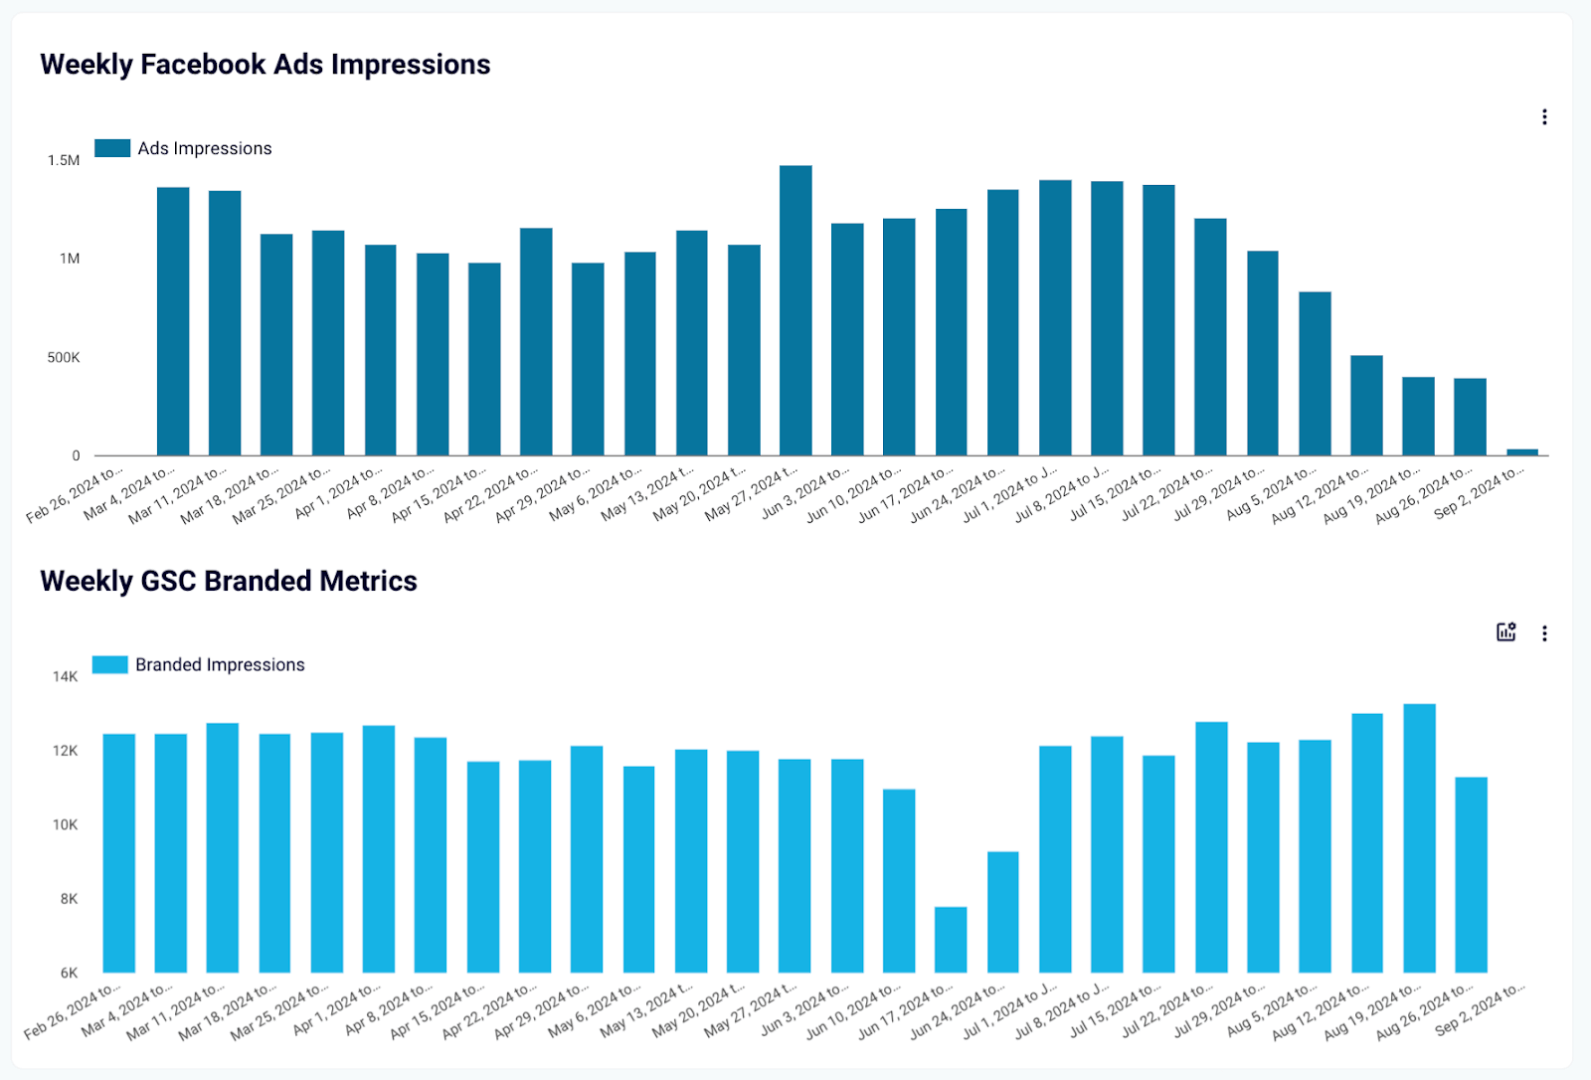
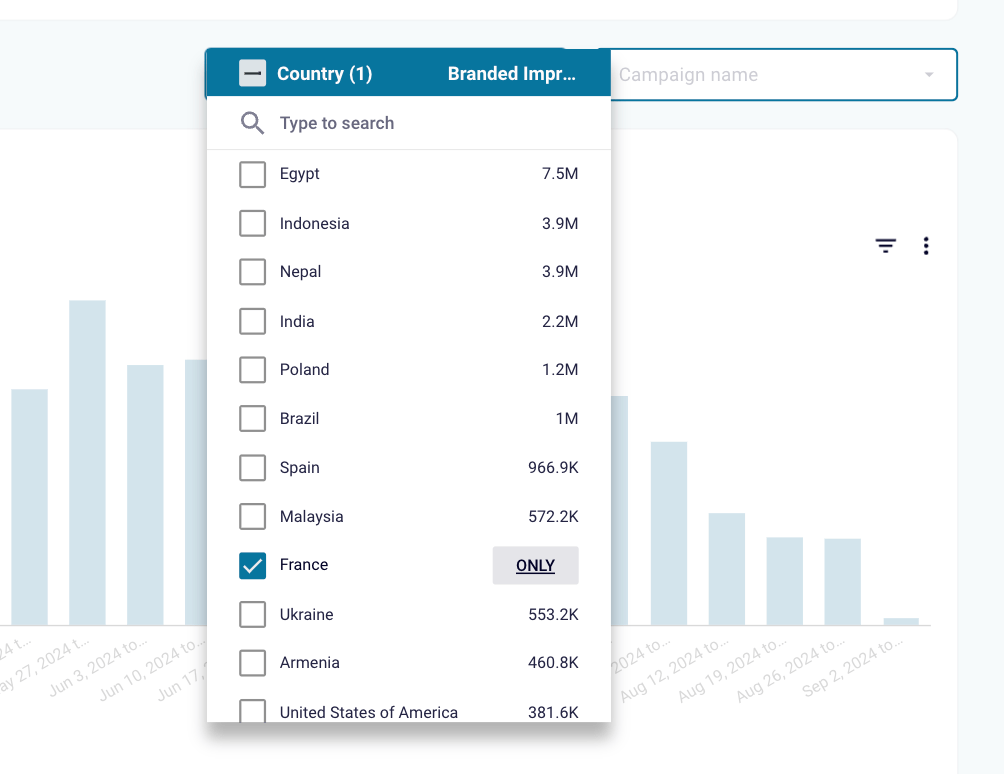
- Monitor trends by country: For smaller brands, use filters to select the countries where your major campaigns are running and explore correlations.
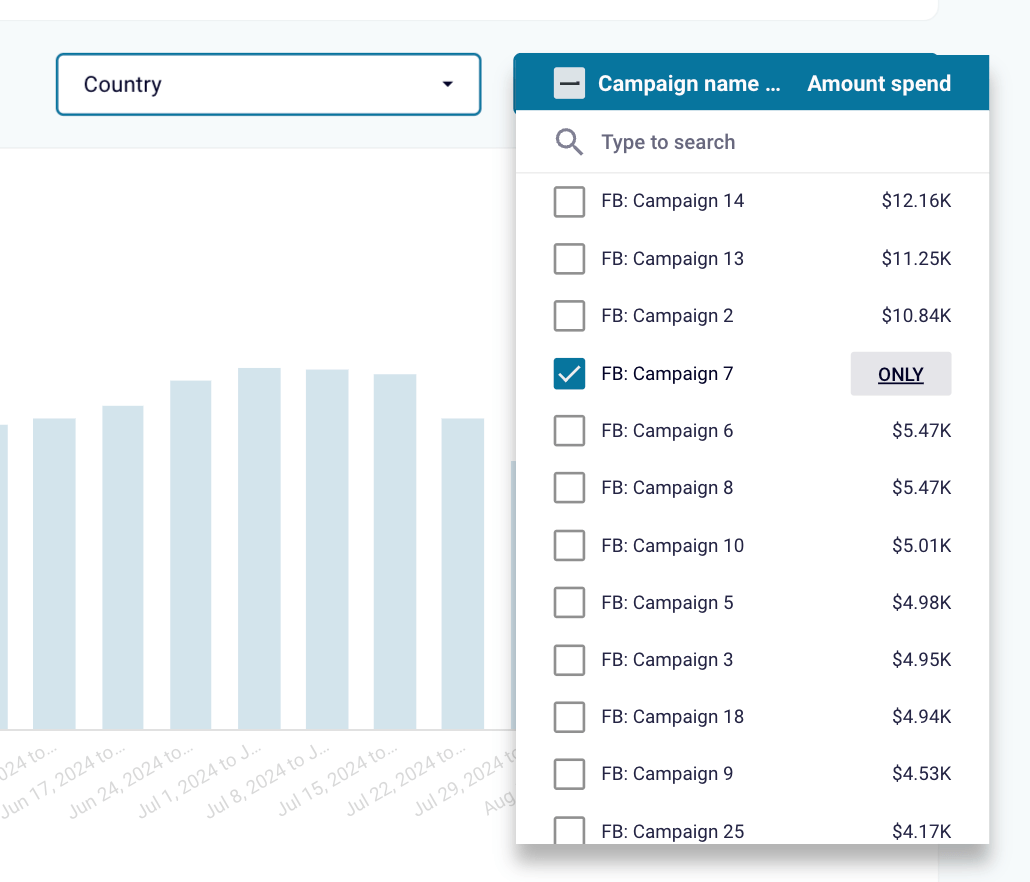
- Identify the best social media campaigns: Filter data by campaign to assess each one’s impact on brand awareness. Reallocate your budget to the top performers, examine their success factors, and apply these most effective practices to your other campaigns.
Visit the Readme tab to learn how to connect your Facebook Ads and GSC accounts to begin reporting.
If you’d prefer to build a report from scratch rather than use prebuilt templates, consider the following toolset:
Coupler.io
Coupler.io allows you to create reports based on data from multiple social media platforms. Supported options include Facebook, Instagram, LinkedIn, TikTok, YouTube, and Vimeo. You can also merge cross-platform data into one report and organize it by filtering, sorting, or rearranging columns. Once ready, import the report into applications like Google Sheets or Looker Studio. Additionally, Coupler.io refreshes reports on a schedule, keeping them in sync with the source data.
Looker Studio
Looker Studio is a BI tool for building dashboards that transform raw data into actionable insights. It lets you create various data visualizations, such as line, bar, pie charts, geo maps, area graphs, bubble graphs, and pivot tables. Social media dashboards can also be more interactive with viewer filters and date range controls, among other features.
Google Sheets
Google Sheets is an application that helps you organize and analyze your data in spreadsheets. Here, you can add, edit, and format spreadsheet items, as well as apply formulas and functions. If you want to make reports easier to digest, it’s possible to visualize your data using charts, graphs, and tables.
In addition to the tools listed above, there is specialized social media reporting software. Let’s explore this next.

Hootsuite
Hootsuite is a tool for cross-platform social media reporting. It allows you to track key metrics such as engagement, clicks, and follower growth, as well as create customized reports. Additional features include ROI tracking, competitive analysis, team productivity monitoring, etc.

Sprout Social
Sprout Social provides detailed analytics across multiple social media platforms. When it comes to reporting capabilities, you have both templated and customizable options. This gives you the flexibility to generate presentation-ready reports for stakeholders. Furthermore, the Advanced Listening tool reveals details like audience demographics and campaign performance. You can also use influencer tracking features to test social media partnerships.

Buffer
Buffer enables you to compile essential social media metrics into a single custom report. You can download this report and share it with CEOs and other stakeholders. Buffer also provides automated suggestions for the best times to post and the most effective content strategy.

Hypefury
Hypefury simplifies content creation and distribution through its gallery of top-performing posts. These posts can be further customized for sharing across platforms like Instagram and LinkedIn. You can also use AutoDM (direct messaging) campaigns to generate inbound leads. Another helpful feature is Just One Click, which converts text posts into images or videos.

PromoRepublic
PromoRepublic offers a full-service social media management solution. What sets it apart is its vast library of ready-made posts and handcrafted templates optimized for various industries. Integrated photo stocks and automated posting schedules help your content reach its audience at the right time. Additionally, the platform’s white-label reporting feature allows you to generate branded reports.

CoSchedule
CoSchedule is an all-in-one content scheduler. It brings together your social media posts, blog content, and events in one place. The ReQueue feature automatically fills gaps in your schedule with optimized posts. Additionally, the tool allows you to create, customize, and share analytics reports on your campaign performance.

Rival IQ
Rival IQ delivers insights through its social media benchmarking and competitor analysis tools. It helps you compare your brand’s performance with that of your competitors by reviewing key metrics. With post analysis and social listening, you’ll see which types of content perform best and when competitors boost their posts. You can also perform social media audits using a dedicated template.

BuzzSumo
BuzzSumo tracks competitors, brand mentions, and industry updates. You can use it to set up alerts and monitor competitor activities. The tool also keeps you updated on new backlinks as they appear and PR campaigns. This helps you make data-driven decisions and maintain a competitive edge.
Building client trust: Social media reporting examples for influencers and agencies
Transparent reporting contributes to a trustworthy relationship between an agency or influencer and clients.
Imagine you’re an influencer looking to promote brands. In that case, you can use the dashboard to present your stats to advertisers and prove your value as a marketing investment.
If your agency manages clients’ social media accounts, you need to report on your results. So, it’s better to have an easy-to-access automated dashboard that shows your progress and achievements.
Whatever your role in social media marketing, try Coupler.io’s free report templates and watch your data transform into insights!
Automate reporting with Coupler.io’s report template
Get started for free