Supermetrics is an excellent solution for automating data flow. Various groups of users, however, try it out and decide to look for a Supermetrics alternative. Why?
Pricing is a common reason, as Supermetrics is among the most expensive tools on the market. Other reasons include the lack of certain features, a clumsy interface, and subpar support.
There are plenty of alternatives out there that answer all these issues with Supermetrics. Check out our guide, where we compare them in detail.
What are the Supermetrics alternatives?
This article covers five apps offering features similar or identical to Supermetrics. Some are more affordable, others compete against Supermetrics with their extensive features. Let’s start with a quick breakdown of key features, then we’ll cover more details on each tool in the next chapter.
| Features | Supermetrics | Coupler.io | Funnel.io | Adverity | Fivetran | Windsor.ai | Stitch |
|---|---|---|---|---|---|---|---|
| Free trial | ? 14-day | ? 7-day | ? Tailored to your needs | ? Demo only | ? 14-day | ? 30-day | ? 14-day |
| All data sources in all plans | ? | ? | ? | ? | ? | ? | ? |
| Data union from multiple sources | ? | ? | ? | ? | ? | ? | ? |
| Data transformation | Custom fields Dynamic currency conversion Naming conventions decoding Data blending | Column management Filter Sort Custom calculations Data aggregation Data unification (append & join) | Field mapping Data type normalization Automatic currency conversion Data blending | Data mapping Create/edit columns Translation and currency conversion enrichment AI-powered custom scripts Data aggregation | dbt core integration Data aggregation Data blending Data blocking & column hashing Filtering, sorting, etc. | Custom fields Filtering Data blending | Data mapping Sort Data aggregation Custom calculations Data blending |
| Prebuilt transformation and dataset templates | ? | ? | ? | ? | ? | ? | ? |
| Data destinations | BI tools Spreadsheets | BI tools Spreadsheets Databases | BI tools & spreadsheets Analytics platforms Data warehouses | BI tools and spreadsheets Databases CRMs Social advertising & analytics platforms | Data warehouses Data lakes Databases | BI tools Spreadsheets Data warehouses | Data warehouses Analysis tools |
| Min. refresh frequency | Every hour | Every 15 min | Every hour | Every 15 min | Every 1 min (Enterprise & Business Critical plans only) | Every hour | Every 30 min |
| Dashboard templates | 100+ | 100+ | 19 | ? | ? | 100+ | ? |
| AI capabilities | AI-powered custom fieldsQuery Insights | AI Insights MCP server | Quick Explore AI-powered analytics | AI-powered custom fields Query Insights | FivetranChat | Multi-touch attribution models Budgetoptimizer | ? |
| Quality of support (G2 & Capterra) | 7.8/10 3.7/5 | 9.7/10 4.9/5 | 9.2/10 4.6/5 | 9.0/10 4.5/5 | 8.0/10 4.6/5 | 9.1/10 4.0/5 | 8.7/10 3.5/5 |
| Pricing starts at: | $29 | $24 | Custom | Custom | $500 (usage-based) | $19 | $100 |
Supermetrics pricing plans are destination-based and start at $29 for a Looker Studio integration.
Supermetrics alternatives in detail
Now, let’s cover each Supermetrics alternative in more detail.
Coupler.io
Coupler.io is a reporting automation platform to turn raw data into insightful reports. It allows you to pull data from 70+ sources that include marketing apps, financial software, social media and advertising tools, CRM systems, and more. The platform is widely used for analytics, data sharing, and backup.
With Coupler.io, you can create custom reports on the go and load them into spreadsheets, BI tools, and data warehouses. And there is no limitation for the number of sources and destinations you user based on the selected subscription plan.
All sources and destinations are accessible to every user on any pricing plan.
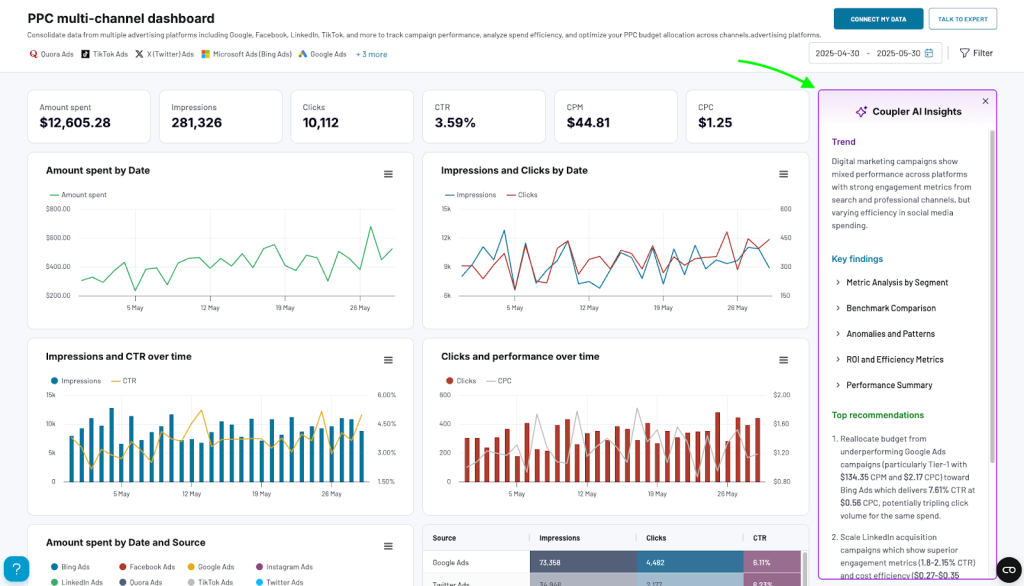
For immediate insights into your data without building reports yourself, Coupler.io offers a library of dashboard templates for PPC, finance, sales, ecommerce, social media, and more. They are designed in Looker Studio, Google Sheets, Power BI, and Tableau. At the same time, Coupler.io also offers built-in visualization to turn data into dashboards without external tools. These templates are equipped with AI Insights, an optional feature that analyzes your data with the click of a button. The summary reveals key trends, highlights areas of concern, and suggests next steps for optimization.
You can automate data exports on your chosen schedule to keep your reports in sync with the latest updates from the source. Coupler.io also supports incoming and outgoing webhooks, which let you set up chains of imports or trigger predesigned actions outside the platform.
The subscription plans are tailored for users with different exporting needs, and the pricing starts from $24/month when billed annually. You can start using Coupler.io for free to check out all the available features and integrations!
| Feature | Coupler.io | Supermetrics |
| Free trial | ? 7-day | ? 14-day |
| All data sources in all plans | ? | ? |
| Data union from multiple sources | ? | ? |
| Data transformation | Column management Filter Sort Custom calculations Data aggregation Data unification (append & join) | Custom fields Dynamic currency conversion Naming conventions decoding Data blending |
| Prebuilt transformation and dataset templates | ? | ? (data blending templates) |
| Data destinations | BI toolsSpreadsheetsDatabases | BI tools and spreadsheets |
| Min. refresh frequency | Every 15 min | Every hour |
| Dashboard templates | 100+ | 100+ |
| AI capabilities | AI Insights MCP server | AI-powered custom fieldsQuery Insights |
| Quality of support (G2 & Capterra) | 9.7/10 4.9/5 | 7.8/10 3.7/5 |
| Pricing starts at | $24/month | $29/month |
Why is Coupler.io better than Supermetrics: Coupler.io shines with its beginner-friendly setup, high-rated support, and no-code transformations you can do on the fly. There are also no limitations on data sources across plans – all 60+ are available from day one.
When to use Coupler.io over Supermetrics: Opt for Coupler.io when you need a robust, cost-effective tool for ETL and reporting automation. It’s built for growing teams who value speed and simplicity in their data operations.
Funnel.io
Funnel is a marketing data analytics platform that stands out from the rest of Supermetrics’ competitors with its impressive list of integrations – currently, Funnel can fetch data from over 590 marketing platforms. If the one you’re after is missing, they promise to build it for you (available with Business and Enterprise plans).
Funnel collects the raw data in an automated manner, transforms it according to your requirements, and delivers it to data warehouses, spreadsheets, or data visualization tools. Simultaneously, Funnel stores your data for up to two years after collection, so you can easily pull up historical numbers if you wish.
In terms of pricing, Funnel is on the rather expensive end of the spectrum. Custom prices start from approximately $120 – $360 with a limited set of features and number of users.
| Feature | Funnel.io | Supermetrics | Coupler.io |
| Free trial | ? Tailored to your needs | ? 14-day | ? 7-day |
| All data sources in all plans | ? | ? | ? |
| Data union from multiple sources | ? | ? | ? |
| Data transformation | Field mapping Data type normalization Automatic currency conversion Data blending | Custom fields Dynamic currency conversion Naming convention decoding Data blending | Column management Filter Sort Custom calculations Data aggregation Data unification (append & join) |
| Data destinations | BI tools and spreadsheets Analytics platforms Data warehouses | BI tools and spreadsheets | BI tools Spreadsheets Databases |
| Min. refresh frequency | Every hour | Every hour | Every 15 min |
| Dashboard templates | 19 | 100+ | 100+ |
| AI capabilities | Quick Explore AI-powered analytics | AI-powered custom fields Query Insights | AI Insights MCP server |
| Marketing forecasting & incrementality measurement | ? | ? | ? |
| Quality of support (G2 & Capterra) | 9.2/10 4.6/5 | 7.8/10 3.7/5 | 9.7/10 4.9/5 |
| Pricing starts at | Custom | $29/month | $24/month |
Why Funnel.io is better than Supermetrics: Funnel.io stands out as a centralized ‘data hub,’ allowing you to connect, transform, model, and store data in a single interface. Compared to Supermetrics, it also offers a wider variety of destinations and advanced no-code transformations.
When to use Funnel.io over Supermetrics: Funnel.io is the smarter option when you manage complex, multi-channel campaigns, and you need a tool that will enable you to clean, unify, and explore the data before it reaches the reporting destination.
Adverity
Adverity is a data integration platform that collects data, transforms it for you, and then loads it into available destinations, including databases, analytical, and visualization platforms. The platform can fetch data from over 600 data sources, including almost all Supermetrics connectors.
Adverity’s power lies in its AI-powered transformation capabilities. Built-in algorithms clean and convert the data into the desired format and flag any suspicious patterns that may require your attention. The platform also facilitates field mapping and data consolidation, making it easy to combine imports from different sources.
Adverity doesn’t have fixed pricing, and each case is discussed individually. There is also no free trial available. However, when searching online, you may come across a statement from their staff indicating that pricing starts from $1,500, with more complex integrations likely coming with a much higher price tag.
| Feature | Adverity | Supermetrics | Coupler.io |
| Free trial | ? Demo only | ? 14-day | ? 7-day |
| All data sources in all plans | ? | ? | ? |
| Data union from multiple sources | ? | ? | ? |
| Data transformation | Data mapping Create/edit columns Translation and currency conversion enrichment AI-powered custom scripts Data aggregation | Custom fields Dynamic currency conversion Naming conventions decoding Data blending | Column management Filter Sort Custom calculations Data aggregation Data unification (append & join) |
| Prebuilt transformation or dataset templates | ? | ? (data blending templates) | ? |
| Data destinations | BI tools and spreadsheets Databases CRMs Social advertising and analytics platforms | BI tools and spreadsheets | BI tools Spreadsheets Databases |
| Min. refresh frequency | Every 15 min | Every hour | Every 15 min |
| Dashboards templates | None | 100+ | 100+ |
| AI capabilities | Transformation copilot Data quality suite Data conversations (Beta) | AI-powered custom fields Query Insights | AI Insights MCP server |
| Quality of support (G2 & Capterra) | 9.0/10 4.5/5 | 7.8/10 3.7/5 | 9.7/10 4.9/5 |
| Pricing starts at | Custom | $29/month | $24/month |
Why Adverity is better than Supermetrics: What Adverity lacks in dashboard templates and ease-of-use, it makes up for in stellar customer support, extensive AI capabilities, and an impressive array of transformation options – all available within the app itself.
When to use Adverity over Supermetrics: Choose Adverity if you regularly handle large volumes of complex, multi-source data. The platform’s range of sources, transformations, and destinations promises greater control over data workflows, especially for companies looking to scale their data operations.
Fivetran
Fivetran is an automated data movement platform designed for teams managing complex data and AI workflows. It has all the functionality of a typical ETL tool, but with more advanced transformation features and fewer destinations.
Fivetran allows you to connect data from over 700 sources – almost 5x the amount offered by Supermetrics. Unlike many other competitors on this list, it provides connectors for several enterprise databases and ERPs, such as Oracle, SAP, NetSuite, SQL Server, and more.
When it comes to transformations, Fivetran offers quickstart data models for a number of different sources, including Facebook Ads, HubSpot, Xero, and others. Multi-source models (e.g., Ad Reporting Model) aggregate data from related sources, allowing you to create insightful tables without the need for manual organization. To perform custom transformations, you can use the platform’s robust dbt Labs integration. However, this approach requires SQL and dbt skills, so it’s not convenient if you only want to build basic marketing reports.
Fivetran integrates with data warehouses and data lakes, such as Snowflake, BigQuery and Microsoft OneLake. Pricing is based on the number of monthly active rows (MAR) and monthly model runs (MMR). A free plan (up to 500K MAR and 5K MMR) and a 14-day trial are available.
| Feature | Fivetran | Supermetrics | Coupler.io |
| Free trial | ? 14-day | ? 14-day | ? 7-day |
| All data sources in all plans | ? | ? | ? |
| Data union from multiple sources | ? | ? | ? |
| Data transformation | dbt core integration Data aggregation Data blending Advanced data replication Data blocking & column hashing Filtering, sorting, etc. | Custom fields Dynamic currency conversion Naming conventions decoding Data blending | Column management Filter Sort Custom calculations Data aggregation Data unification (append & join) |
| Prebuilt transformation or dataset templates | ? | ? (data blending templates) | ? |
| Data destinations | Data warehouses Data lakes Databases | BI tools and spreadsheets | BI tools Spreadsheets Databases |
| Min. refresh frequency | Every 1 min (Enterprise & Business Critical plans only) | Every hour | Every 15 min |
| Dashboards templates | None | 100+ | 100+ |
| AI capabilities | FivetranChat | AI-powered custom fields Query Insights | AI Insights MCP server |
| Quality of support (G2 & Capterra) | 8.0/10 4.6/5 | 7.8/10 3.7/5 | 9.7/10 4.9/5 |
| Pricing starts at | $500 (usage-based) | $29/month | $24/month |
Why Fivetran is better than Supermetrics: Fivetran is uniquely positioned to serve enterprises with extensive data integration needs and AI/ML workflows, thanks to its engineer-grade flexibility and advanced transformation features.
When to use Fivetran over Supermetrics: If your main priority is to centralize marketing data in storage solutions (e.g., RedShift), automate backups, and prepare data for AI projects, then Fivetran is the obvious choice here. Supermetrics does not provide integrations with data warehouses.
Windsor.ai
Windsor.ai is an AI-powered marketing attribution and data integration platform. It allows you to connect data from over 325 sources to BI tools, spreadsheets, and data warehouses.
Windsor.ai is especially known for its attribution software which provides insight into the customer journey. They use a sophisticated machine-learning algorithm and the Markov model to map multi-touch attribution across online and offline touchpoints. According to their claims, advertisers using their software typically see a 15% – 44% improvement in marketing ROI.
Windsor.ai has an extensive dashboard template gallery designed for destinations like Looker Studio, Excel, and Tableau. However, it lags behind competitors on the transformations side. You can perform operations such as data blending, filtering, and custom field creation, but you will need technical skills to execute more advanced transformations in the destination.
There are 6 pricing tiers, including a free plan that allows you to connect a single source and account. A 30-day free trial is also available.
| Feature | Windsor.ai | Supermetrics | Coupler.io |
| Free trial | ? 30-day | ? 14-day | ? 7-day |
| All data sources in all plans | ? | ? | ? |
| Data union from multiple sources | ? | ? | ? |
| Data transformation | Custom fields Filtering Data blending | Custom fields Dynamic currency conversion Naming convention decoding Data blending | Column management Filter Sort Custom fields and calculations Data aggregation Data unification (append & join) |
| Prebuilt transformation or dataset templates | ? | ? (data blending templates) | ? |
| Data destinations | BI tools Spreadsheets Data warehouses | BI tools and spreadsheets | BI tools Spreadsheets Databases |
| Min. refresh frequency | Every hour | Every hour | Every 15 min |
| Dashboards templates | 100+ | 100+ | 100+ |
| AI capabilities | Multi-touch attribution models Budget optimizer | AI-powered custom fields Query Insights | AI Insights MCP server |
| Quality of support (G2 & Capterra) | 9.1/10 4.0/5 | 7.8/10 3.7/5 | 9.7/10 4.9/5 |
| Pricing starts at | $19 | $29/month | $24/month |
Why Windsor.ai is better than Supermetrics: AI-powered marketing attribution modeling makes Windsor.ai stand out as a Supermetrics competitor. The platform also offers a generous free trial and boasts high customer support scores.
When to use Windsor.ai over Supermetrics: Windsor.ai is the better option when your goal is to blend data for customer journey analysis. Mapping attribution with Supermetrics is virtually impossible as it lacks built-in modeling capabilities.
Stitch
Stitch is an ETL tool that can pick up your data from 140+ source apps and import it on a custom schedule into data warehouses and visualization tools. The platform is strong on data transformation. It integrates with data fabric platform Talend, which can handle things like data mapping, aggregation, enrichment, and more..
Unlike many other Supermetrics competitors, Stitch doesn’t support data imports into visualization tools or spreadsheets. It offers, however, integrations with databases and data warehouses, such as Amazon Redshift, BigQuery, SQL Server, or PostgreSQL.
Pricing for Stitch starts from $100/month and grows along with the size of data you import every month. A 14-day free trial is available.
| Feature | Stitch | Supermetrics | Coupler.io |
| Free trial | ? 14-day | ? 14-day | ? 7-day |
| All data sources in all plans | ? | ? | ? |
| Data union from multiple sources | ? (with Talend Data Fabric) | ? | ? |
| Data transformation | Data mapping Sort Data aggregation Custom calculations Data blending | Custom fields Dynamic currency conversion Naming convention decoding Data blending | Column management Filter Sort Custom fields and calculations Data aggregation Data unification (append & join) |
| Prebuilt transformation or dataset templates | ? | ? (data blending templates) | ? |
| Data destinations | Data warehouses Analysis tools | BI tools and spreadsheets | BI tools Spreadsheets Databases |
| Min. refresh frequency | Every 30 min | Every hour | Every 15 min |
| Dashboards templates | None | 100+ | 100+ |
| AI capabilities | None | AI-powered custom fieldsQuery Insights | AI Insights MCP server |
| Quality of support (G2/Capterra) | 8.7/10 3.5/5 | 7.8/10 3.7/5 | 9.7/10 4.9/5 |
| Pricing starts at | Row-based pricing from $100/month | $29/month | $24/month |
Why Stitch is better than Supermetrics: Like Fivetran, Stitch’s strength lies in its transformation capabilities and data warehouse integrations. The platform provides more customization upfront for teams with complex data needs.
When to use Stitch over Supermetrics: Stitch is the way to go when you need a reliable ELT tool that can help you move large volumes of data into storage infrastructure. It’s also the better choice for technical teams looking to build their own custom connectors.
Stitch, along with Coupler.io, are also considered the best Dataddo alternatives.
Supermetrics vs Coupler.io – the detailed comparison
If you don’t need hundreds of sources and your budget for data automation is limited, then you may end up narrowing down the search a bit. After all, getting something like Adverity to export data from a single Facebook Ads account would be a bit of an overkill.
Users in small and medium-sized businesses often end up choosing between Supermetrics and Coupler.io. Here’s how the two stack up against each other.
Interface
Coupler.io provides a web app where you can set up connections between all sources and destinations. You can start right away by selecting the needed source and destination apps in the form below. Then click Proceed to sign up to Coupler.io for free and create a data flow to automate export.
Optionally, you can use the add-on for Google Sheets to manage the setup from the spreadsheet. However, the web app seems to be the most convenient way to manage your integrations or queries. From it, you can easily toss sources and destinations for your data flows.
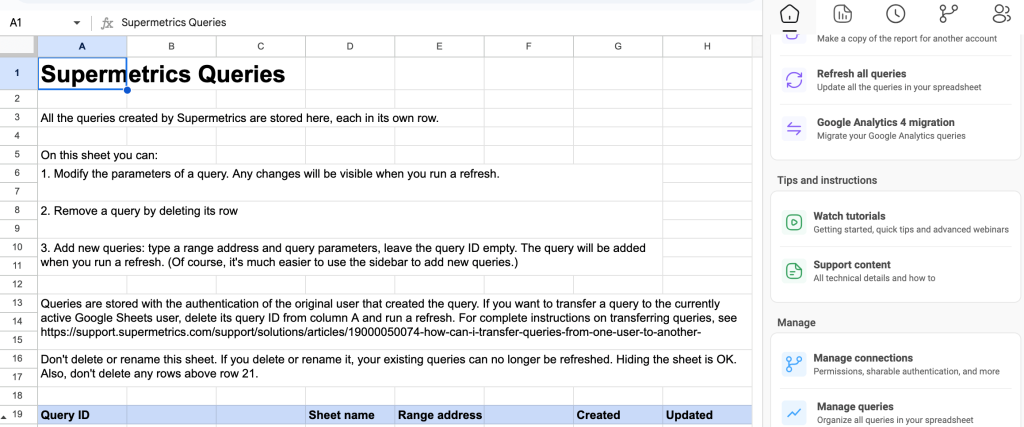
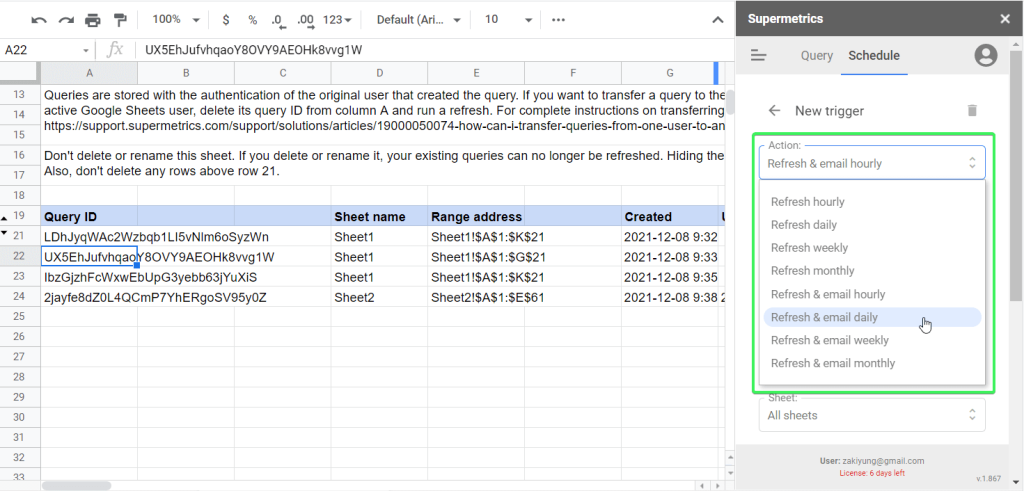
In Supermetrics, you have to install the add-on for Google Sheets. If you want to load data to Excel, then you’ll need to install the Excel add-in. For Looker Studio as the destination, you won’t have to install anything – the connector configuration will be carried out in the browser. Besides, to manage queries in Supermetrics for Google Sheets, you need to manipulate them in a separate tab called Query. For example, to remove a query, you need to delete its row.
Destinations
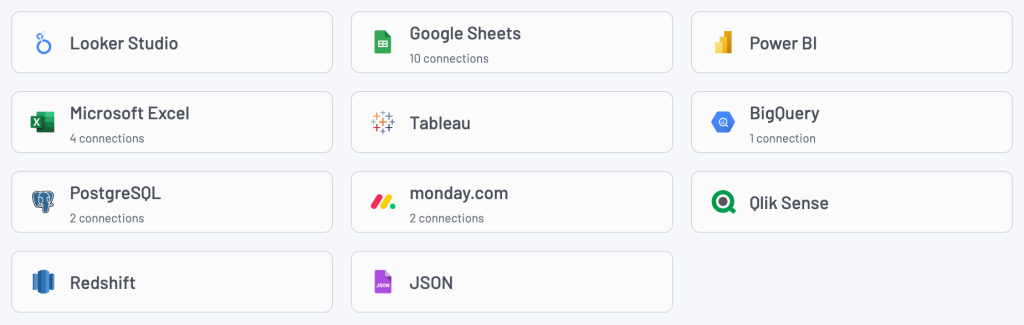
Coupler.io offers the full set of destinations on all plans. You can simultaneously send data to different destinations and even transfer it between such apps. The available destinations include
- Spreadsheet apps: Google Sheets, Microsoft Excel
- Data warehouses: BigQuery, Redshift, PostgreSQL
- BI tools: Looker Studio (formerly Google Data Studio), Power BI, Tableau, Qlik
- Other destinations: Monday.com and JSON
Supermetrics supports four main destinations with publicly available pricing: Google Sheets, Excel, Looker Studio, and Power BI. Other options, such as data warehouses, data lakes, and others, are only accessible with a custom Business plan. This means that you’ll need to send your requirements or questions to the Supermetrics sales team to get a quote for the chosen destination.
| In Supermetrics, you pay separately for every destination where you import the data. | With Coupler.io, you can use all available destinations on any plan, and it won’t affect your bills. |
Sources
Coupler.io supports 70+ data sources, all accessible on any pricing plan by default. They include CRM systems, marketing platforms, accounting tools, and more. In comparison, Supermetrics offers 150+ sources.
However, the number of sources available on most Supermetrics plans is limited. Only Business plan users get all sources out-of-the-box.
Coupler.io users can suggest new sources for production. This is not just a marketing trick – the Coupler.io team does take customers’ suggestions into account. For example, WooCommerce and MySQL data source connectors were initiated by existing Coupler.io users.
Dashboard templates
Coupler.io provides a gallery of pre-built dashboard templates for Google Sheets, Looker Studio, Power BI, and Tableau. Each template has a built-in connector to configure data export from the source through the Coupler.io interface. This way, you get ready-to-use reports without building them from scratch.
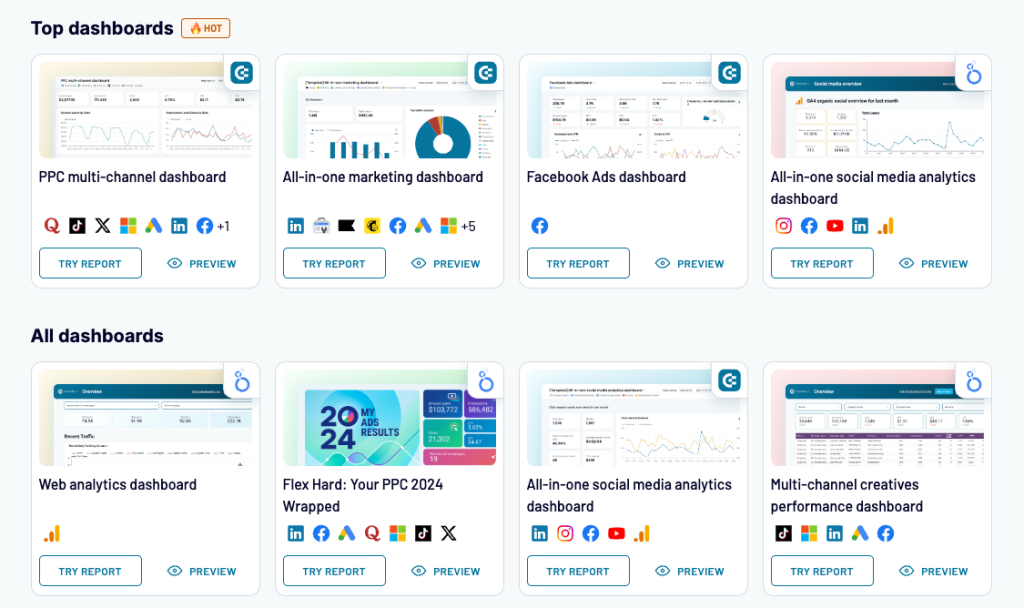
You can also use the native Coupler.io Dashboards feature, an alternative to external BI platforms. It only requires selecting a template, connecting your data sources, and running the dashboard – all without additional connectors or accounts for other tools. Coupler.io Dashboards can also load 500,000 rows in under 10 seconds, are enhanced with the AI Insights feature, and are optimized for mobile viewing.
In comparison, Supermetrics offers white-label dashboard templates for Google Sheets, Excel, Looker Studio, and Power BI. These templates work in conjunction with the Supermetrics connectors installed in each destination platform to pull and refresh data.
Data transformations
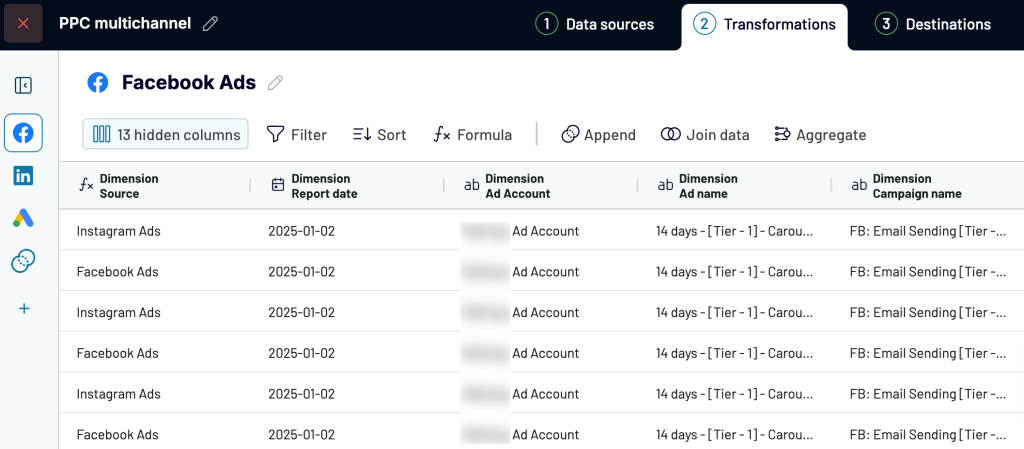
Coupler.io allows you to transform your data before loading it into a destination directly within the app. You can edit, rearrange, hide, or add columns, sort and filter data, create columns with custom formulas, and aggregate data using operations like sum, avg., count, min., or max. If you’ve connected multiple accounts from the same source or different sources, you can blend the data and move it into a single destination file. In a few moments, you’ll be able to see how it works in the interaction form below.
Supermetrics also enables you to merge data from various sources in its UI. Additionally, you can create custom fields to manipulate your data by performing calculations, adding new metrics or dimensions, etc. However, this is available directly in the app only for specific destinations, such as Power BI and data warehouses. For others, like Google Sheets, Excel, and Looker Studio, you’ll need to do it in the destination.
Customizable data refresh schedule
At times, you may be inclined to import your data very frequently to ensure that the information you’re processing is as fresh as possible. Coupler.io allows you to import the data even every 15 minutes, round the clock, 7 days a week. It can be an essential detail in building a self-updating reporting tool or a marketing analytics dashboard.
Supermetrics offers a weekly, daily, hourly, and on-demand data refresh, depending on the plan and destination. You can also set alerts or the report itself to be sent to the email address or Slack/Microsoft Teams channel.
Pricing
Coupler.io offers clear and flexible pricing: If you go to the Coupler.io pricing page, you’ll get a clear picture of what you can have:
- Six subscription options:
- Free
- Personal – $24/month
- Professional – $99/month
- Team – $199/month
- Business – $449/month
- Enterprise – custom price and features
- Easy-to-understand terms for sources, limits, users, etc.
- Monthly/yearly billing cost
Supermetrics pricing depends on your data destination. To pull data into Google Sheets, Excel, Looker Studio, or Power BI, an integration with a single included source, Facebook Ads (+2 of your choice), will cost you $37/month on the Starter plan. If you wish to combine more sources, you’ll pay $199 for the Growth plan or $499 for the Pro plan.
The price list for data warehouses, data lakes, etc., isn’t publicly available since these destinations are only accessible on a custom Business plan. Every time you wish to set up such integration, you’ll need to contact the Supermetrics team directly for an individual quote.
Consultancy services
In addition to Coupler.io plans, you can use the following add-on offerings for consultancy:
- Guided Onboarding ($499 fixed price) – a personalized onboarding session with an expert to integrate your data sources and configure dashboards and metrics for automated updates.
- Data Analytics Service ($99/hour) – one-on-one consultancy with experts for customized reporting.
- Team Plan Bundle ($499/month) – the previously mentioned Team plan combined with 5 hours of the above Data Analytics Service.
In contrast, Supermetrics doesn’t offer any consultancy services.
Supermetrics vs. Coupler.io – how they differ
Now, let’s look at the distinct features of both tools.
Coupler.io features
More frequent data refreshing: Supermetrics provides schedule refresh for their data source connectors up to every hour. Coupler.io, however, allows you to refresh your exported data collection more frequently – every 30 or even 15 minutes! Neither tool supports real-time automated refresh.
Preview and transform: Once you connect a data source or a few of them, you can preview the exported data and make the following adjustments to it:
- Hide columns that contain irrelevant or incorrect information.
- Reorder columns to group related ones or just improve convenience.
- Rename columns with unclear or mismatched names to suit your reporting.
- Change the column type to represent data correctly using the specified format.
- Add calculable columns to calculate values based on existing data.
- Filter data to show specific subsets based on certain criteria.
- Sort data in ascending or descending order.
- Aggregate – reveal key insights of your data by performing operations like sum, avg., count, min., or max. on specific columns to bring the results to the destination file.
See it works:
Combine data sources into one: With Coupler.io, you can pull data from multiple accounts or even different source apps at the same time and bring it all into a single destination file. For example, you could be fetching advertising reports from different platforms into a single file for easy comparison. Or merging data from across different spreadsheets into a master view. Do this in any of the following ways:
- Append – merge datasets with similar structures and columns matched by name.
- Join – combine datasets with different structures and at least one matched column
Supermetrics features
Scheduled report updates via email: In Supermetrics, you can not only set up an automatic refresh of your queries but also get the updated reports to your email or Slack/Microsoft Teams channel.
Like in Coupler.io, you can get an email notification if any of your scheduled queries fail to be completed.
Filters: Supermetrics allows you to filter the end results of your query. Basically, you can choose a field, a logical operator (EQUALS, CONTAINS, etc.), and a value to filter by.
Highlighting: You can highlight the highest or lowest values with green and red colors, as well as apply the scale – red-white-green or red-yellow-green. Of course, it’s also possible to do this in the destination, for example, through conditional formatting in Google Sheets. However, it’s generally more convenient to highlight values within the Supermetrics app interface.
Coupler.io functionality overview
Lastly, let’s see how Coupler.io actually works and why it’s a viable Supermetrics competitor.
You can sign up to Coupler.io with your custom email or Google, Microsoft, or Xero account, so no additional installation is needed. However, if you wish, you can install the Coupler.io add-on for Google Sheets and work with the configuration right from your spreadsheet.
Unlike Supermetrics, where you create queries, in Coupler.io, you work with data flows. A data flow is an integration between a source and a destination. In some Supermetrics alternatives, these are named data source connectors.
After signing in to Coupler.io, click the + Create button. You’ll have the option to use a dataset template with preconfigured transformations. If you don’t find a suitable template, select a source and destination using the form below, and you’ll be taken directly to the from-scratch data flow setup.
Step 1: Source setup
- Connect your source application account.
- Configure the basic and optional parameters. They vary depending on the chosen source application. For example, for Xero, you need to select a data entity. For Google Sheets, you’ll need to choose a spreadsheet and a sheet, as shown in the example below
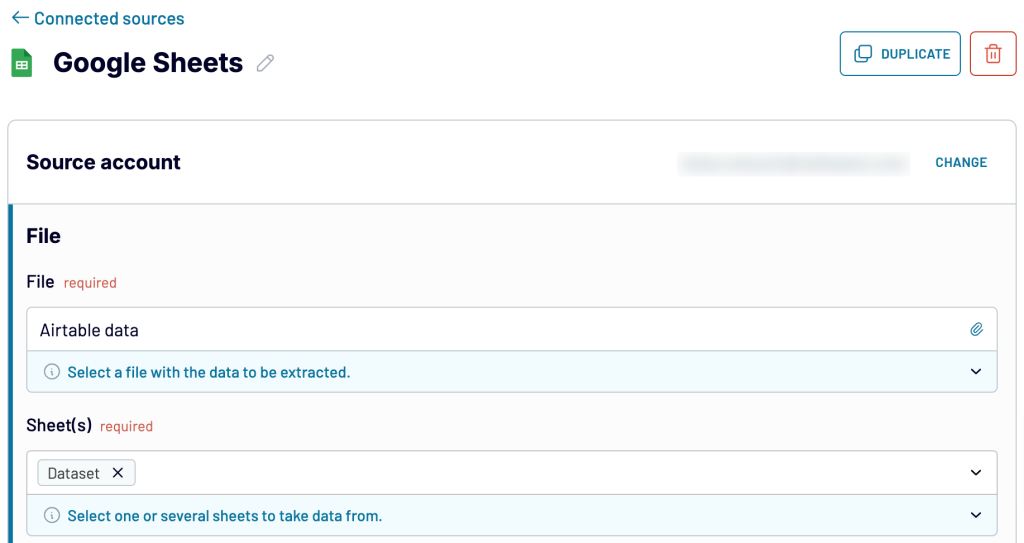
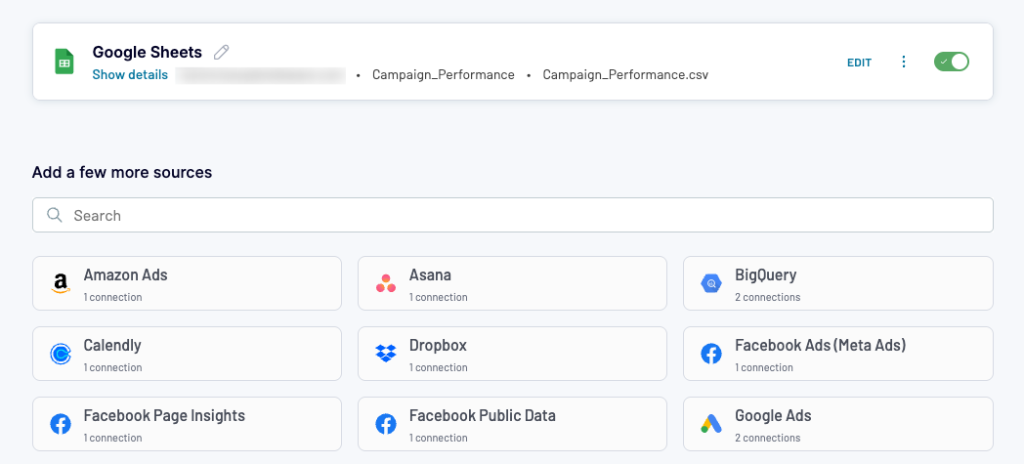
- Before proceeding to the next stage, add more data sources if you like. Again, you can choose from over 70 sources, including Facebook (Meta) Ads, GA4, QuickBooks, and Shopify.
Step 2: Transformations
- Preview your data and make the necessary transformations.
- If you’ve connected multiple sources, merge the data in a way that suits your needs.
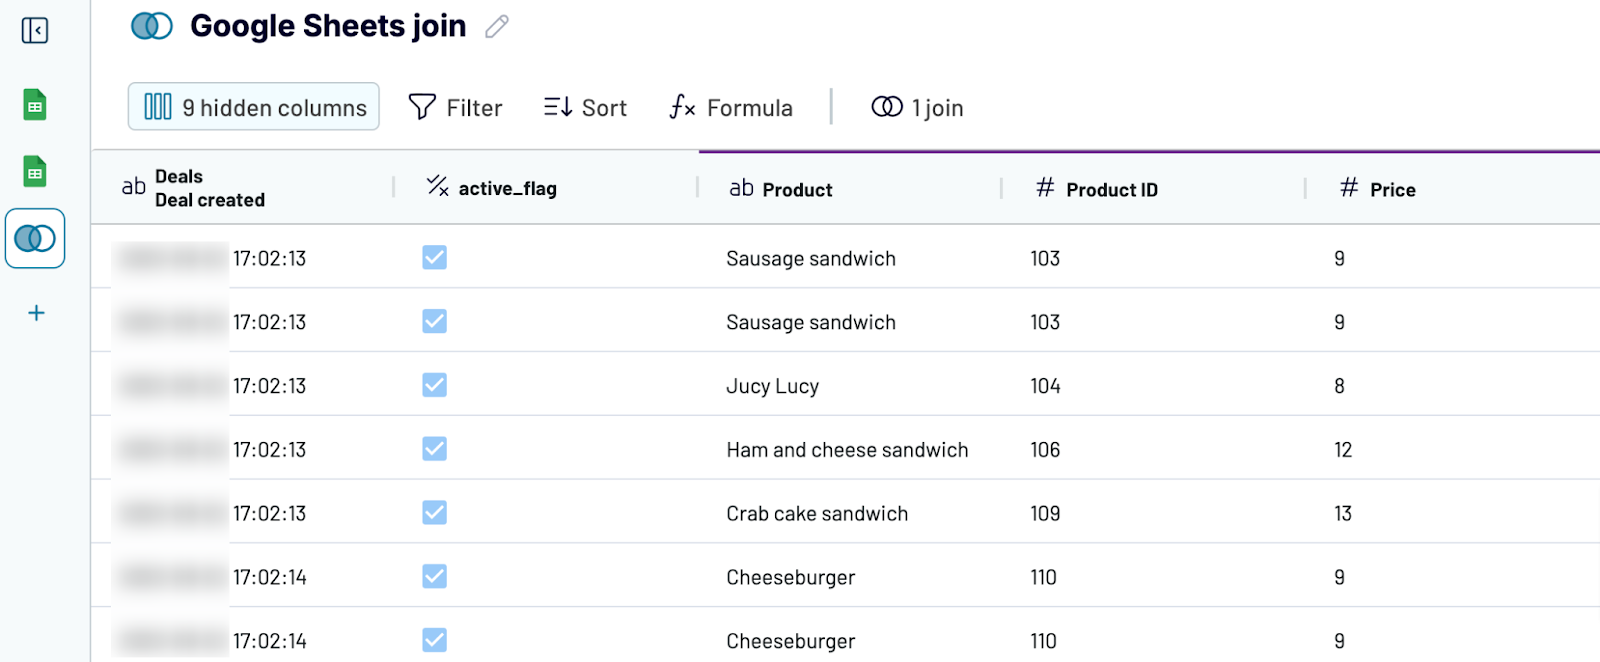
Step 3: Destination setup
- Connect your destination application account.
- If you’ve connected or merged data from multiple sources, choose the dataset to export.
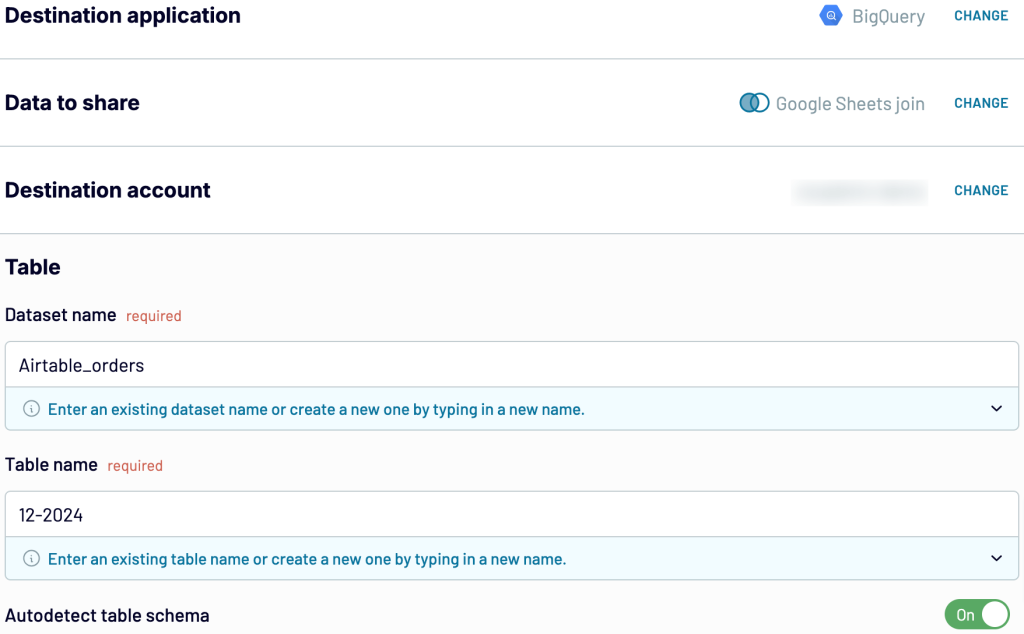
- Select a file and a sheet where to import data. This works for Google Sheets and Excel, whereas for BigQuery, you’ll need to enter the name of a dataset and a table.
- Optionally, you can.
- Select the import mode: replace or append.
- Add a column with the date and time of the last update.
- Set Coupler.io to skip data refresh if nothing has changed in the source since the last import.
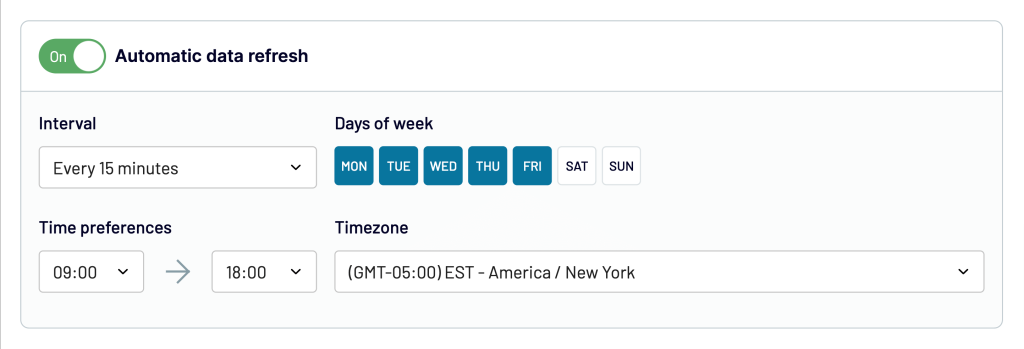
Configuration of these three steps is enough if you want to export data once. To automate exports on a schedule, toggle on the Automatic data refresh and customize the frequency for your updates. The minimum available interval is every 15 minutes.
Note: Neither Supermetrics nor Coupler.io provides real-time automated data refresh. The minimum interval you can get with Supermetrics is every hour at the Enterprise plan.
Supermetrics competitors – roundup
If Supermetrics didn’t quite live up to your expectations, do not despair – there are plenty of other tools that will do the job just fine and maybe better. The key here is figuring out what it is that you expect from your next ETL app.
If you’re looking for an affordable no-code tool for automating data imports and reporting, you can’t go wrong with Coupler.io. The platform is used by 24,000+ companies worldwide that love it for its user-friendly interface, ever-growing list of integrations, and friendly support.
If, on the other hand, you need a complex ETL solution that’s heavy on data transformation and offers an abundance of integrations, Funnel, Adverity, Improvado, or Stitch can serve as a Coupler.io alternative. Also, take a look at our overview of the best Stitchdata alternatives, maybe you may find some other interesting options there.
If you’re after a custom solution, try out Coupler.io’s data analytics service. Our data experts can help you make sense of your data, create tailored cross-channel reports, set up notifications and alerts, and more. Get in touch for a free quote.
Automate reporting with Coupler.io
Get started for free


