By automating your TikTok Ads reporting, you’ll have up-to-date data in your reports. You can analyze campaign performance, identify top-performing demographics, and compare with other PPC results. Let’s explore how to automate TikTok Ads reporting in this guide.
Ways to automate TikTok Ads reporting
Coupler.io: This is a reporting automation solution that enables you to connect TikTok Ads to spreadsheets and BI tools to create customized reports. You can not only automate data exports but also organize and combine data from other PPC sources like LinkedIn Ads, Facebook Ads, and Google Ads. This makes it simple to generate cross-app reports using near real-time data from multiple sources for comparison.
Automated dashboards: If building a dashboard from scratch in a BI tool sounds complex, then you can always use automated templates. Choose one of the available TikTok Ads dashboard examples and connect it to your TikTok data. With automated dashboards, you don’t have to worry about deciding which metrics to add or which visualizations to use. This saves you time and ensures your data is always ready for analysis.
TikTok Ads Manager: Another way to automate TikTok Ads reporting is with the native features of TikTok Ads Manager. You can generate custom reports or use report templates provided within the platform. Select the dimensions, metrics, and time frame for your report, and schedule it to be delivered to your email regularly. While this method is straightforward, it only allows you to view your data as a pivot table or a trend line. You cannot conduct an in-depth analysis of your data. However, it’s useful for regularly tracking a few KPIs that do not require detailed analysis.
Option 1: Automated dashboard templates for TikTok Ads
You can save a lot of time by automating the data export from TikTok Ads. However, creating a report from scratch can also be time-consuming. With numerous options for configuring and adding visualizations, it can be quite time-consuming. To simplify this process, Coupler.io provides automated dashboard templates, allowing you to easily view your ad data in these reports. Using these dashboards is simple. Just follow the instructions in the Readme tab, and your dashboard will be ready with your data in minutes.
Let’s take a look at the dashboard templates, where you can add TikTok Ads data and gain valuable insights.
TikTok Ads dashboard
The TikTok Ads dashboard in Looker Studio provides a comprehensive overview of your TikTok ad campaign performance. You can track trends over time and compare the key PPC metrics such as ad spend, average video play time, video views, clicks, reach, conversions, CPM, and more.
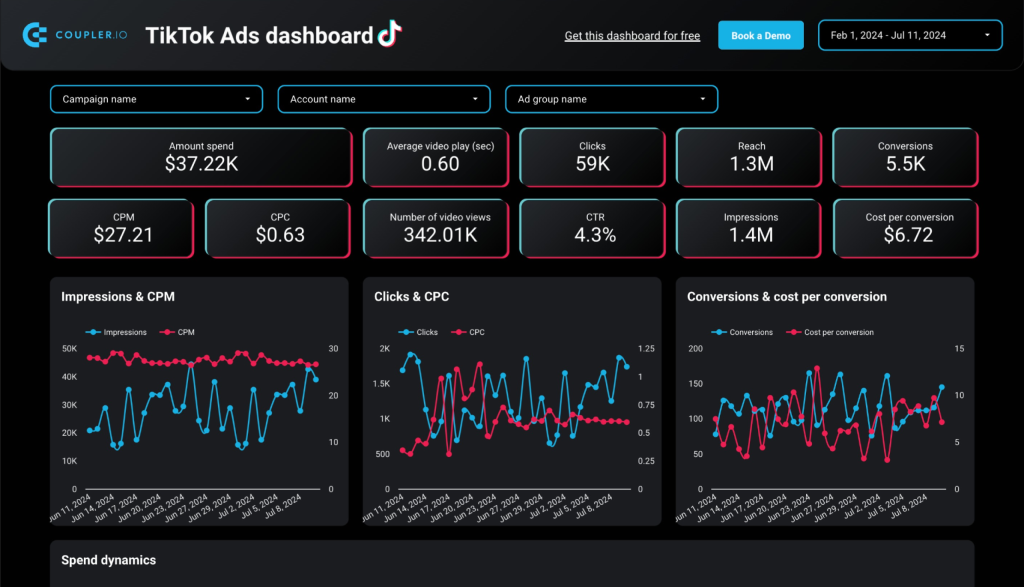
Moreover, it offers insights into spending dynamics, top-performing campaigns, and conversions by platform, gender, and age group. By consolidating this data, the dashboard helps you identify high-performing ads, improve targeting, and enhance your overall PPC strategy to increase return on ad spend (ROAS).
Multi-channel PPC dashboard
The multi-channel PPC dashboard offers a comprehensive overview of your advertising performance across different platforms, including TikTok Ads. It consolidates data from various sources such as Google Ads, Twitter Ads, LinkedIn Ads, and Facebook Ads into a single interface.
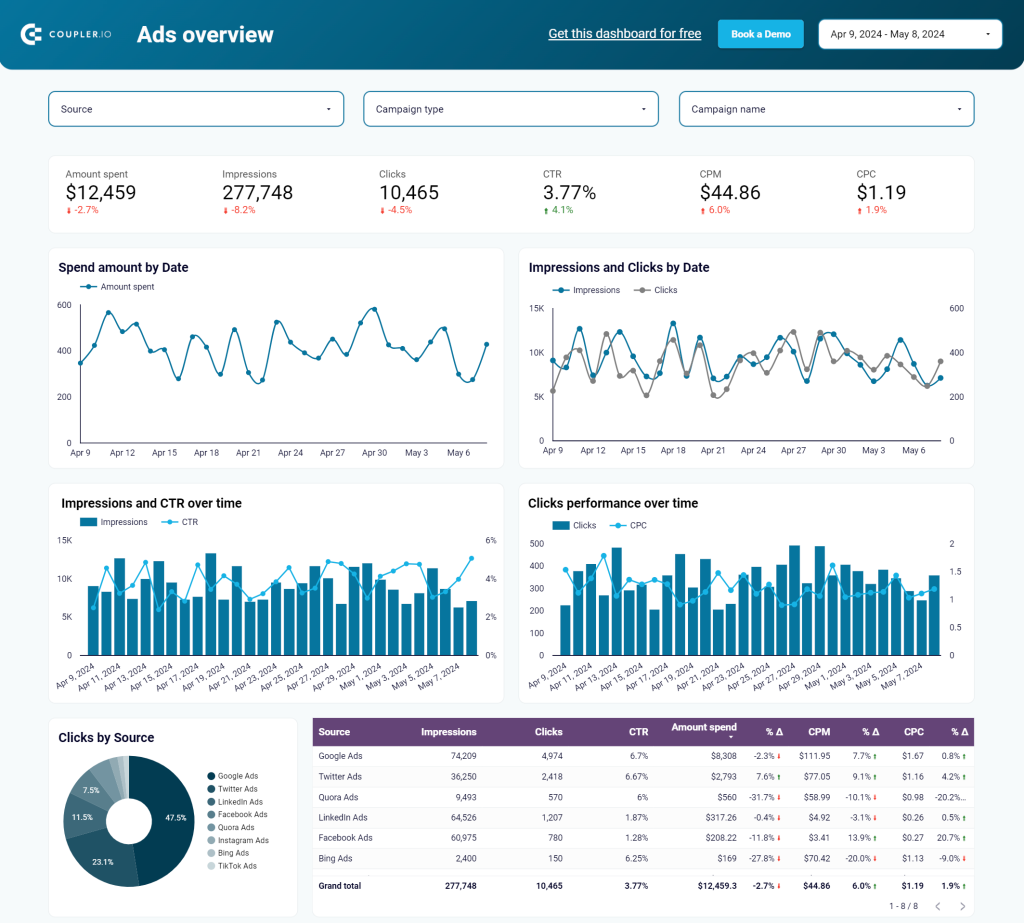
With this dashboard, you can monitor TikTok Ads metrics alongside other platforms to gauge TikTok’s impact on your overall PPC strategy. This assists in identifying the most effective channels, optimizing budget allocation, and enhancing return on ad spend (ROAS).
The dashboard is accessible in multiple destinations such as Looker Studio, Tableau, Google Sheets, and Power BI.

PPC multichannel dashboard in Google Sheets
Use a PPC dashboard designed for Google Sheets to track the performance of your campaigns across multiple advertising platforms.


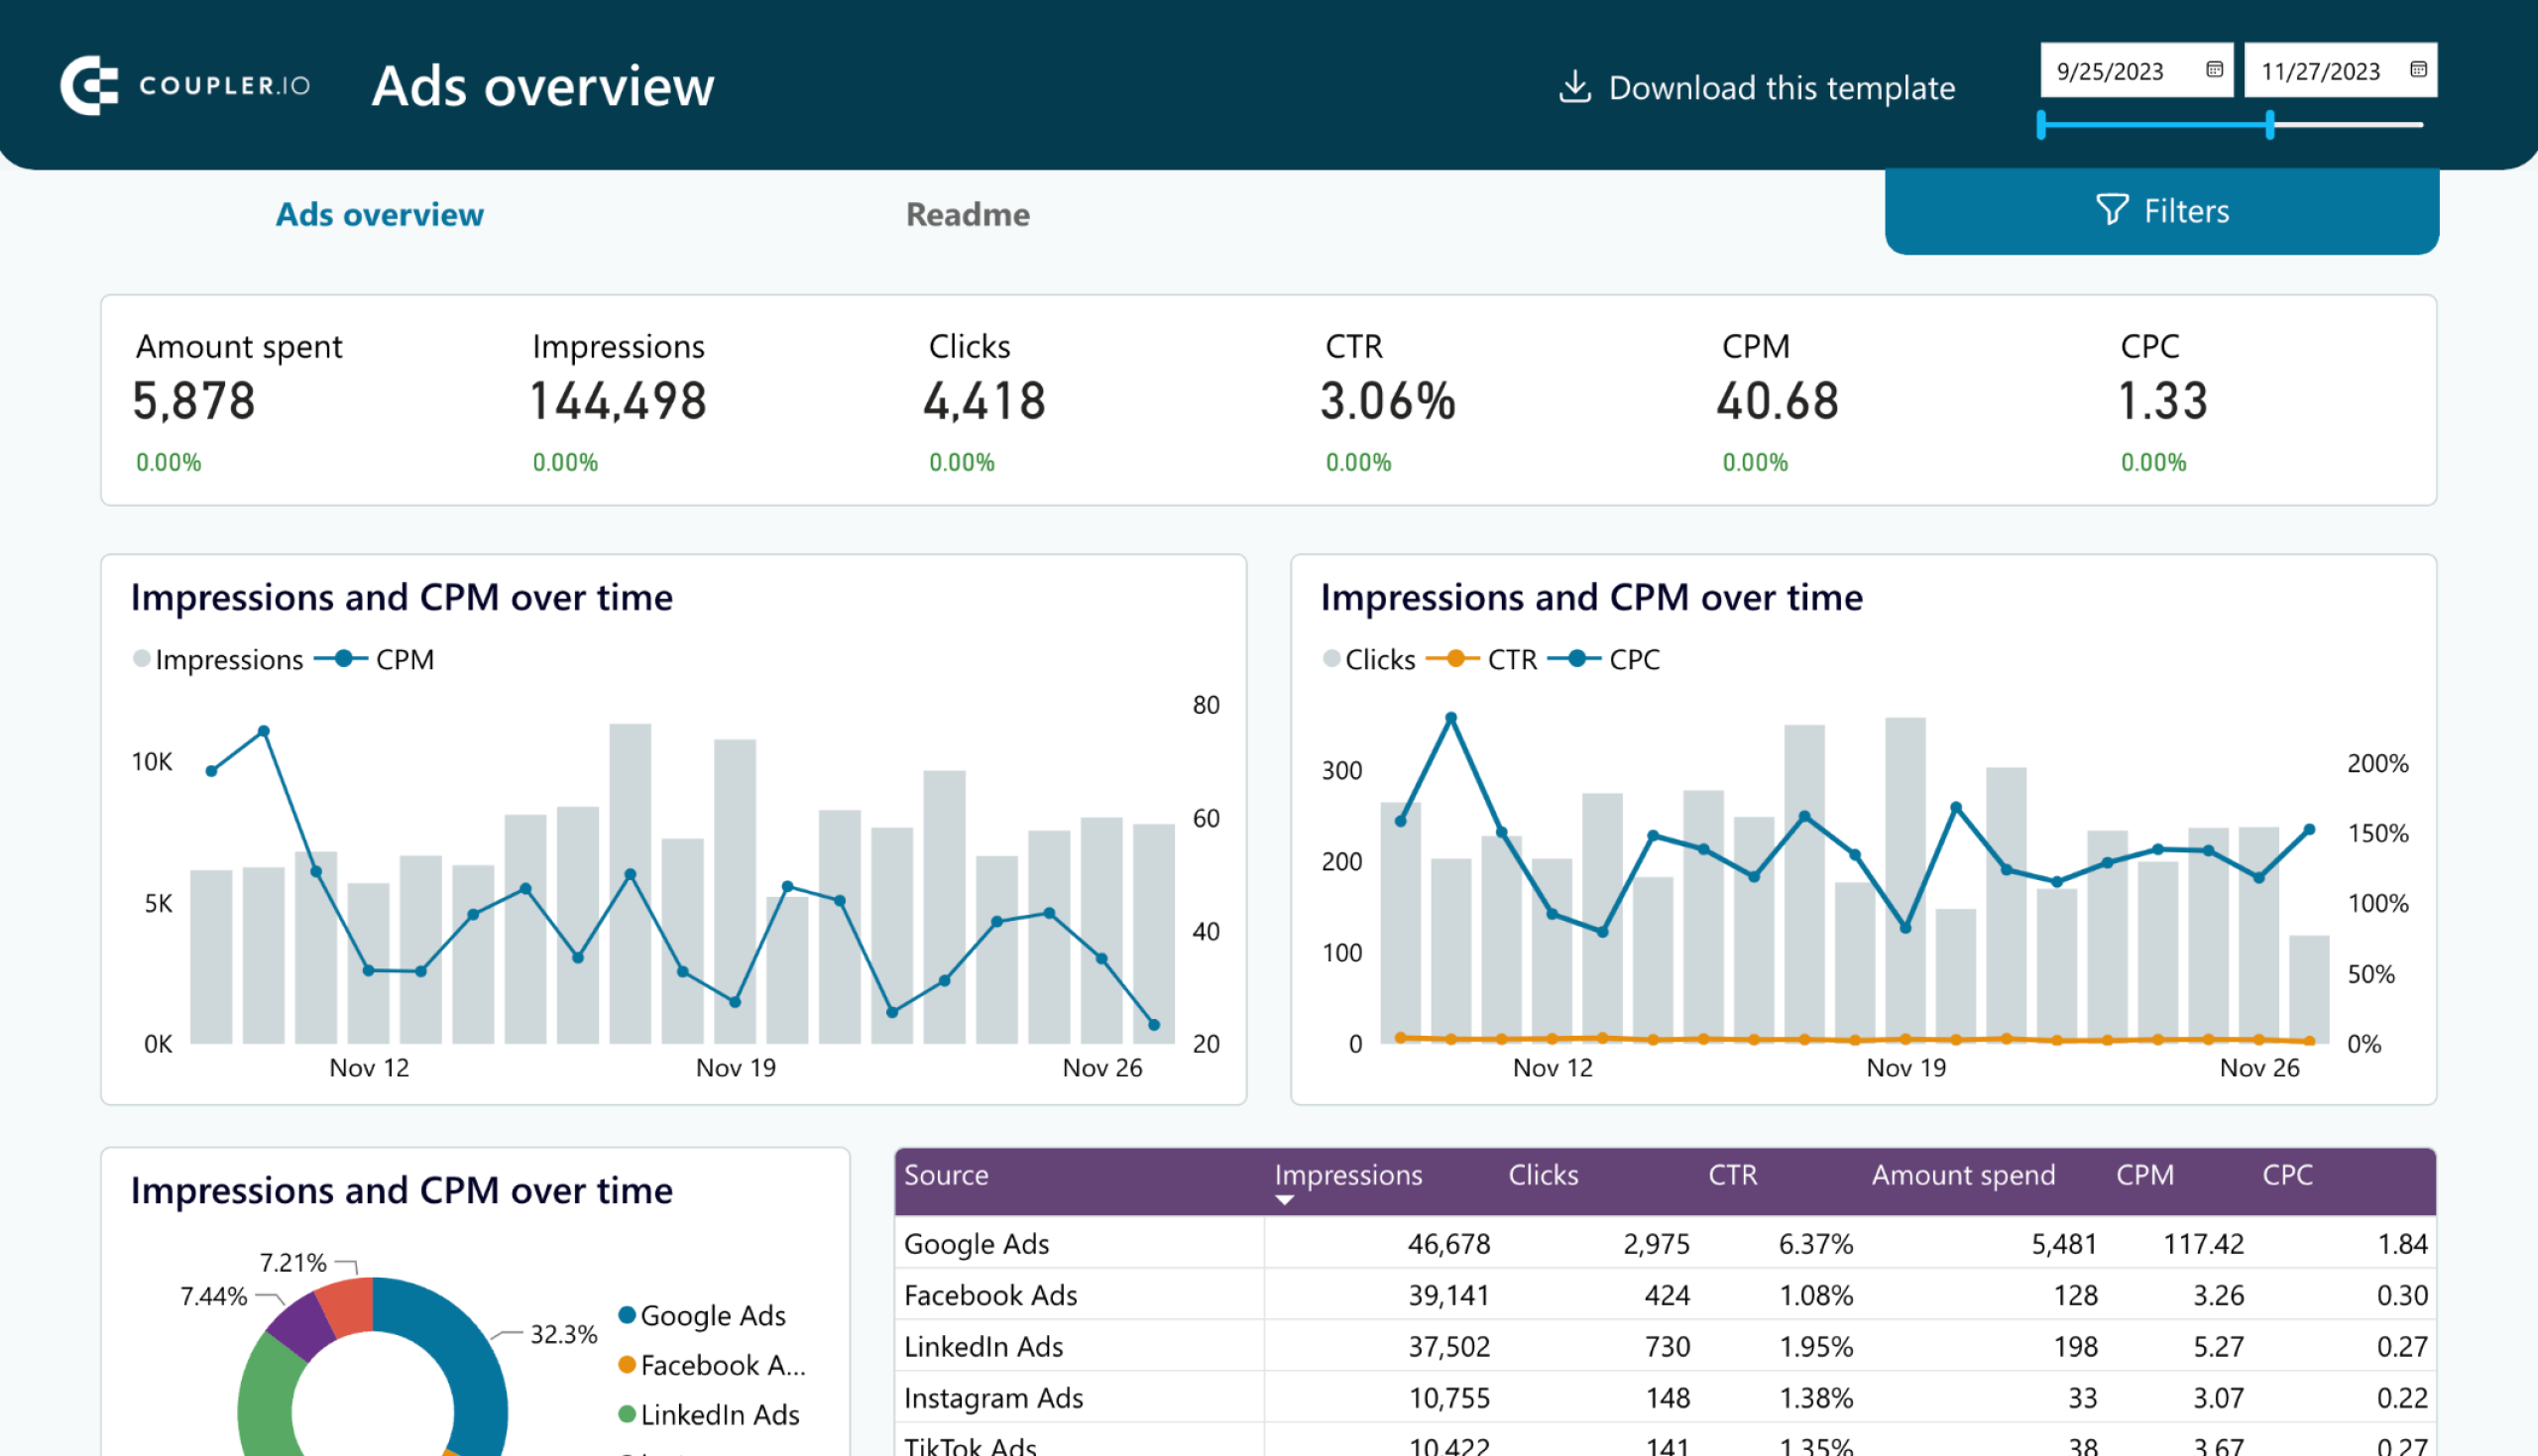
PPC multichannel dashboard in Looker Studio
Get a comprehensive PPC reporting tool to track the performance of your campaigns launched at multiple advertising platforms.

PPC multichannel dashboard in Power BI
Use a Power BI PPC dashboard for tracking and analyzing your advertising campaigns across multiple platforms.


PPC multichannel dashboard in Tableau
Track and analyze the performance of your advertising campaigns across various platforms using a one-stop PPC dashboard in Tableau

PPC monthly budget dashboard
The PPC monthly budget dashboard provides a clear overview of your advertising budget and spending trends over time. It tracks key metrics such as total cost, total spent, average monthly budget, and average monthly spent. It also offers insights into the budget remaining and the percentage spent.
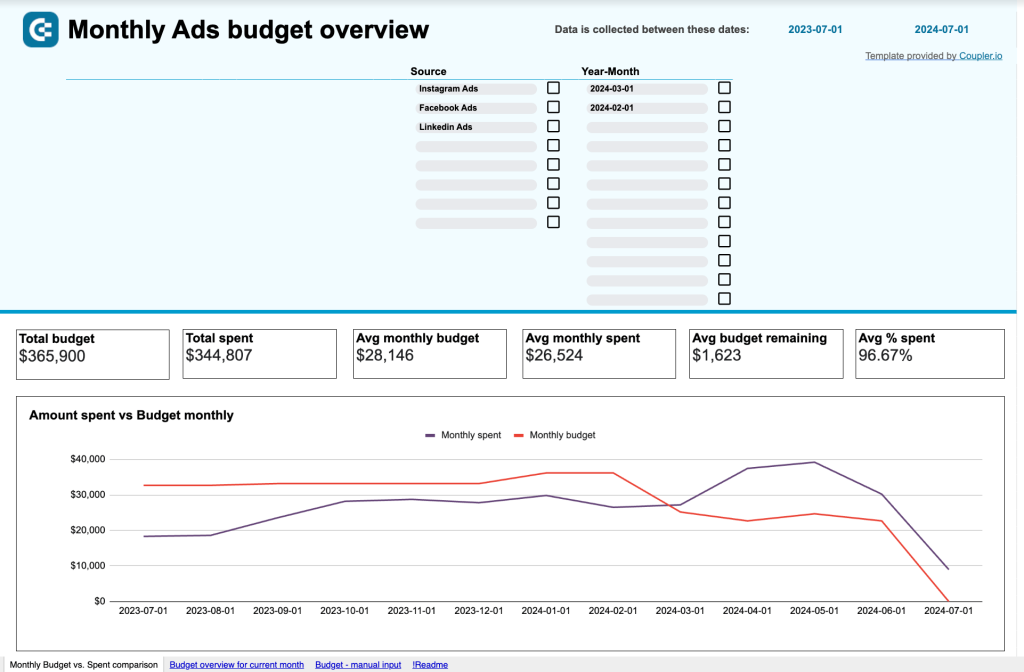
By consolidating budget data from various sources, you can monitor how each platform contributes to your overall spending. Additionally, you can compare the performance of TikTok Ads with other channels and pinpoint areas where budget adjustments are necessary. This dashboard is valuable for aligning spending with your goals and optimizing the overall PPC strategy. Please note that this PPC monthly budget dashboard is exclusively available for Google Sheets.
For more details, have a look at our article about TikTok report templates.
Option 2: Automate TikTok Ads reporting with Coupler.io
Coupler.io makes it easy to automate TikTok Ads reporting with just a few clicks. It automates the data transfer from TikTok Ads to your preferred spreadsheet app (Google Sheets and Microsoft Excel) or BI tool (Looker Studio, Tableau, and Power BI). You can build custom reports in these destinations and always have updated data.
Step 1: Collect data
In the form below, TikTok is pre-selected as the source. Choose the destination from the drop-down and click on Proceed.
To configure the source, connect the TikTok Ads account and set up the following settings:
- Basic settings – select the ad account and report type.
- Report period – select the start date and end date. This field supports macros like {{30daysago}}, {{today}}, etc.
- Metrics and dimensions – select the metrics that should be included in your report.
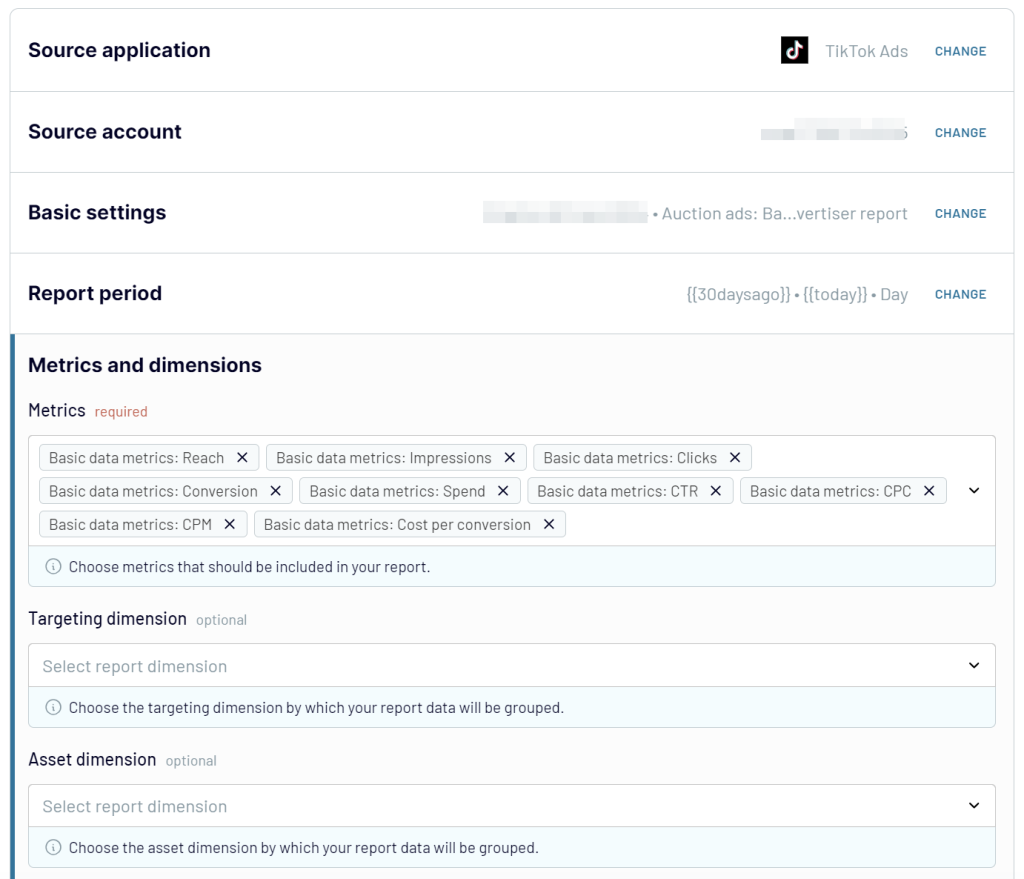
To move to the next step, click Finish and Proceed.
Step 2: Organize and transform data
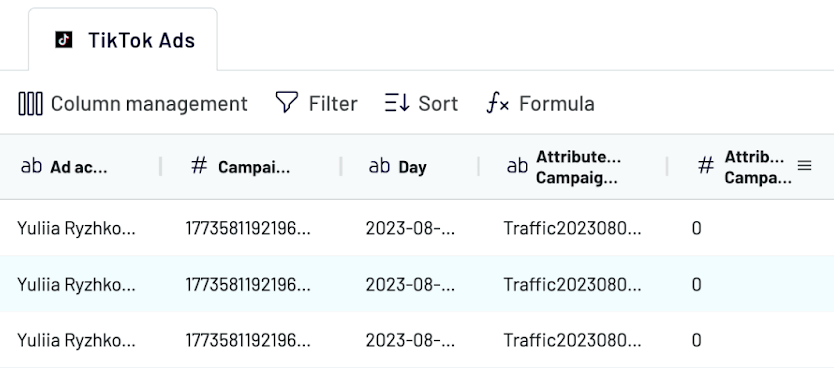
Here, you can organize your TikTok Ads data with the below data transformation features.
- Column management: Hide, unhide, rename, and rearrange columns to focus on specific metrics like impressions, clicks, and conversions.
- Sort and filter: Sort TikTok Ads data to rank ads by highest engagement, cost-per-click, or return on ad spend. Filter to see performance metrics for specific campaigns or audience segments using AND/OR conditions.
- Formula columns: Use formulas to create new columns that calculate custom metrics such as cost per conversion or click-through rate based on your existing TikTok Ads data.
- Join and union: Combine data from other PPC sources to get a unified view of performance.
Step 3: Load data and schedule transfer
Once the data is ready for export, follow the in-app instructions to configure the destination settings.
Now, toggle the Automatic Data Refresh button. You can schedule the updates to happen as often as every 15 minutes. Specify the interval, days of the week, time preferences, and time zone.
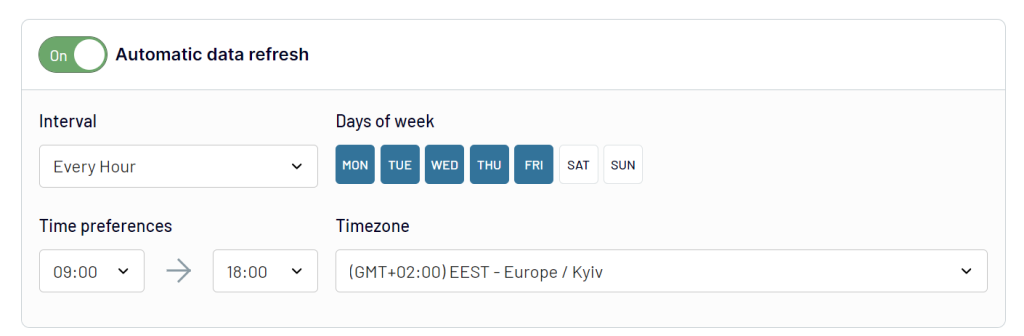
After transferring the data to the BI tool, you can leverage various visualization options to create a report. The automated data refresh ensures that your TikTok Ads data is consistently updated in the reports, making it ready for analysis.
Option 3: How to create custom reports in TikTok Ads Manager?
You can create custom TikTok Ads reports from scratch or from a template. A custom report from scratch gives a blank canvas where you can add desired metrics. It is suitable for in-depth analysis. A custom report from a template has pre-defined metrics and dimensions. It is quick and ideal for basic reporting needs.
Follow these steps to create a custom TikTok ads report:
Step 1: Log in to your TikTok Ad account and go to TikTok Ads Manager. Here, navigate to the Analytics tab and select Custom Reports.
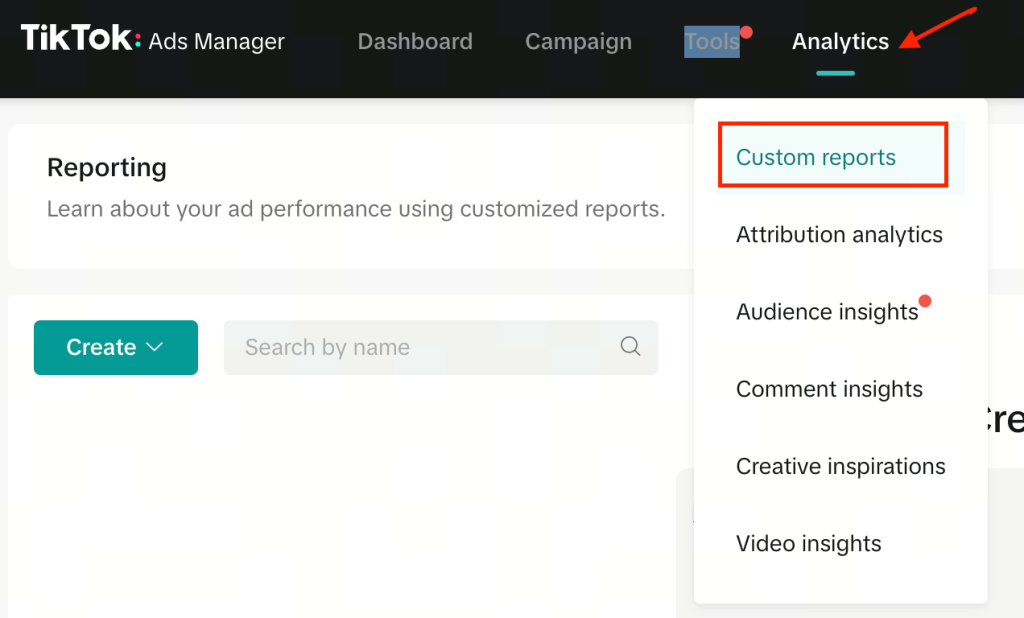
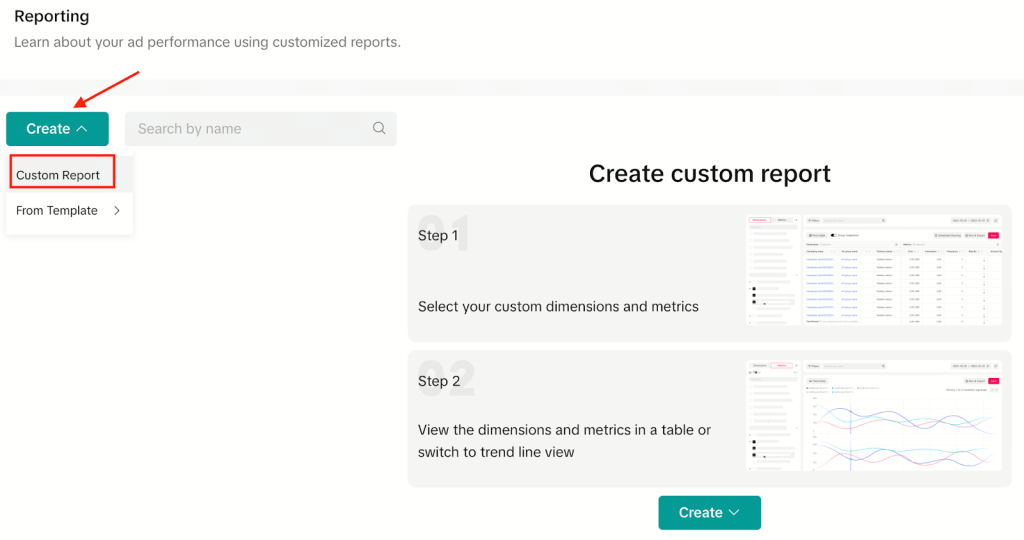
Step 2: On the Reporting page, click Create and then select Custom Report.
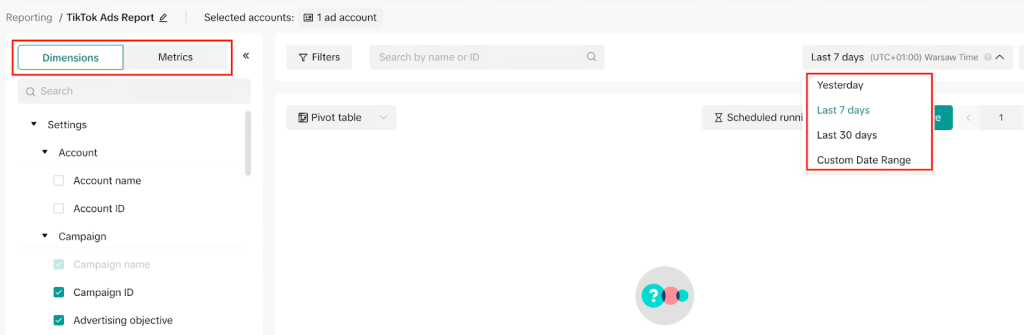
Step 3: The Custom Reports page displays a list of Dimensions and Metrics on the left.
- Dimensions: These are related to groupings of your data and appear as rows in your report, such as campaigns, ad groups, ads, and placements.
- Metrics: These are related to ad performance data and appear as columns in your report, such as CPM, CPC, CTR, and CVR.
Choose the preferred dimensions and metrics you want to display in your report. Select the time range for your data – yesterday, the last 7 days, the last 30 days, or a custom date range.
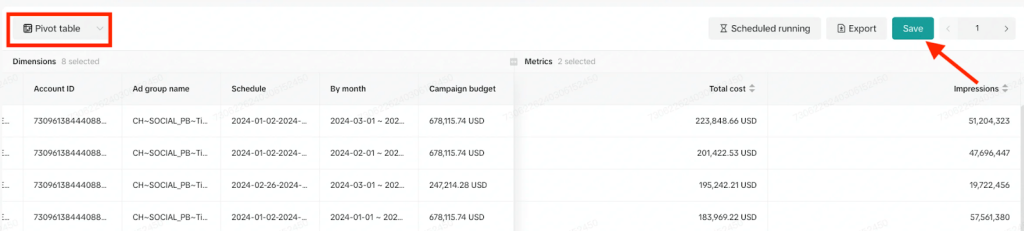
Step 4: Now you can visualize your data in a simple pivot table. You can also view your campaign report through a trend line. Open the Pivot table drop-down menu and select Trend line.
Click Save and name your report.
Step 5: Once you have created a custom report, you can choose between the following download options:
- Scheduled running: Set a schedule to receive automatically generated reports delivered via email.
- Run & export: Immediately run your report for export and download.
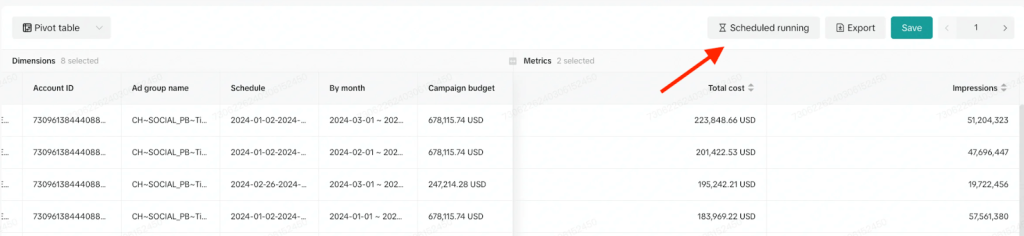
To automate TikTok Ads reporting, select Schedule running to receive updated reports as specified.
Can you automate reports without TikTok Ads reporting API?
Using the TikTok Ads reporting API is a complex process that requires developer expertise. First, you need to register as a developer and create an app to get an access token for API calls. The API provides various endpoints for managing and reporting on your digital ads. It also involves setting up authentication, writing scripts, and handling data integration. You can refer to TikTok’s official documentation for more details.
While the API offers flexibility and detailed control, it is not ideal for non-technical users. In contrast, solutions like Coupler.io are accessible for marketers to automate TikTok reporting without technical skills.
Best practices for automating TikTok Ads reporting
The most effective practices will vary depending on your preferred destination.
For Google Sheets:
- If you choose to use Google Sheets for TikTok Ads reporting, use the Coupler.io add-on within Google Sheets to create and automate reports directly from your spreadsheet.
- Prioritize key metrics like impressions, clicks, conversion rate, CTR, and ROAS. For example, create a dedicated Google Sheets tab where these metrics are automatically populated and visualized.
- Set up conditional formatting and data validation rules in Google Sheets to highlight anomalies and ensure data consistency. For instance, turn cells red if the click-through rate (CTR) drops below a certain threshold to indicate performance issues.
For BI tools:
- Combine TikTok Ads data with other PPC platforms like Google Ads, Facebook Ads, and LinkedIn Ads for a holistic view. Use Coupler.io’s multi-channel PPC dashboard to get a side-by-side performance comparison between TikTok Ads and other platforms.
- Customize reports to meet the needs of various stakeholders. For executives, create high-level summary dashboards that focus on overall ROI and cost efficiency. For campaign managers, provide detailed reports that break down performance by ad group, creative, and target audience segment.
- Assess your automated reports regularly to ensure they are aligned with your business goals. You can schedule a quarterly review of your BI dashboards to update the metrics and visualizations.
With these best practices, you can optimize the overall TikTok Ads reporting process. Whether you use Google Sheets or a BI tool, these practices will make sure your data is accurate, up-to-date, and actionable.
Benefits of automating TikTok Ads reports
- Saves time: Automating TikTok Ads reporting can save a lot of time by eliminating the need for manual data pulling and organization. Automation solutions, such as Coupler.io, can drastically reduce reporting time from hours to minutes, allowing marketing teams to focus on improving campaigns and identifying new opportunities.
- More accurate data: Manual data entry often results in errors, while automated reports provide consistent and accurate data. By using automated social media reporting, a retail company managing TikTok ad campaigns can eliminate frequent data entry mistakes, leading to a better understanding of campaign performance, strategic adjustments, and accurate reporting to stakeholders.
- Up-to-date data: Automatic updates ensure that reports always reflect the latest data, enabling quick and informed decision-making. For example, an e-commerce business setting its reports to refresh daily can promptly adjust campaigns and enhance the return on ad spend (ROAS).
- Consistent Reports: Automated reports use the same format every time. This makes it easy to spot trends and compare performance over time. For example, a media agency could consistently track seasonal ad performance year-over-year.
- Scalability: Automated reporting scales with your campaigns as they grow. It handles larger datasets without extra effort. For example, a tech startup could seamlessly manage increasing data volume as its ad spend expands across multiple platforms.
Which is the best option to automate TikTok Ads reporting?
When it comes to automating TikTok Ads analytics, the best option depends on your specific needs. Using TikTok Ads Manager to schedule reports to your email is simple, but it has limited visualization capabilities. You can only visualize data in pivot tables and trend lines. On the other hand, the TikTok API is highly customizable but complex and requires coding skills.
Coupler.io stands out as a reliable choice. It is user-friendly, doesn’t require technical expertise, and can integrate data from multiple sources. You can either connect your TikTok Ads account to a preferred destination or directly obtain an automated report using dashboard templates. In either case, you’ll receive updated data in PPC reports automatically and gain real-time digital marketing insights.
Automate TikTok Ads reporting with Coupler.io
Get started for free


