The TikTok Ads platform allows you to view historical marketing data as well as keep track of your account’s performance. Although it helps with monitoring your campaigns, you can’t rely solely on the platform for more comprehensive analytics. A better option is to build reports in Power BI and use those for analytics or insights sharing. In this article, we’ll discuss the methods to connect TikTok Ads to Power BI and show how you can do this.
Different ways to connect TikTok Ads to Power BI
There are a couple of built-in connectors in Power BI but none exist for TikTok. Having said that, you can use other options to send TikTok Ads data to Power BI. Let’s explore their pros and cons below:
Power BI connector by Coupler.io
Coupler.io is a reporting automation solution to turn raw data into simple reports. It allows you to connect TikTok Ads to Power BI with just a few clicks. You can also organize your data and blend it with information from other data sources (Facebook Ads, Google Ads, LinkedIn Ads, etc.) to create cross-channel reports. And of course, your reports will be automatically updated on a custom schedule that you can configure.
| Pros | Cons |
|---|---|
| – No coding knowledge needed – Data transformation – Automatic data refresh – Data blending from multiple accounts – Pre-configured TikTok Ads template | – No real-time updates (the highest frequency is the 15-minute interval) |
Manual data export
Users can export data from TikTok Ads in XLSX file format. You can select specific content and choose a data breakdown for download. Or you can simply export all your data at once. Then, you’ll need to upload the file to Power BI. Note that you’d have to repeat the download and upload actions each time there’s new analytics data.
| Pros | Cons |
|---|---|
| – Easy to accomplish – Absolutely free | – Time-consuming process – Inefficient and error-prone |
Custom API integration
To create a custom integration solution, you need to request API access from TikTok Ads. The process requires sufficient coding knowledge and the ability to write scripts. You’ll fetch data from the API and load it into data warehouses or directly into Power BI.
| Pros | Cons |
|---|---|
| – Fully customized and flexible – Automated data extraction – Big data handling | – Needs technical knowledge and skills – API request limits may apply – Complex setup process |
How to set up the TikTok Ads to Power BI integration with Coupler.io
To configure the Power BI connector for TikTok by Coupler.io, complete three simple steps:
Step 1. Retrieve data from TikTok Ads
To get started, click Proceed in the preselected form below. If you’re new to the tool, you will be asked to sign up for Coupler.io for free (No credit card required).

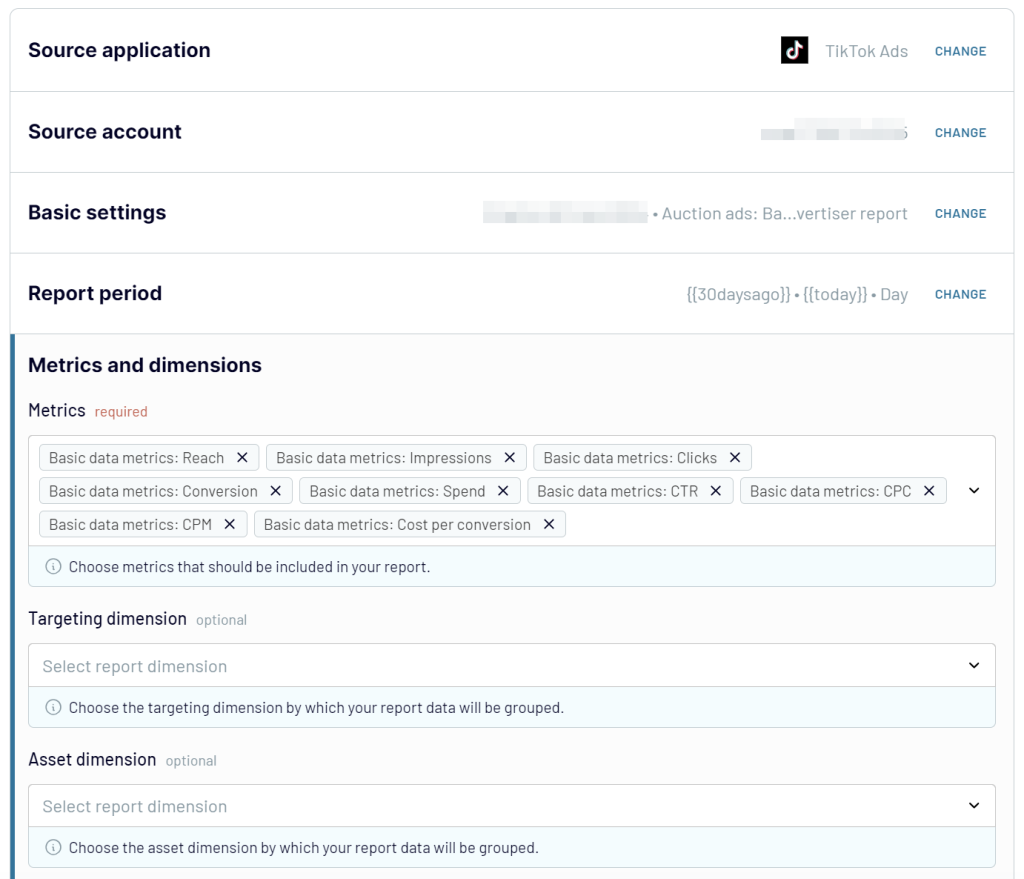
Once you’ve created a Coupler.io account, you’ll be redirected to the importer. This allows you to connect your TikTok Ads account and choose the reporting parameters.
- Basic settings – Specify ad account(s) and report type.
- Report period – Pick a start date, end date, and split data by period.
- Metrics and dimensions – Choose specific metrics to be included in your report.

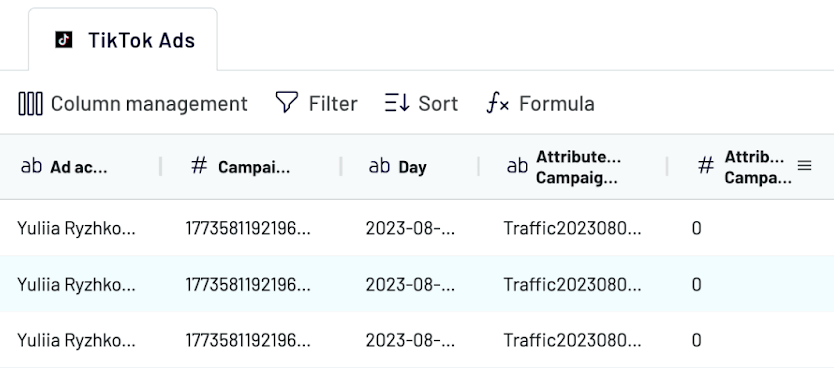
Step 2. Transform data
This is where you can organize your data and make it more relevant for reporting. Check out the data transformation options in Coupler.io:
- Hide columns that aren’t needed in your reports
- Filter data for a more specific dataset. For example, you can exclude test ads.
- Sort data in certain columns to make it look more organized
- Apply formulas to aggregate and add data to new columns

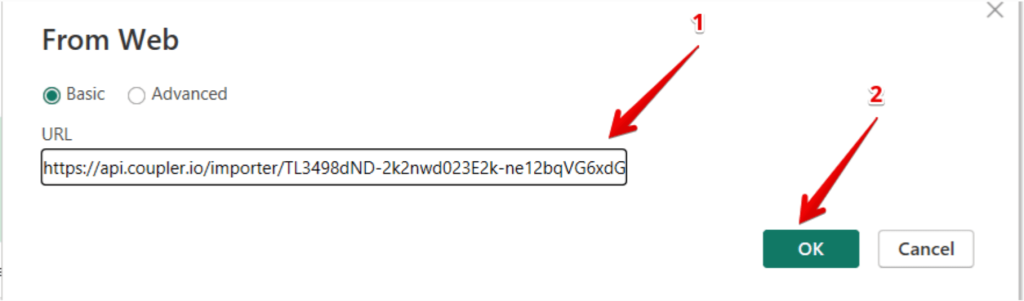
Step 3. Load data and schedule refresh
Once your data looks more refined, you can continue to load your TikTok Ads data into Power BI. Follow the in-app instructions to get a link and paste it into Power BI Desktop.

Note: Coupler.io also allows you to connect TikTok Ads to Looker Studio, Google Sheets, BigQuery, Tableau, and other destinations.
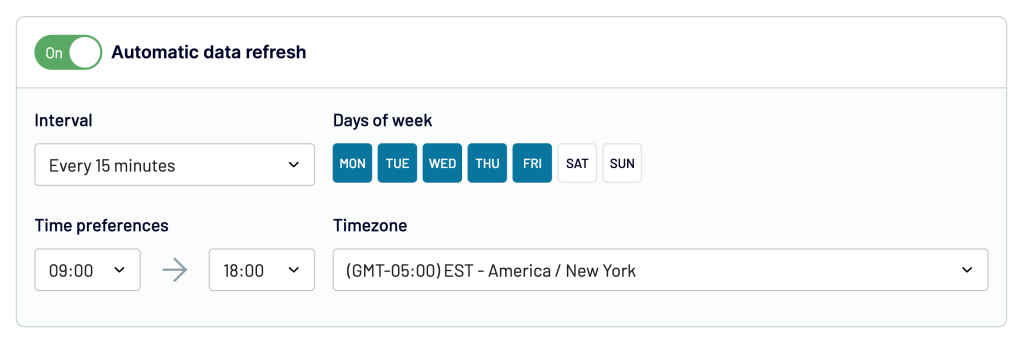
Enable Automatic Data Refresh and specify a schedule to automate exports from TikTok Ads to Power BI. The interval can be every 15 minutes, hourly, or once daily.

Click the Save and Run Importer button to send TikTok Ads data to Power BI. With Coupler.io, you can visualize your data in reports or dashboards and perform a comprehensive analysis.
What insights can you extract from TikTok Ads data?
In the Power BI desktop, you can find charts to use in your data analysis reports. It’s important to use the right visual type to display certain kinds of data. This allows you to understand your data better and derive insights from it. Then, you can begin to analyze the metrics and determine the overall effectiveness of your campaigns. Let’s discuss some useful insights that can be extracted from TikTok Ads.
Overview of Campaign Performance
A TikTok Ads reporting dashboard should display aggregated metrics for the reporting period. These metrics can include reach, impressions, clicks, conversions, CTR, CPM, CPC, etc. Next, you need to understand how various metrics tend to fluctuate and change over time.

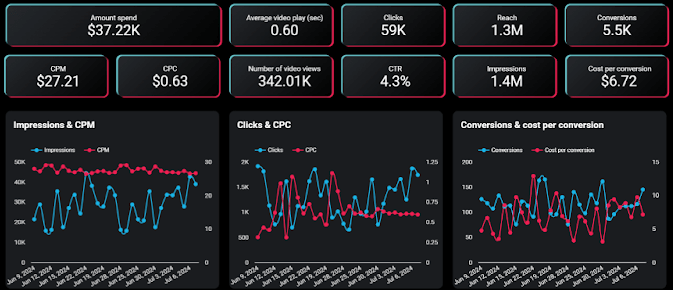
The graphs also help to see the correlation between similar metrics. You could compare to see how certain metrics affect each other and how they influence ad performance.
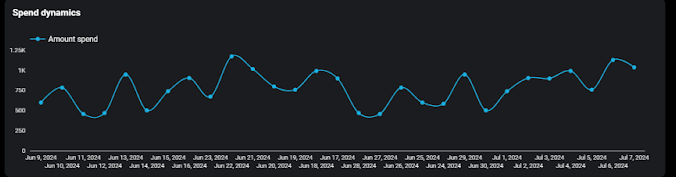
Ad Spend Breakdown
You may choose to study the ad spend dynamics over the reporting period. A line graph can display the amount spent on each date and also show how the amounts may differ. It helps to discover the ad spend per day and how the total amount adds up over time.

Conversions Breakdown
There are various aspects of campaign conversions that need to be analyzed. First, you need to know the total number of conversions for each campaign. Next, you can check how different platforms (iPhone, ipad, desktop, etc) contribute towards the conversions. It’s also important to determine the total number of conversions from each gender.

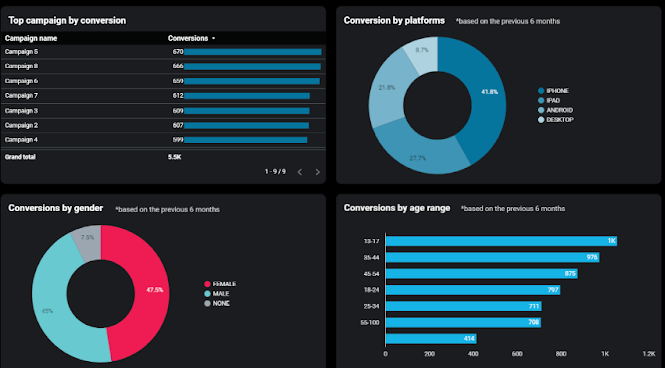
Lastly, you can analyze conversions across different age ranges. This makes it easier for you to determine the highest converting age groups for your TikTok Ads campaigns.
Performance Breakdown
It is important to have a holistic view of the overall campaign performance. Performance by Country allows you to know the countries that are driving the numbers up. You’ll also take a closer look at the performance metrics associated with each country such as conversions, impressions, total number of video views, clicks, CTR, and amount spent.

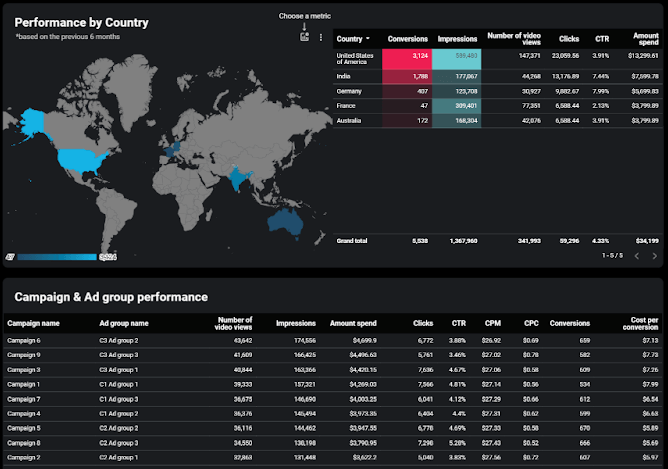
Campaign and Ad group performance helps to analyze the KPIs associated with each campaign and various ad groups. The metrics include total number of video views, impressions, the amount spent, clicks, CTR, CPM, CPC, conversions, and cost per conversion. It allows you to see how your campaigns and ad groups are performing.
How to manually export data from TikTok Ads to Power BI?
There are two options for exporting data in TikTok Business Center. Let’s have a look at them:
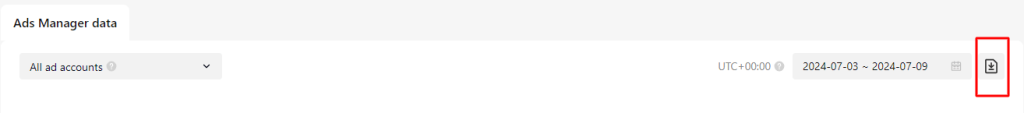
Manual export option 1
- Navigate to the Overview tab and click the export icon in Ads Manager data.

- Specify the export settings.
- File name is optional.
- Content options include trends, conversion comparison, spending ad accounts, spending creatives, and spending products.
- Data breakdown (by date, week, or month)

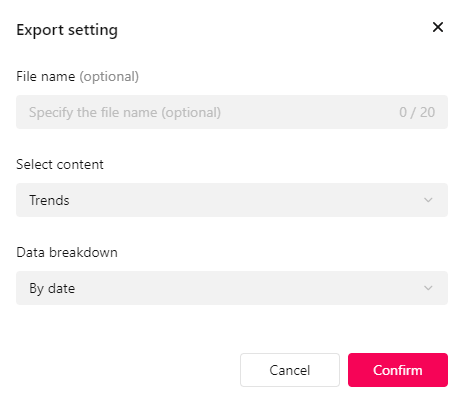
Once you click Confirm, your data will be downloaded as XLSX.
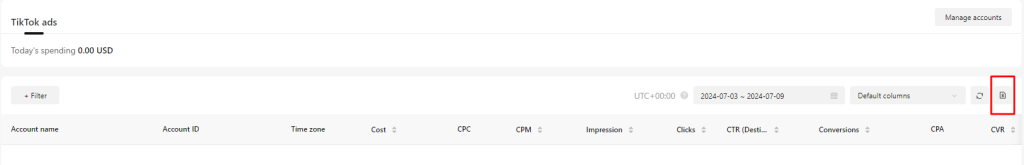
Manual export option 2
- Navigate to the Analytics tab and click the export icon there.

- Specify the export settings
- File name is optional.
- You can select All or pick a specific option from the list.

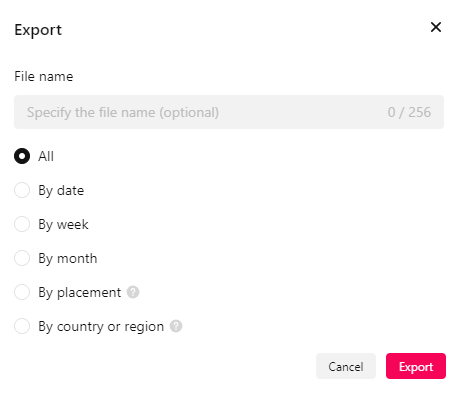
Once you click Export, your data will be downloaded as XLSX.
Upload to Power BI
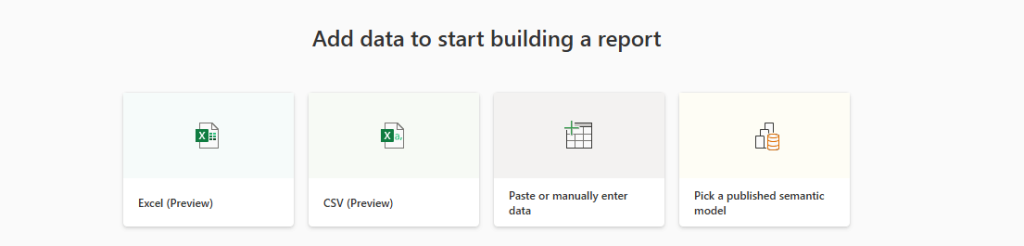
- If you’re using Power BI Online, log into your account and click the Create button on the left panel or the New report button on the homepage. Then, select Excel (Preview), upload the XLSX file containing your TikTok Ads data, and continue.

In Power BI Desktop, go to Get Data > Excel Workbook and upload the required file.
The native method of connecting TikTok Ads to Microsoft Power BI can be time-consuming, especially if you have to do it often. It’s best if you only need to do this occasionally.
What’s the best way to integrate TikTok Ads data to Power BI?
As explained above, there are not many ways to connect TikTok Ads to Power BI. You should note that manual data integration isn’t convenient and it’s also possible to make mistakes during the process. However, it’s a good option if you want to focus on a specific part of your ads or analytics data rather than analyze the entire account.
On the other hand, a reporting automation solution such as Coupler.io makes the ETL process become stress-free and fast. All you have to do is set up the data pipeline and allow it to automatically populate your Power BI reports or dashboards with data. Using Coupler.io enables you to discover insights quickly and make data-driven decisions.
Automate TikTok Ads reporting with Coupler.io
Get started for free