What is a TikTok analytics dashboard?
A TikTok analytics dashboard monitors how your audience interacts with content through views, likes, comments, and shares. Focusing on these key metrics helps you identify the most successful videos. It also informs you of the account’s growth by tracking new and total follower counts. On top of that, you can also determine the best times to post content so your videos can reach maximum viewers.
In short, this dashboard provides a clear view of your account’s performance. You can use it to make data-driven decisions that improve content creation and expand your audience.
How do you visualize data with a TikTok analytics dashboard template?
If you think about building a dashboard alone, note that it can be time-consuming. Thankfully, you don’t necessarily need to do this manually. Here is a TikTok analytics dashboard you can use to aggregate data on your content. This allows you to analyze video performance based on various metrics and break down the report by specific filters.
This white-label template, designed in Looker Studio, features a built-in connector by Coupler.io. So you can automatically pull your data from TikTok and send it to the dashboard on the go.
What value can the TikTok dashboard provide to you?
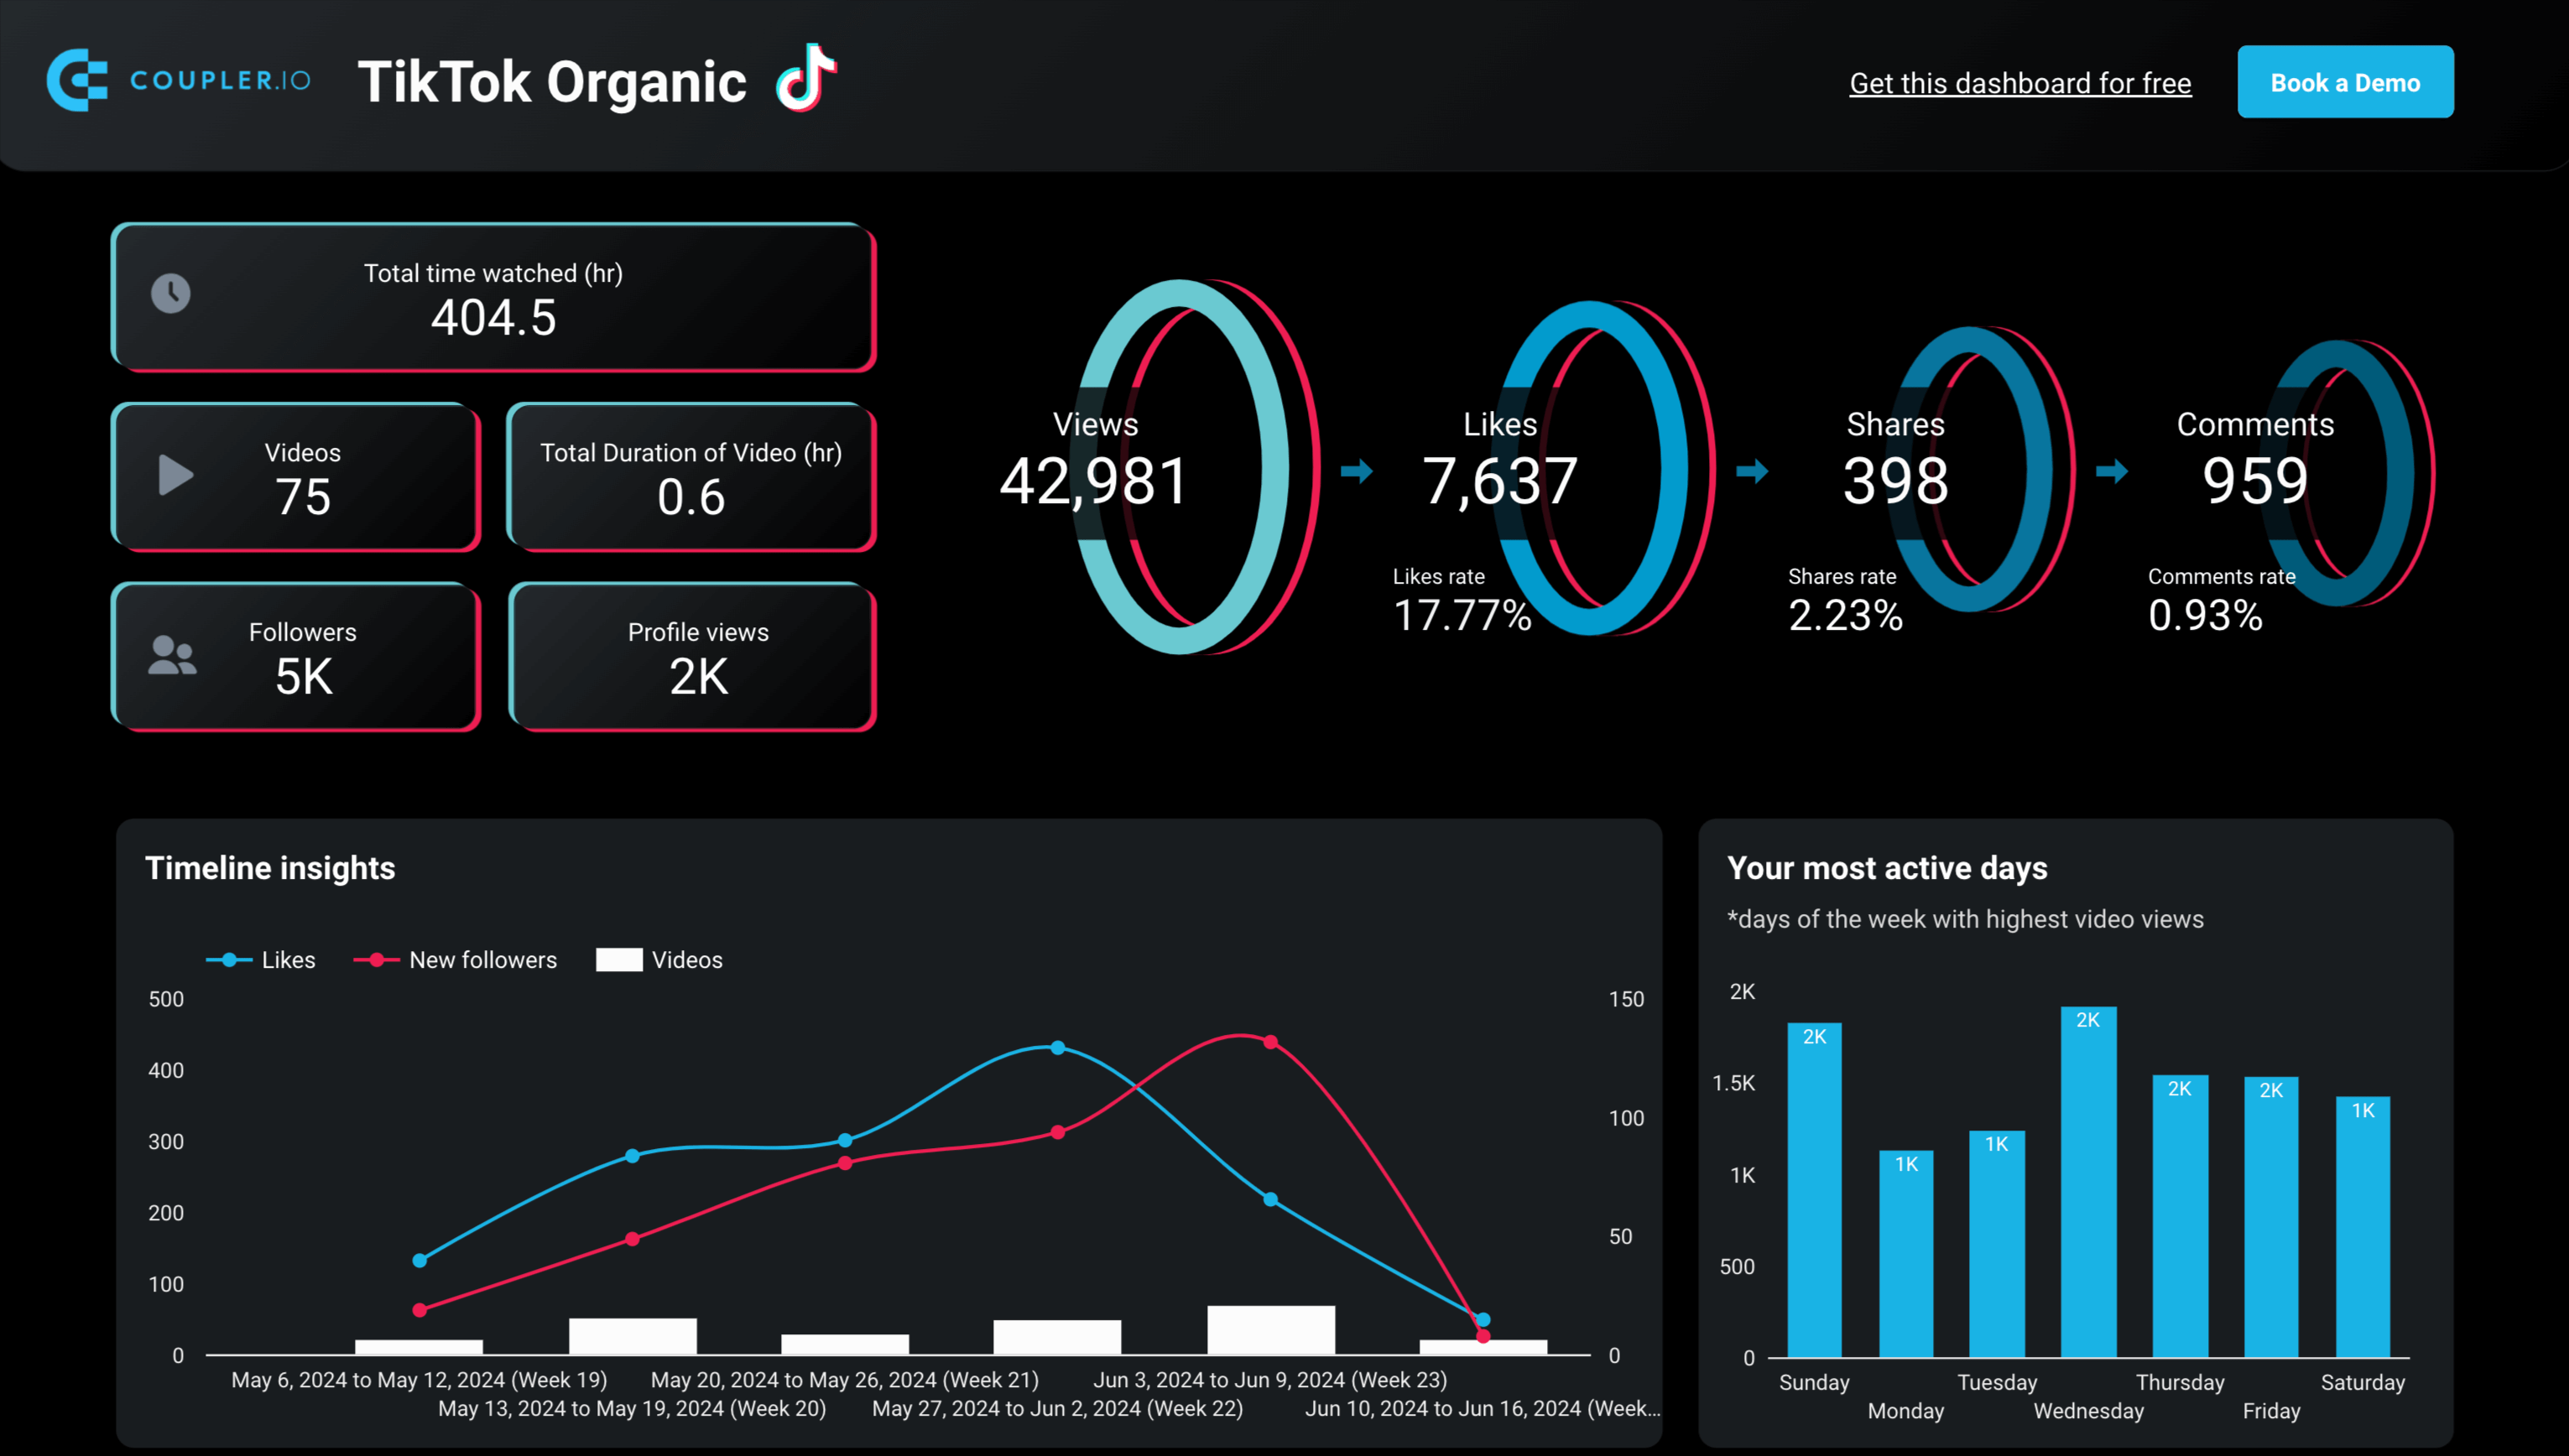
The dashboard could bring immense value by presenting all your TikTok statistics in a straightforward, user-friendly interface.
Assess content appeal
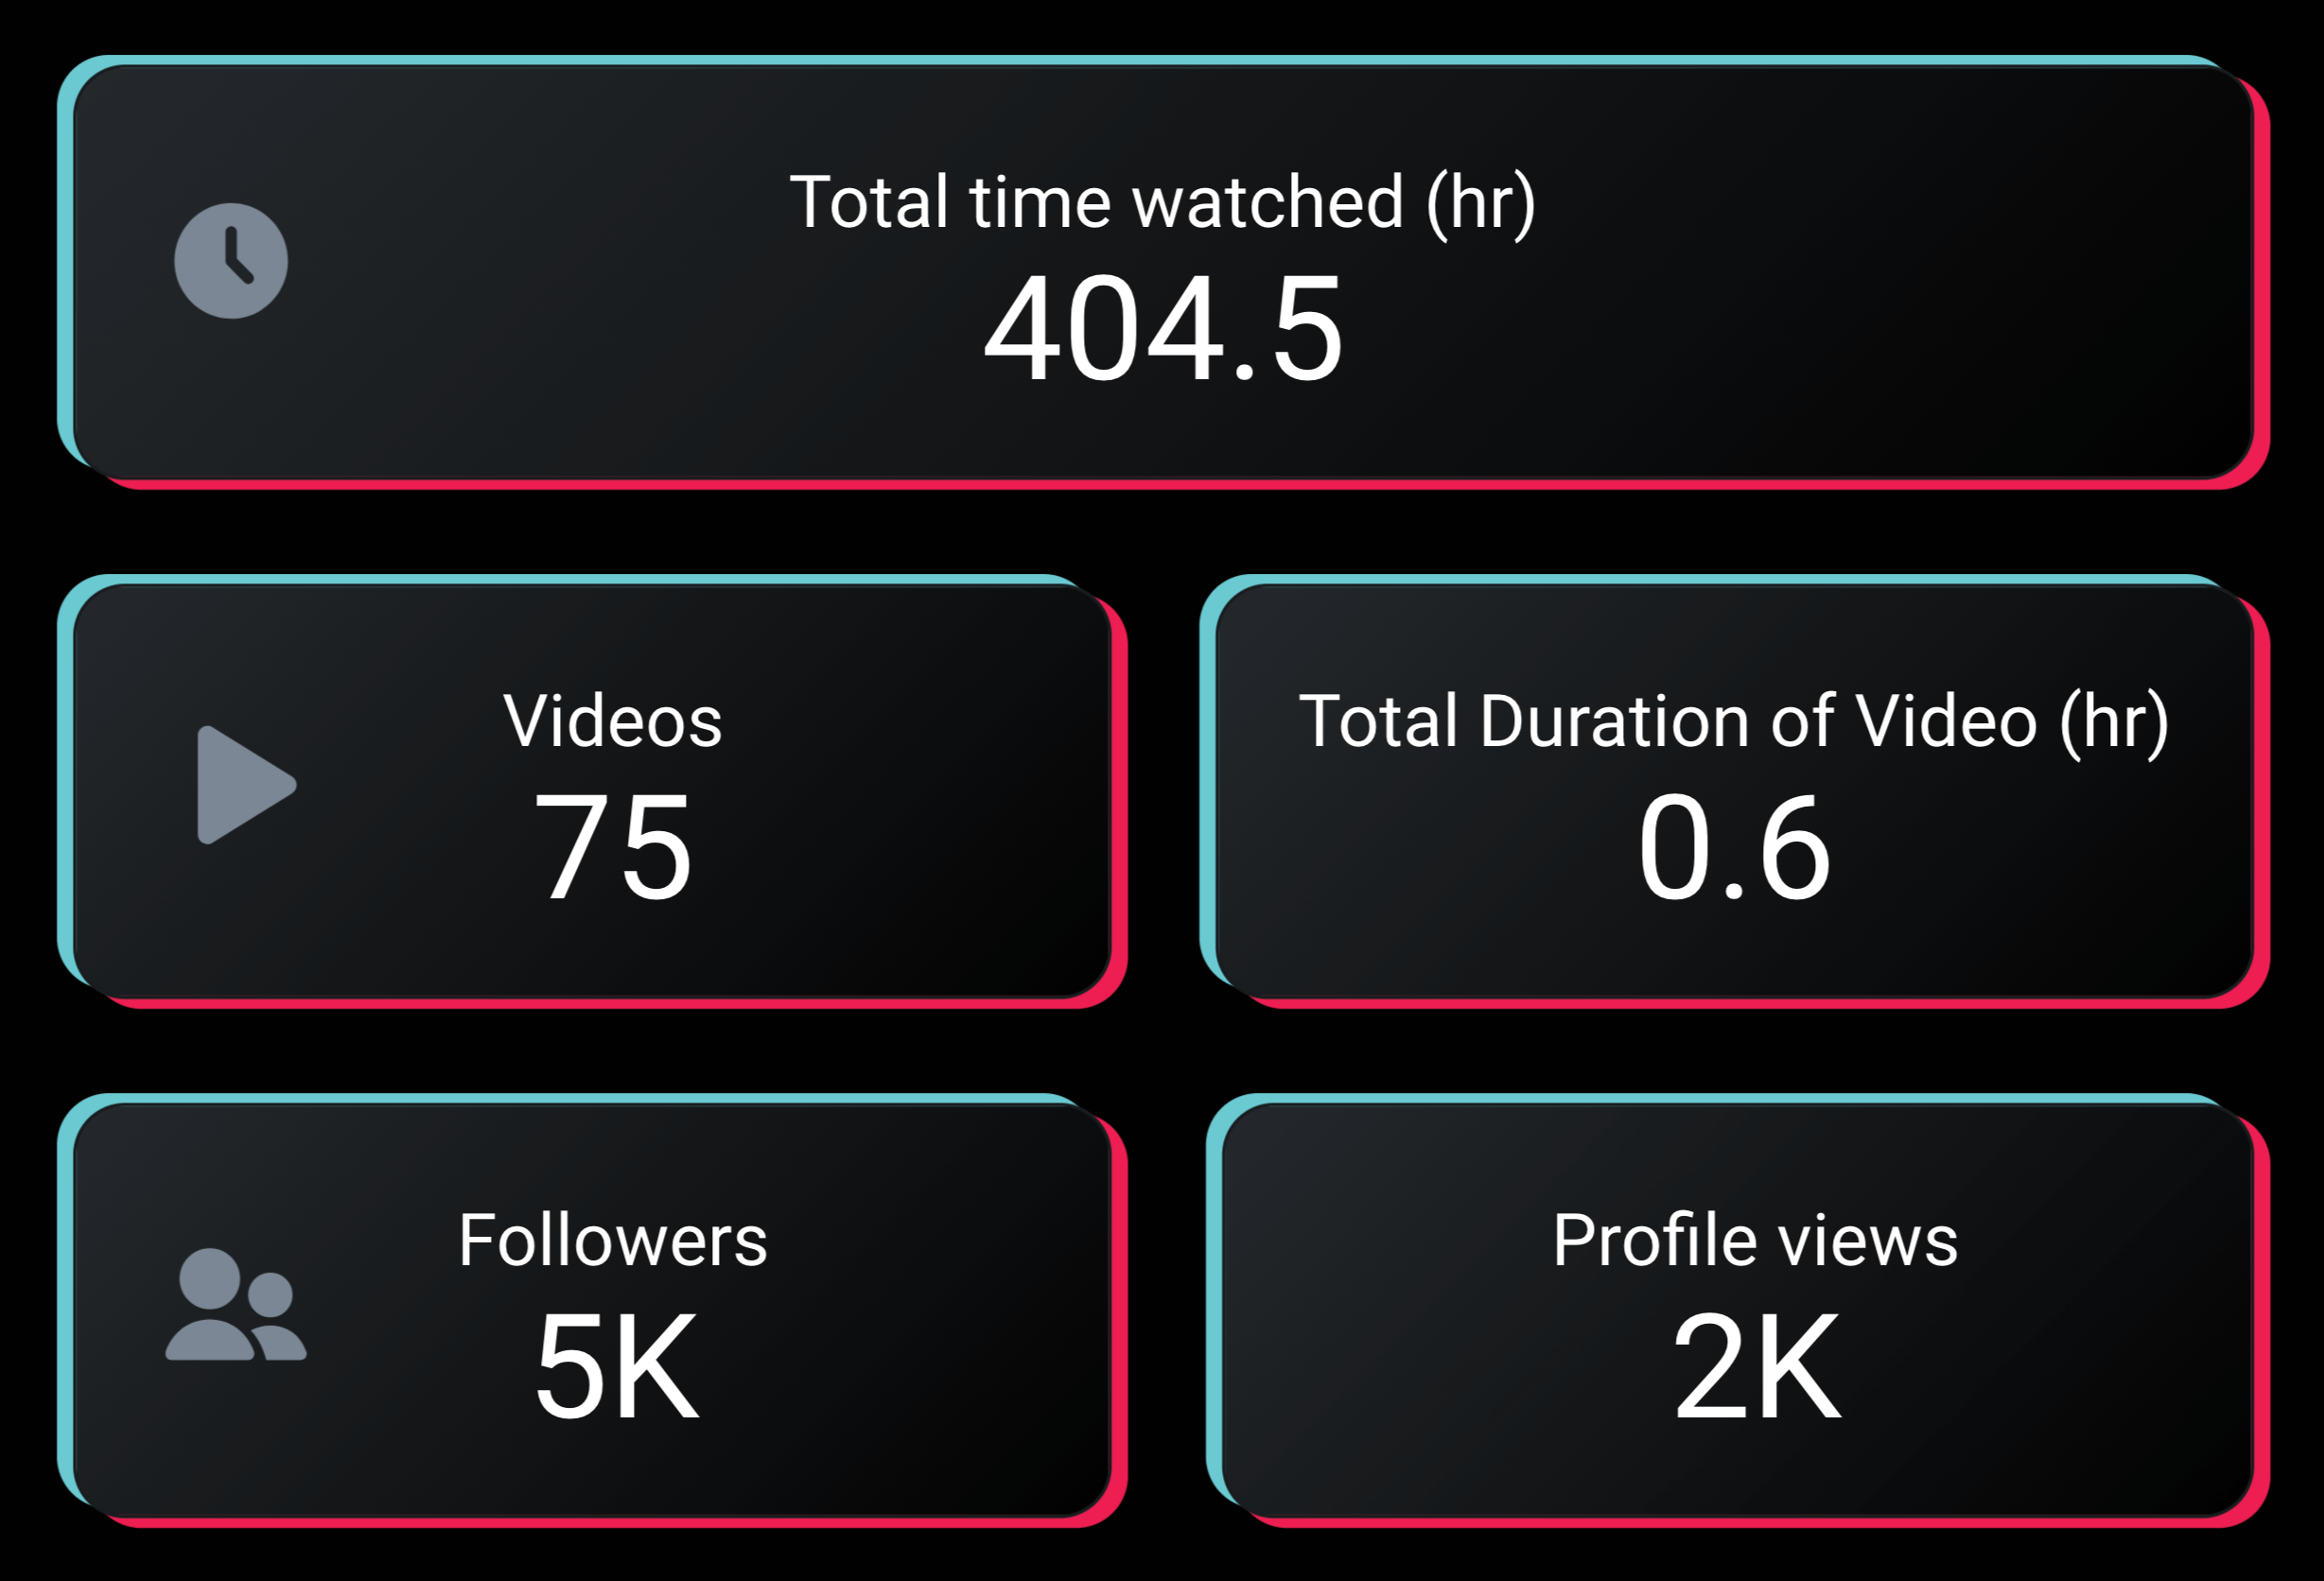
First and foremost, it will let you see how many hours people are willing to spend watching your content. That way, you’ll be able to understand your content’s appeal. You’ll also know how many videos you’ve posted, the follower count, the number of profile views, and the total duration of all videos.
Track viewer engagement and interaction
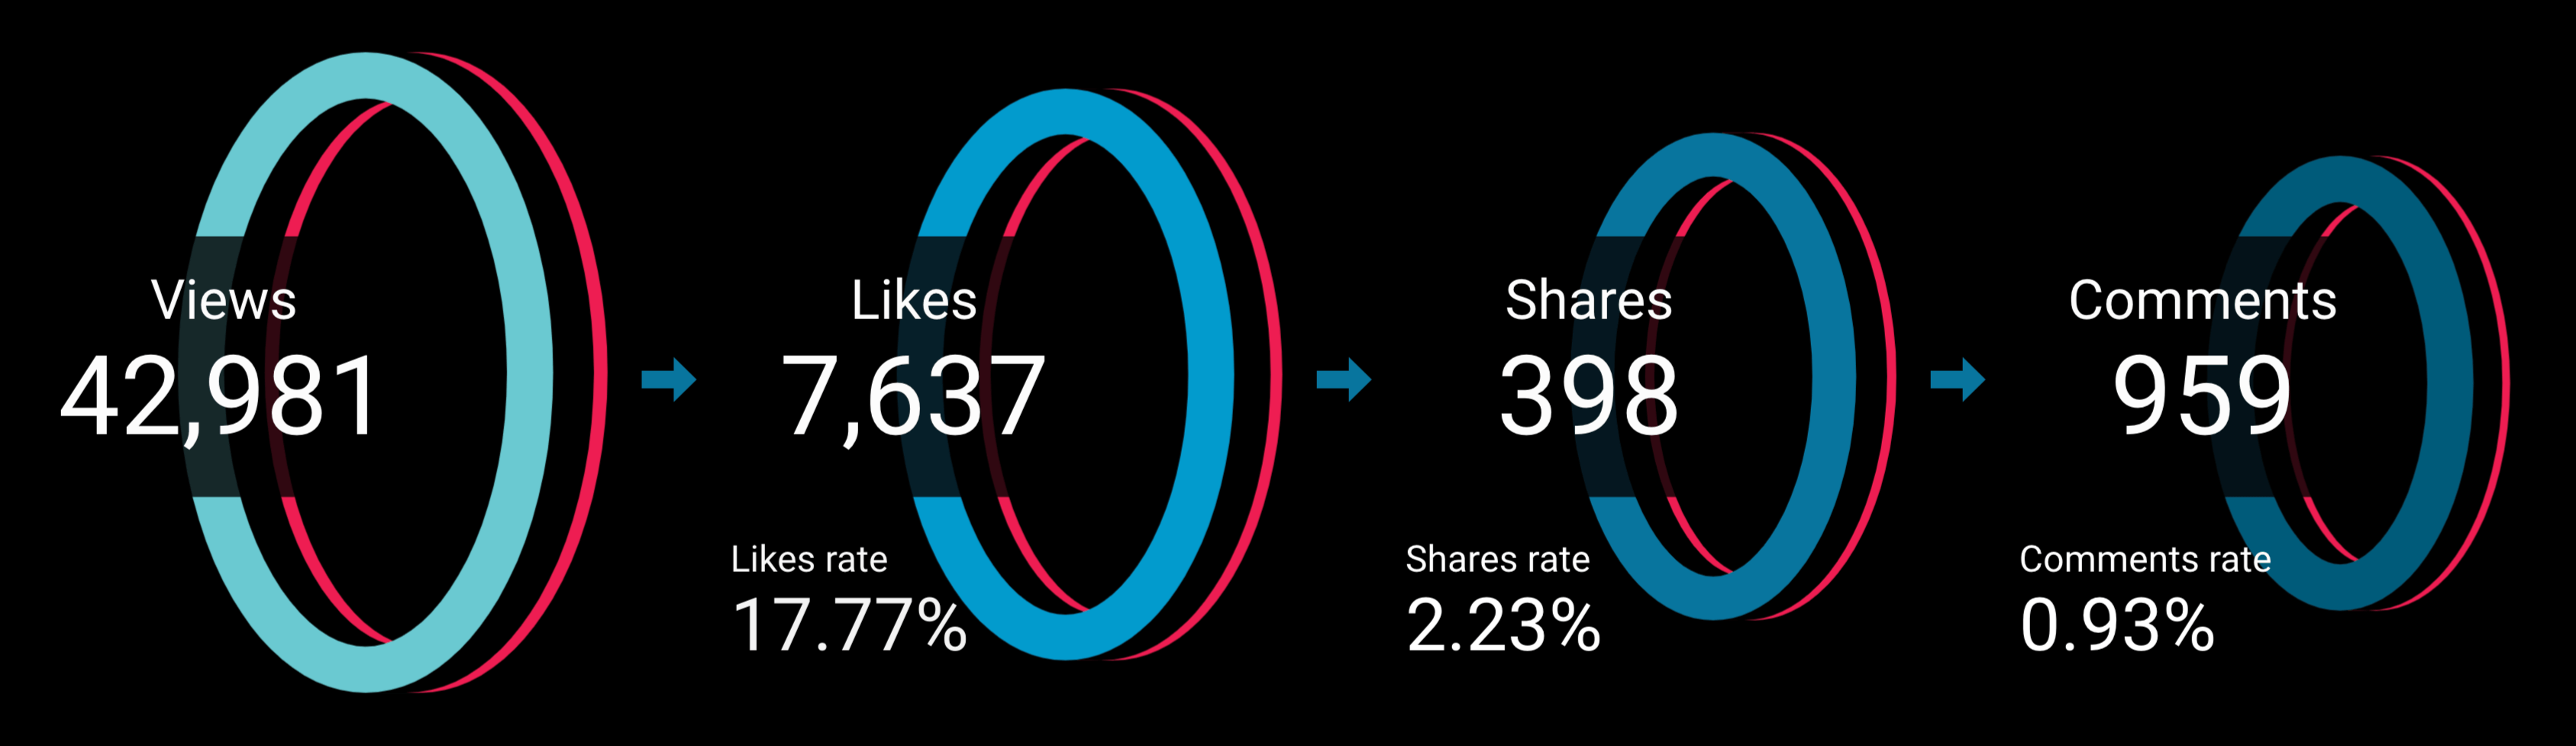
Next, you can visually track the journey of your TikTok videos as they interact with viewers. One option is to represent it as a conversion funnel; the first stage might be about the number of views you’ve got.
Following this, the second stage could reveal the number of likes. Consider that while many people watch your videos, not all will like them. So, you can additionally calculate the like rate, which is the percentage of liked videos. As a result, you’ll be aware of how engaging your content is.
The third stage in this funnel can demonstrate the total number of times users have shared your videos. Another metric worth including here is the share rate, which reflects the share percentage relative to the total views.
Fourth, you may cover the number of comments and the comments rate – the comment percentage relative to the view count.
Get timeline insights
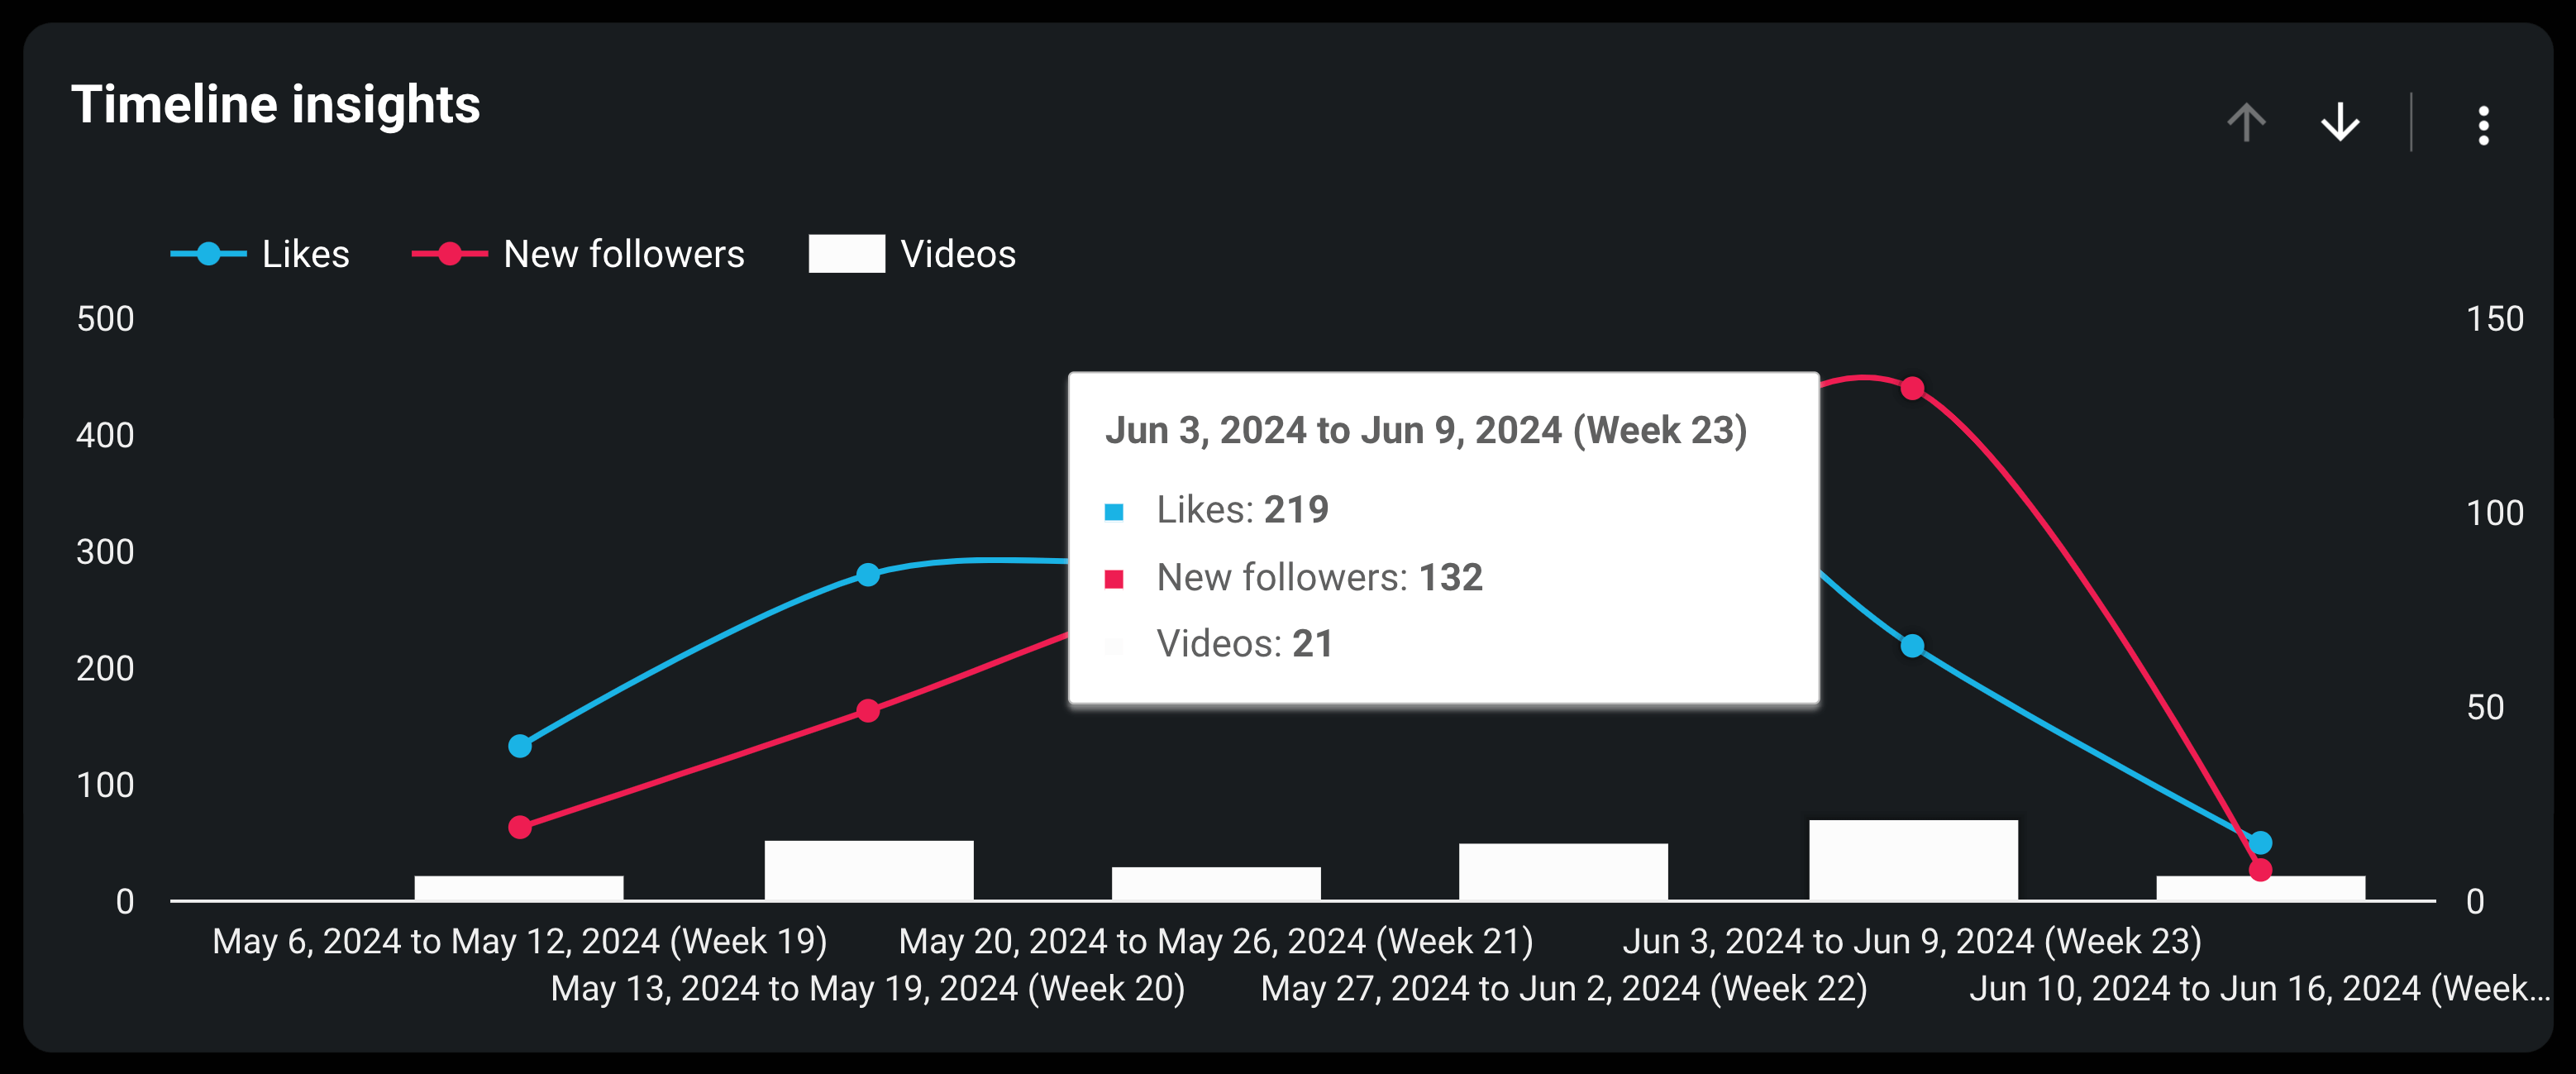
A TikTok dashboard can provide a historical perspective on your activity. For example, you’ll see the number of videos posted, likes received, and new followers gained over specific periods.
Suppose you posted the highest number of videos in weeks 20 (16 videos), 22 (15 videos), and 23 (21 videos). However, despite the quantity in week 23, likes were fewer (219) compared to weeks 20 (280 likes) and 22 (432 likes). This indicates that videos in weeks 20 and 22 were of higher quality.
Similarly, the number of new followers can highlight the most productive weeks regarding audience growth, such as week 23, with 132 new followers.
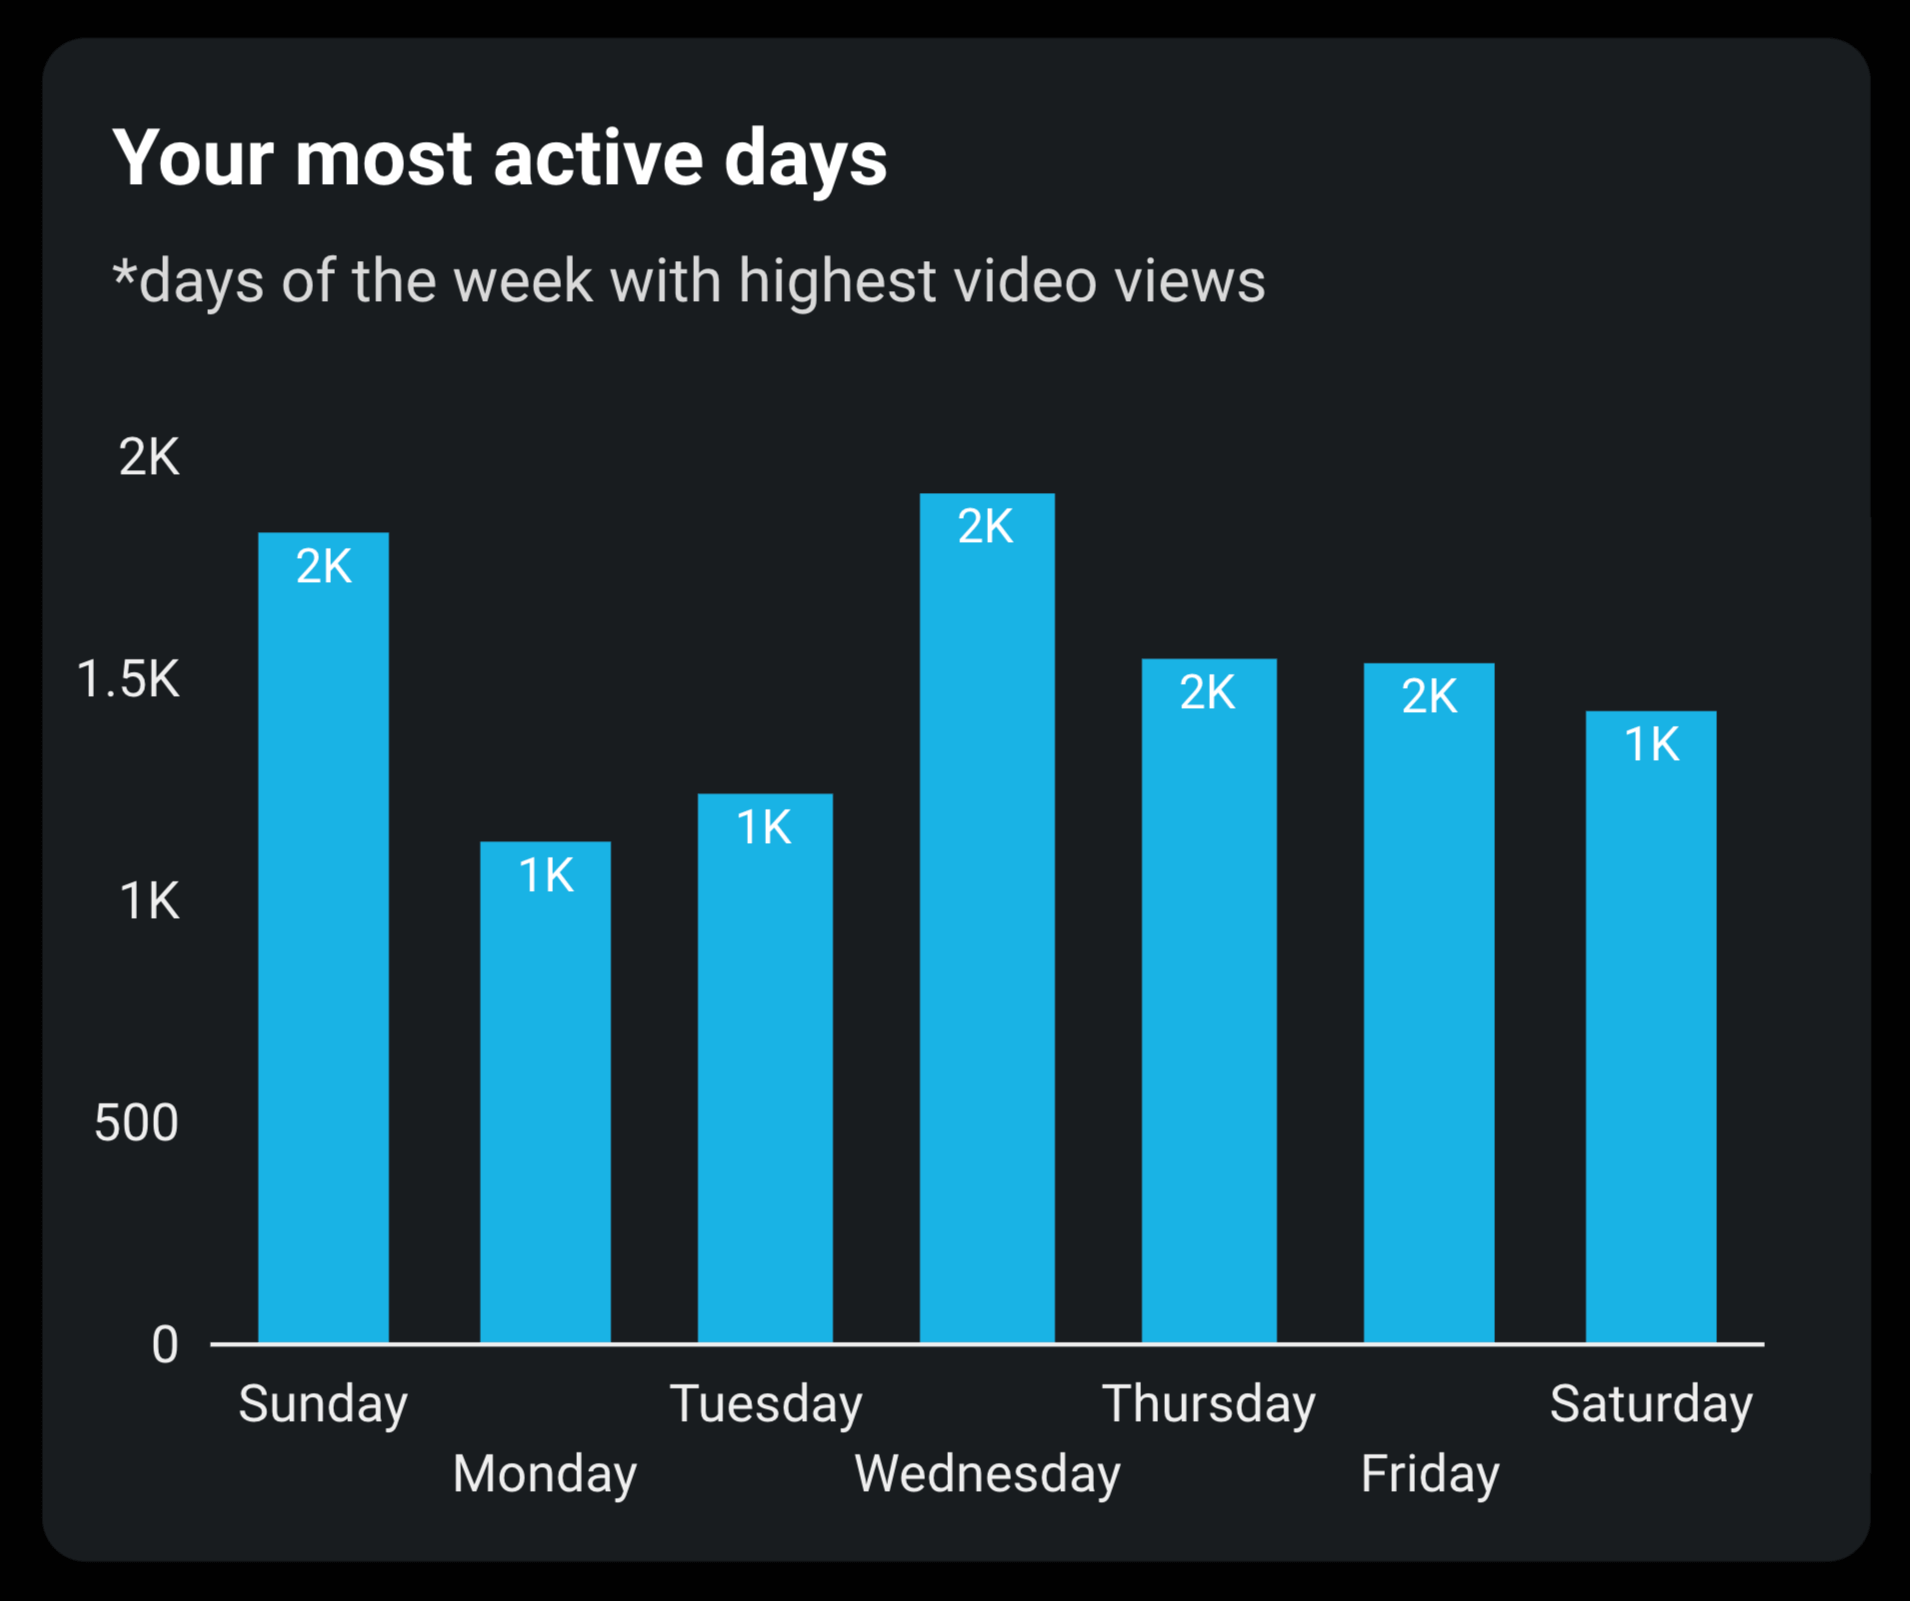
Check your most active days
You might also want to use a dashboard to learn about your most active days. This will show you which days of the week have the highest video views so you can identify optimal posting times.
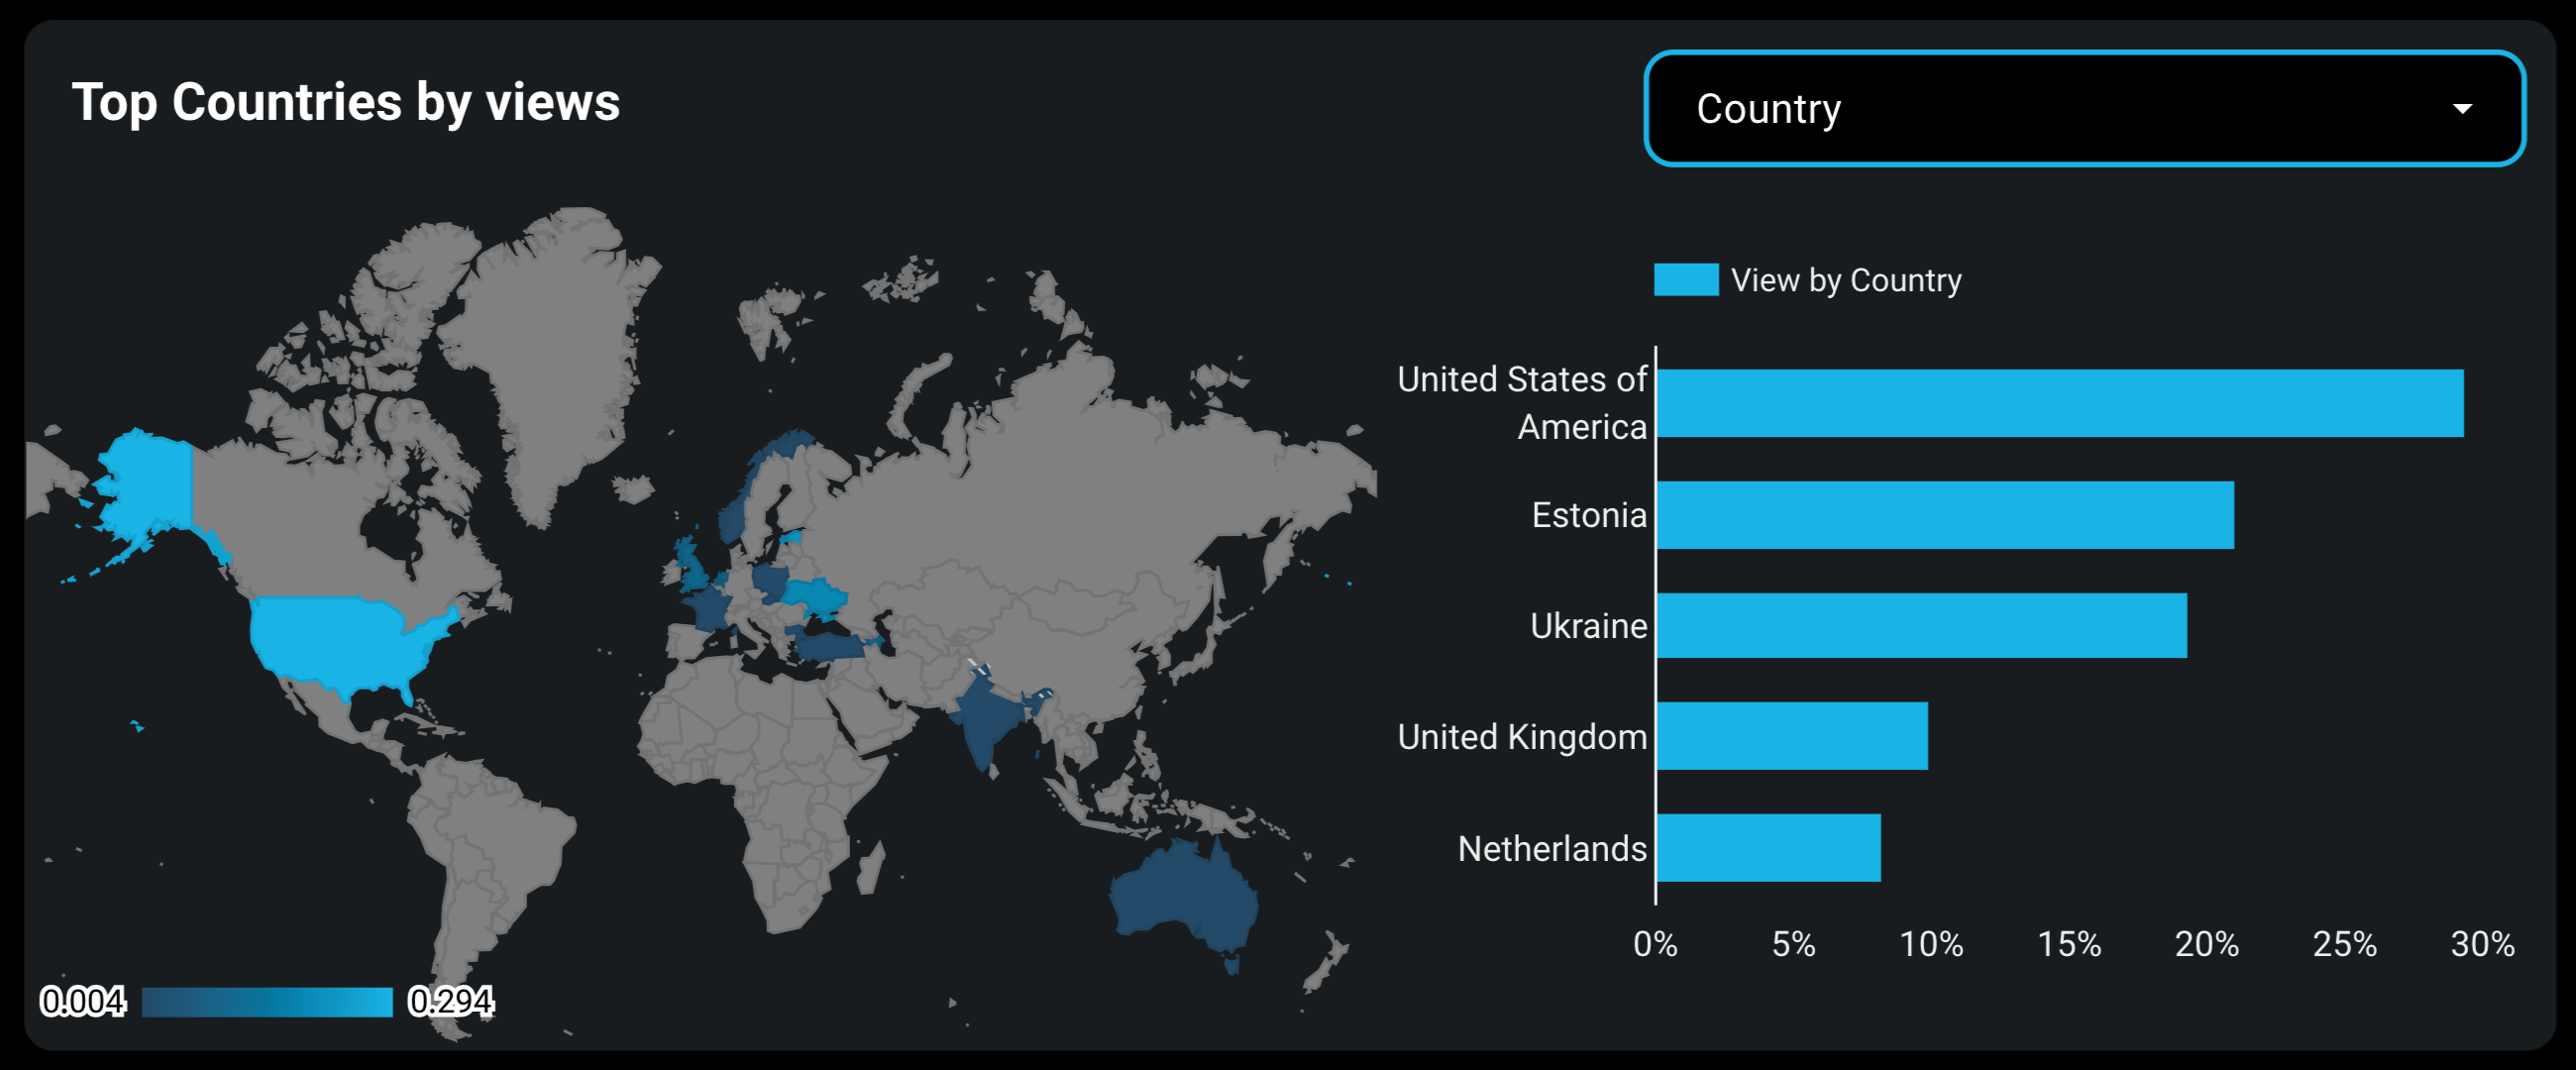
Discover top countries by views
Take advantage of country-based insights to know where your views come from. This data will let you understand regional audience engagement variations and, as a result, allow you to tailor your content strategies accordingly.
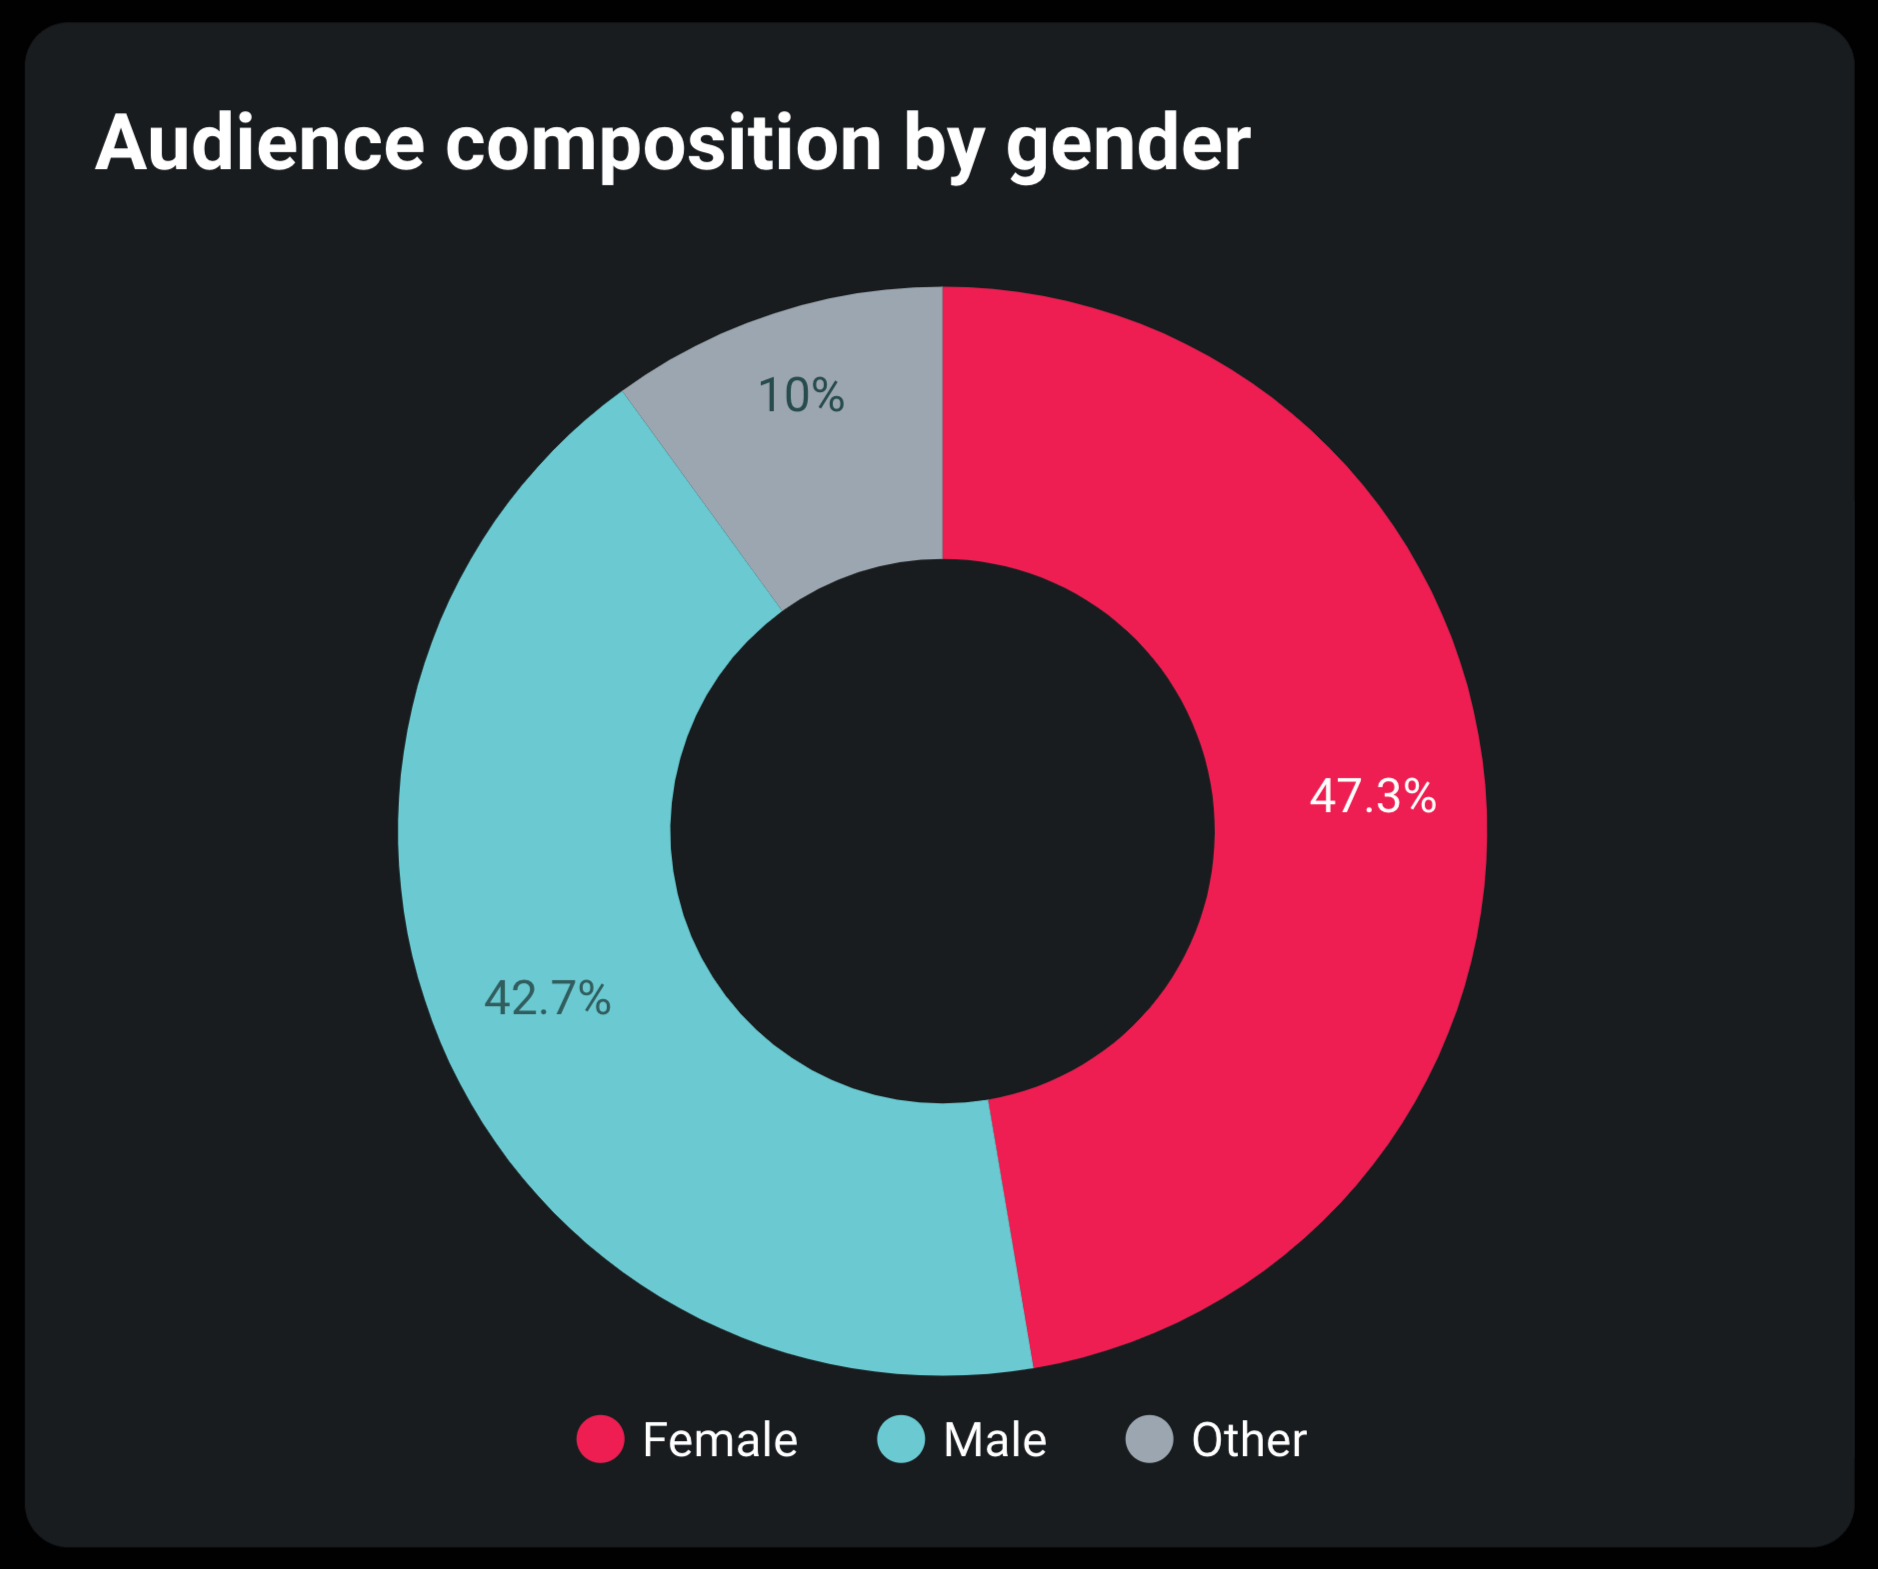
Explore your audience sorted by gender
Based on your viewers’ demographic breakdown, you can discover audience composition by gender. It will help you customize your TikTok content to suit the audience’s preferences.
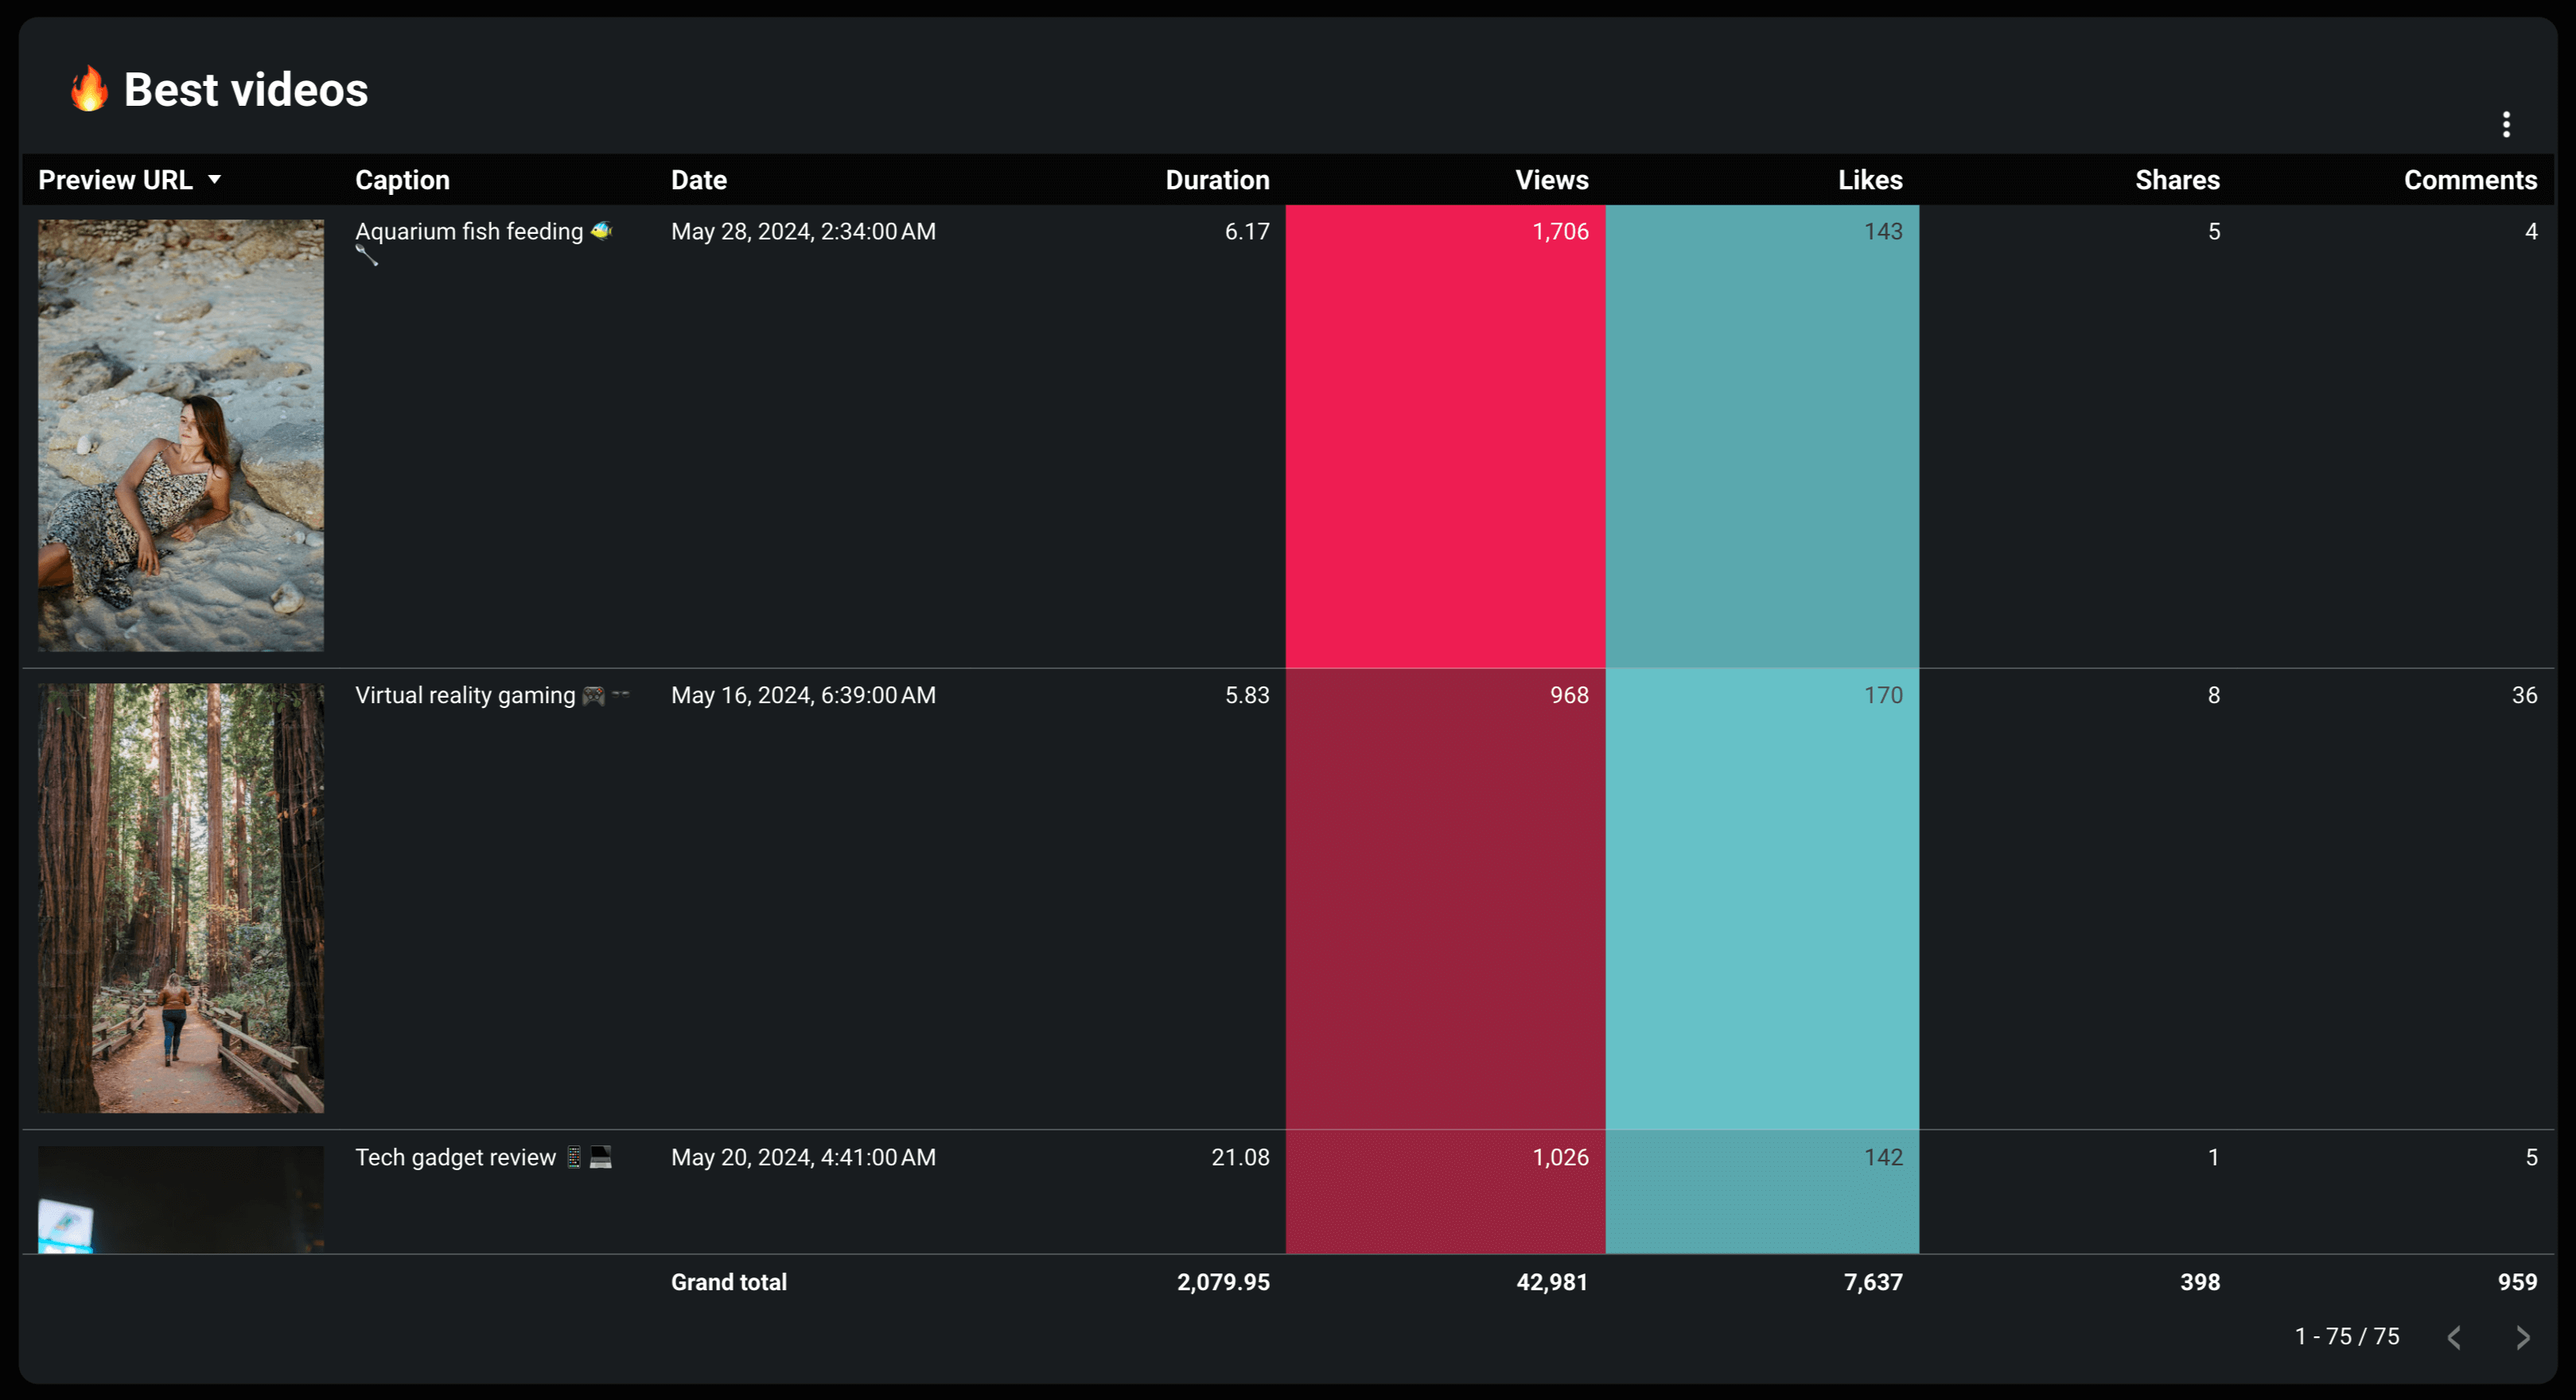
Identify the best videos
Lastly, see your top-performing videos sorted by views or other metrics. For example, you can sort them by likes to determine which videos generated the most user interaction.
Now, it’s time to learn how to create this dashboard, which we’ve explained below.
How to start using the TikTok dashboard template
It takes no more than a few minutes to set up this dashboard with the TikTok analytics report template:
- First, ensure you have the Coupler.io connector installed in Looker Studio. If you don’t, click this link to get it done.
- Second, follow another link to sign up (no credit card required), start configuring the dashboard, and create an automated data integration. If you are already a Coupler.io user, this link will direct you to the importer, so you’ll skip signup.
- Connect your TikTok account.
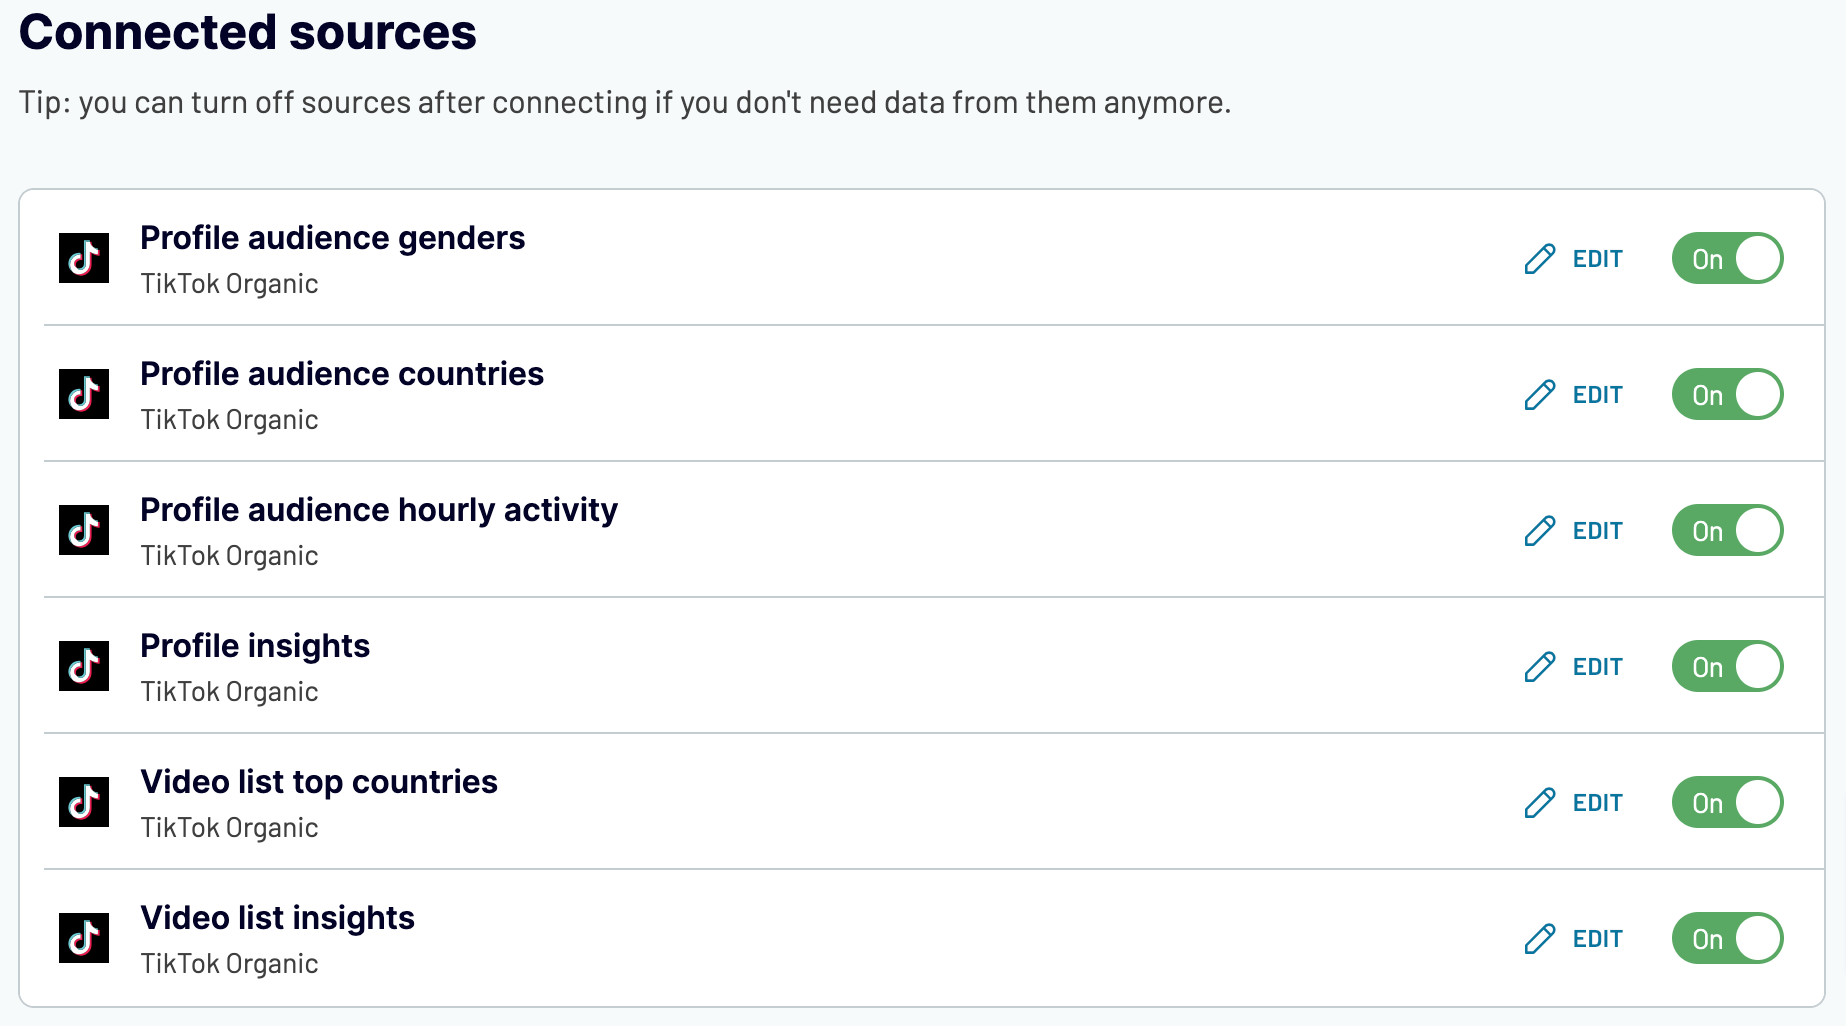
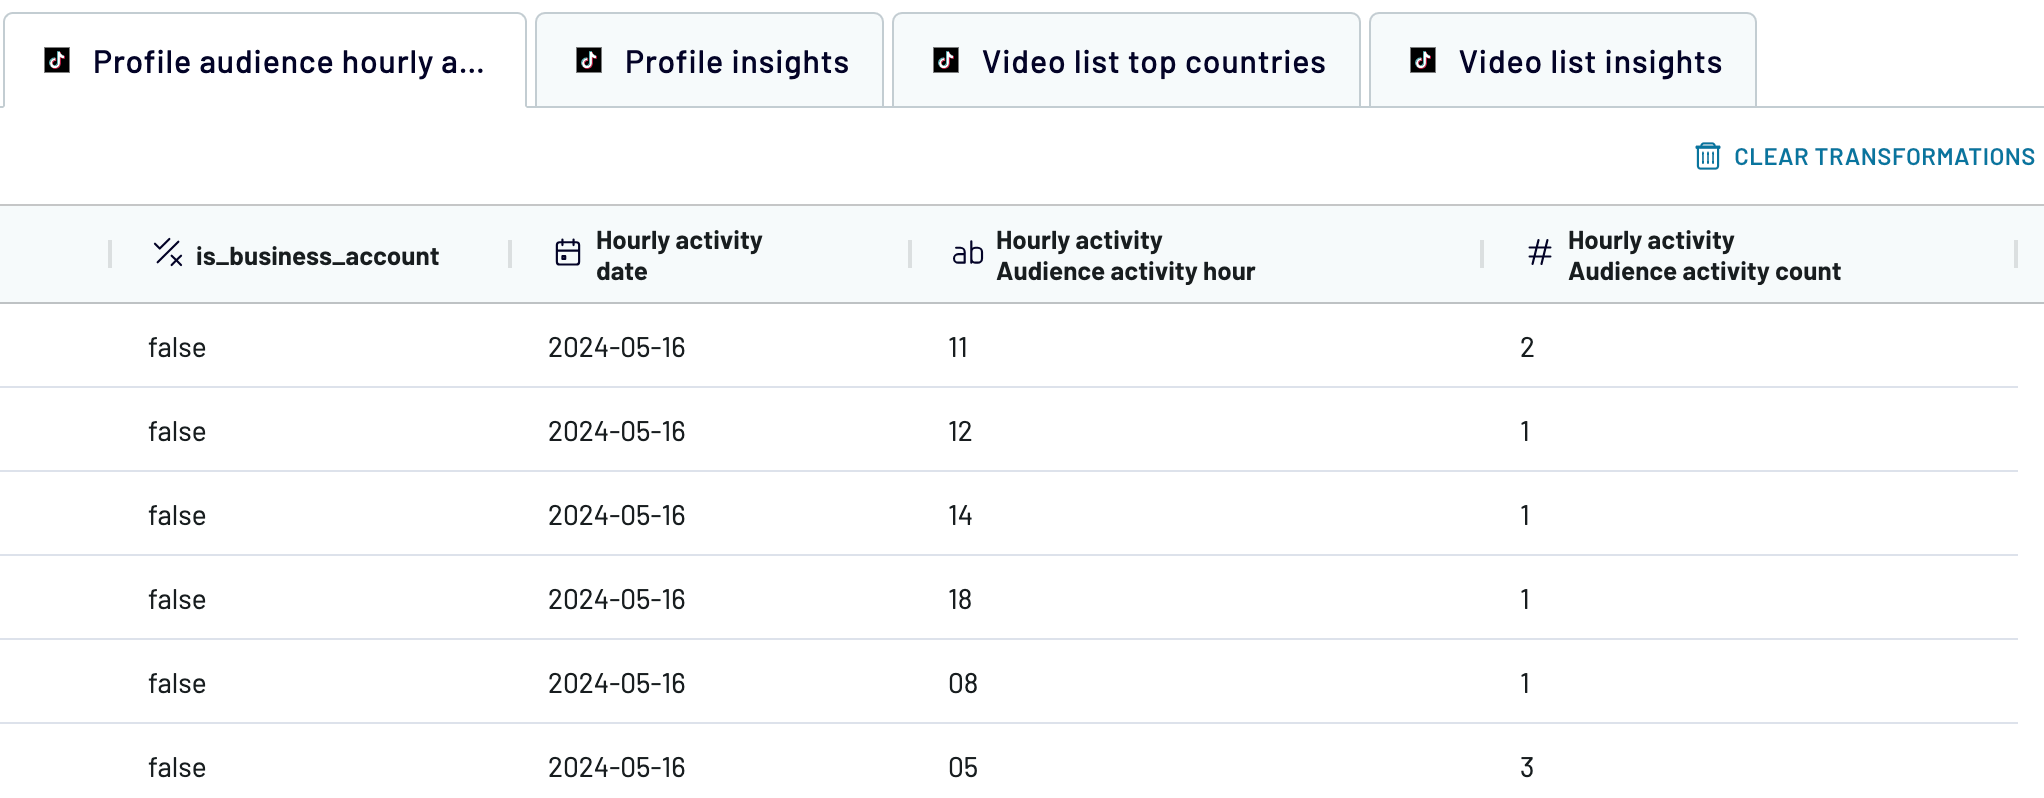
- Proceed to preview the data you’d like to include in the report. No actions are needed here.
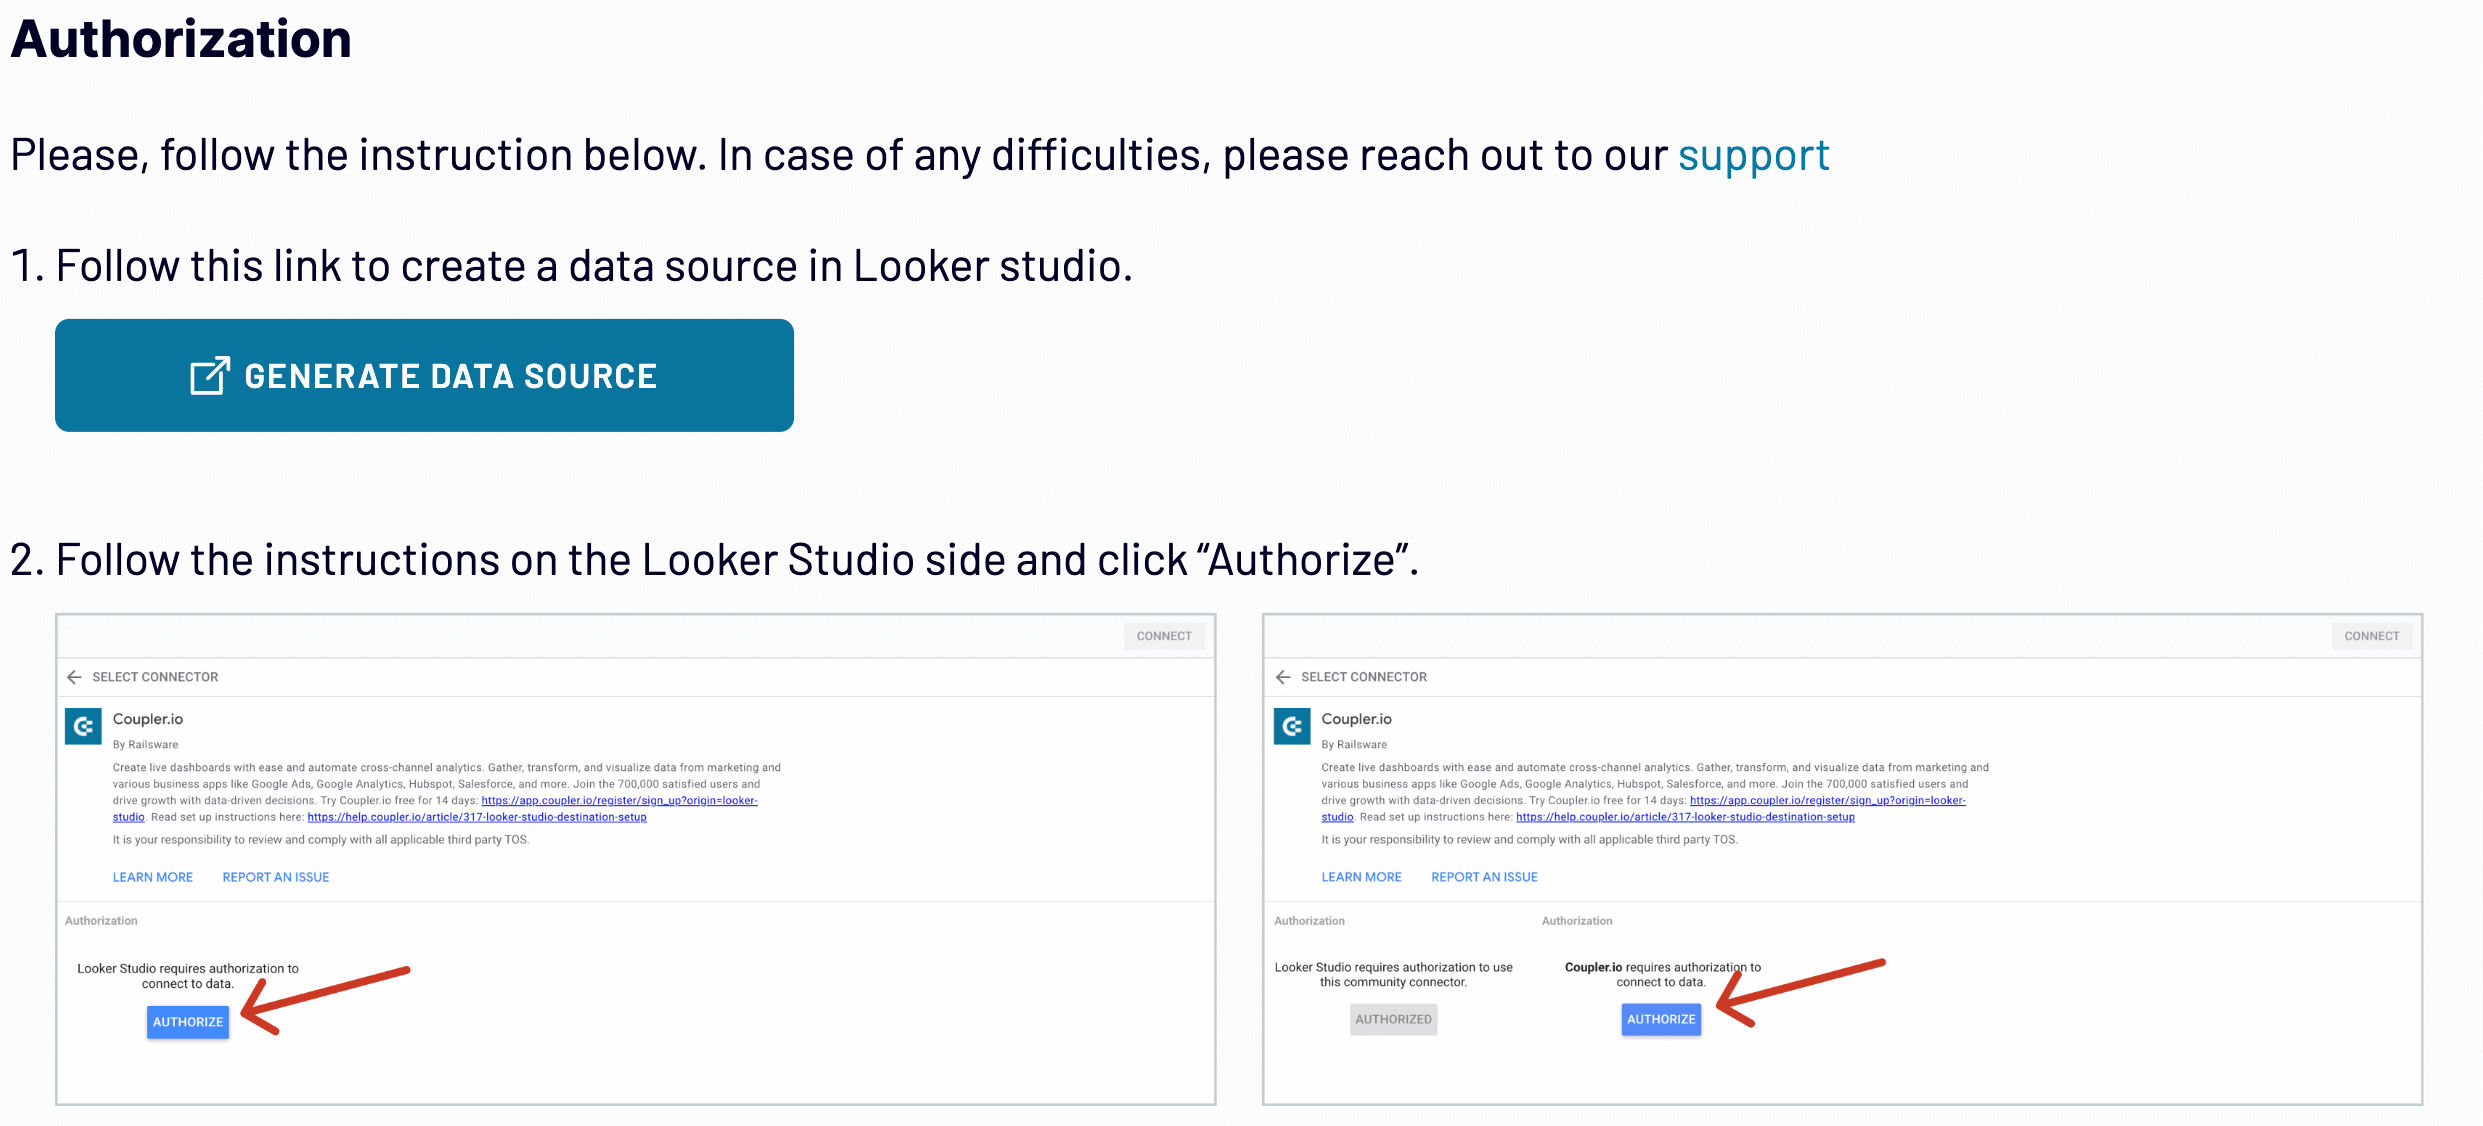
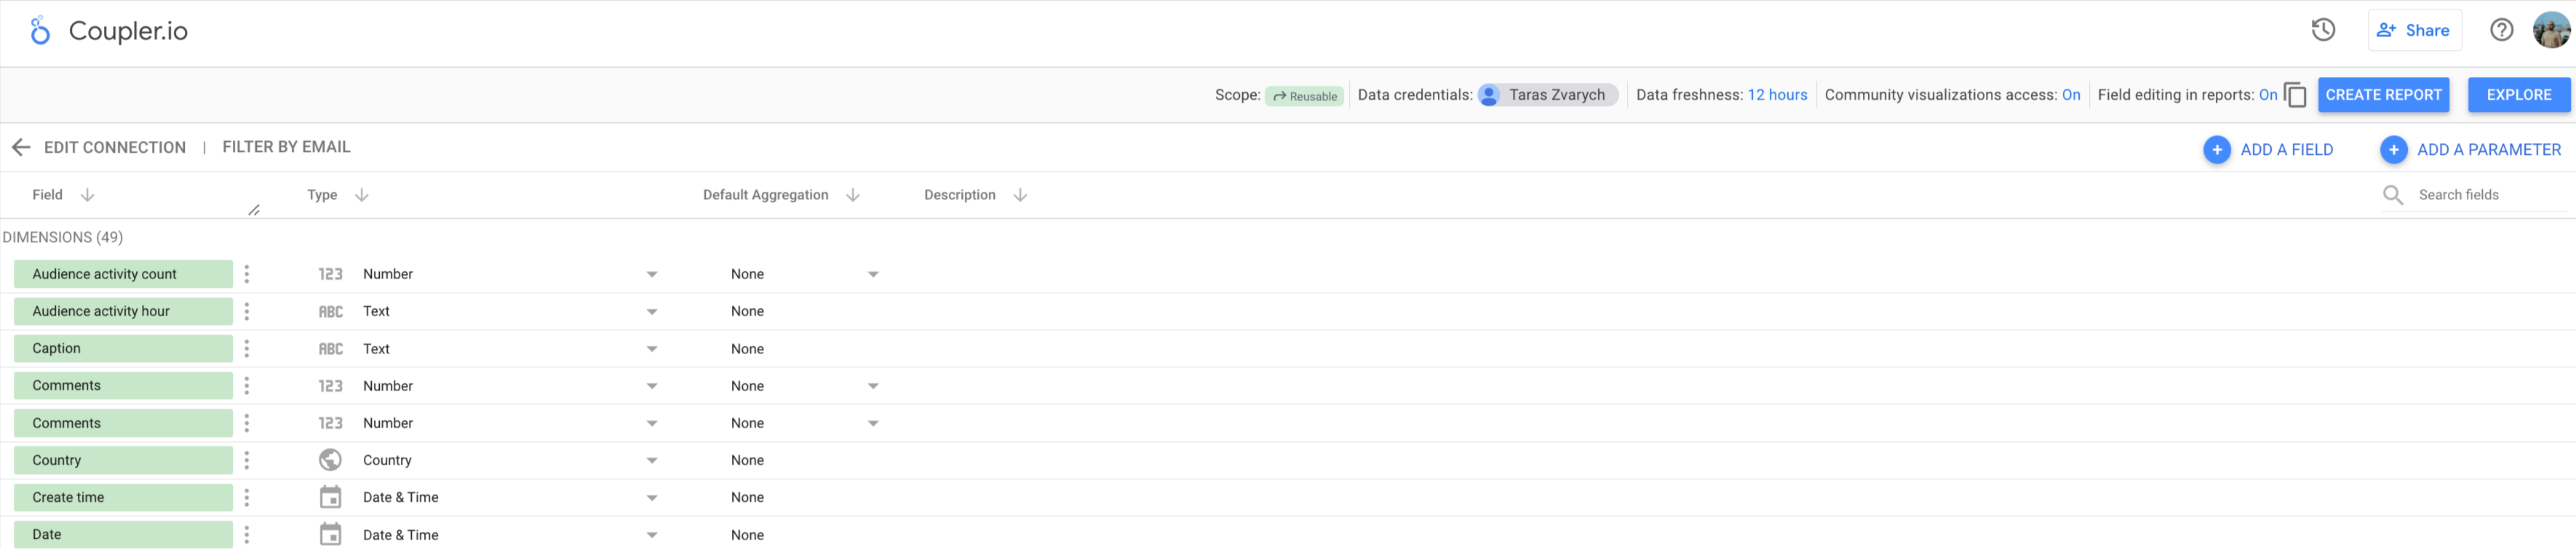
- Move to the next step and follow the in-app instructions to authorize the connector and create a data source in Looker Studio.
- The final click should be on the Create Report button.
Wait a moment to receive a copy of the TikTok analytics report. By default, your dashboard will update automatically every day. If you want this more frequently or in near real-time, return to Coupler.io and adjust the schedule settings.
Add the dashboard to your bookmarks so you always have TikTok data readily available.
What metrics do you include in the TikTok analytics report?
Here’s an overview of essential metrics to include in your report:
- Total time watched shows the cumulative time users have spent watching your videos. This metric helps you evaluate overall interest in your TikTok content and identify which videos keep the audience engaged the longest. If you understand what type of content holds viewer attention, you can create more engaging videos.
- The number of videos published on TikTok is crucial for maintaining a consistent posting schedule. It ensures you produce enough content to keep the audience interested.
- Total duration of videos. This metric represents the combined length of all your videos. Analyze it to understand the correlation between video length and audience engagement. It lets you determine the optimal duration, as longer and shorter videos impact viewer retention differently.
- The total number of followers reflects your account’s popularity and the effectiveness of content in attracting new viewers. It reveals the growth of your audience over time. An increase in followers indicates a rising interest in your content.
- Profile views illustrate how many times users have visited your TikTok profile. It helps you assess how often viewers are interested in learning more about you after they watch your videos. An uptick in profile views suggests that content is compelling enough to drive viewers to your profile, potentially leading to follower growth.
- Views are the total number of times users have watched your videos. Track it to measure the reach of content and identify the most popular posts. Higher view counts signify that a broader audience accesses and appreciates your content.
- Likes are a quick indicator of content approval. They evaluate an immediate positive response to your content. Check which videos receive the most likes to understand what resonates most with the audience and refine your content strategy accordingly.
- Shares extend the reach of your content. They let you know how often viewers recommend your content to others. This figure indicates broader appeal and the potential to reach new audiences through viewer recommendations.
- Comments imply higher engagement levels. Use them to measure the interaction and conversation your content generates. Find out what sparks discussion among your viewers.
- New followers. This one displays the number of new followers gained over a specific date range. Consider this metric to assess the impact of recent content and campaigns on attracting new audiences.
Your analytics don’t stop there. To get deeper insights into the impact of your TikTok campaigns, learn how to leverage first-party data for optimization.
Why do you need the TikTok organic dashboard?
Finally, let’s review the reasons why the TikTok dashboard is worth it:
- For influencers: Imagine you’re an influencer looking to monetize your account. Advertisers need to know what they are paying for, and a dashboard is the best way to present your statistics and make you look professional.
- For agencies and freelancers: If you manage TikTok accounts for clients, you need to report your results. Instead of manually making a new report each month, you can have an automated dashboard available for clients at any moment. This not only highlights your reliability but also makes it more enjoyable to work with you.
- For employees: Does your business invest in TikTok as a marketing channel? If so, it’s best to showcase your progress through a dashboard so you won’t have to prepare a presentation at the last minute before a reporting meeting. Your colleagues will appreciate your data analytics.
Save time and automatically turn data into accurate visualizations with Coupler.io’s TikTok analytics dashboard template!
Automate TikTok analytics with Coupler.io
Get started for free


