Tracking the performance of your videos on TikTok is crucial for understanding what works for your audience and what doesn’t. This is key to gaining more views and clicks and growing your presence on TikTok’s FYP (ForYouPage).
The easiest way to get started is by using ready-made TikTok reporting templates that help you spot trends, adjust your strategy, and stay ahead in TikTok’s competitive space.
In this post, we’ll explore 8 must-have TikTok report templates designed to provide a clear view of your performance metrics.
1. TikTok analytics dashboard template by Coupler.io
This TikTok Analytics Dashboard by Coupler.io analyzes the performance of your content. It tracks essential metrics needed to understand what drives your success on TikTok.

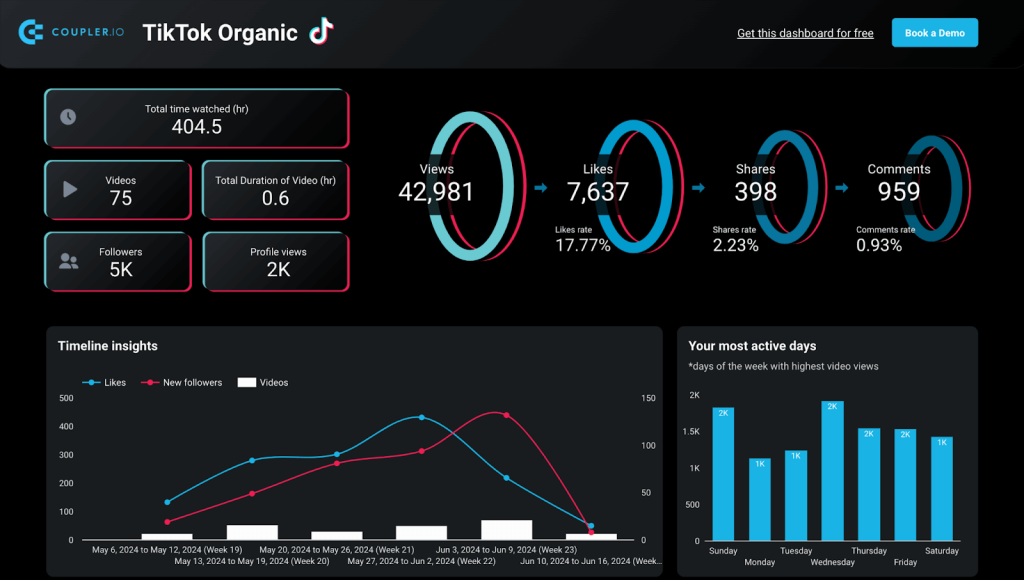
With this dashboard, you can monitor KPIs such as views, likes, shares, and comments to analyze how your audience interacts with your posts. You can also monitor your profile visits, follower count, and average video watch time. With this data, it’s easy to monitor and optimize your content to get more views and attract more followers.
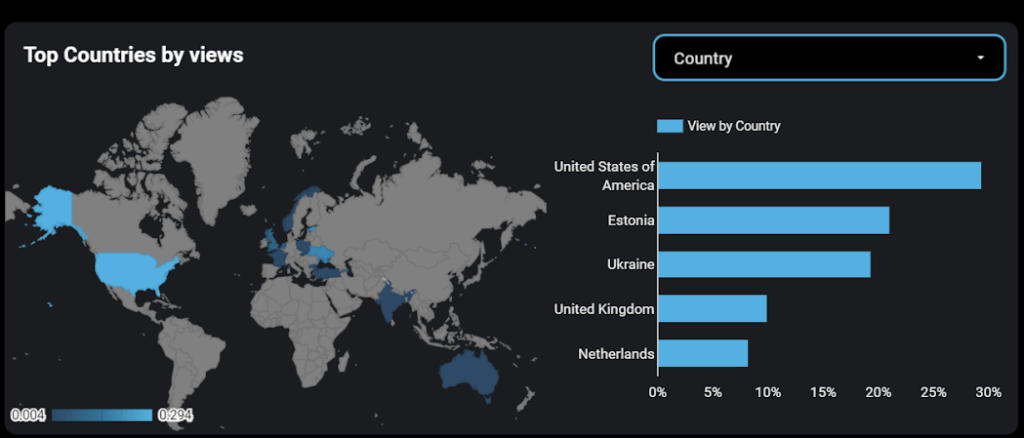
This dashboard displays which countries and genders engage with your content the most. You can utilize this information to adjust your strategy and create relatable content that resonates with the audience in each geographical area you are targeting.

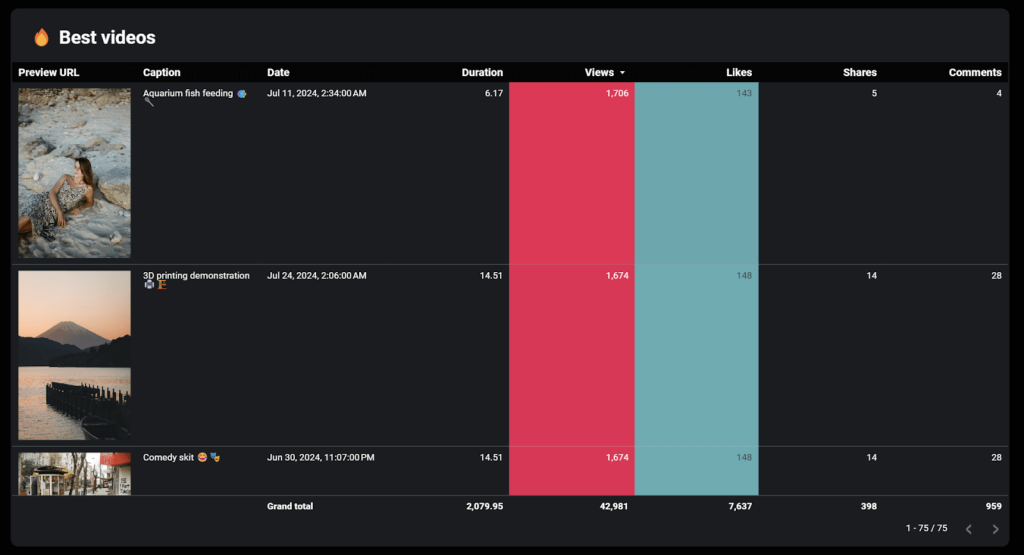
In addition, the report displays a list of your best-performing videos along with their stats. This table allows you to sort data by video durations, number of views, likes, and other metrics, making it quite handy for performance analysis.

This template is integrated with Coupler.io’s TikTok connector, which automates your data import to Looker Studio. As a result, you get a live dashboard that can be built in minutes.
Key Metrics:
- Views
- Likes
- Shares
- Comments
- Profile visits
- Followers
- Total time watched
- Videos created
- Profile views
- Followers
- Top countries by views
- Audience composition by gender
Cost: Free to use
2. TikTok Ads dashboard template by Coupler.io
This TikTok Ads template created by Coupler.io helps improve your ad campaigns by providing comprehensive insights into ad spend, video performance, and audience engagement.

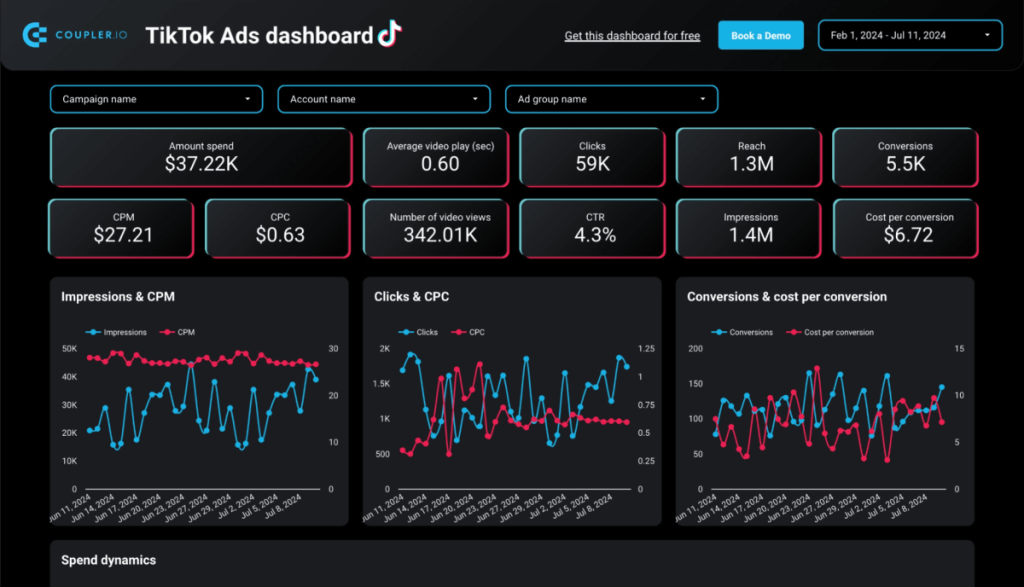
The dashboard showcases key metrics such as impressions, CPC, clicks, reach, and conversions. These are all essential indicators for monitoring campaign health and optimizing your ad performance.
One of the advantages of this reporting template is that you can connect multiple TikTok accounts and get aggregated data in a one-page dashboard. There are filters that let you explore data by account, campaign, ad group, and time period.
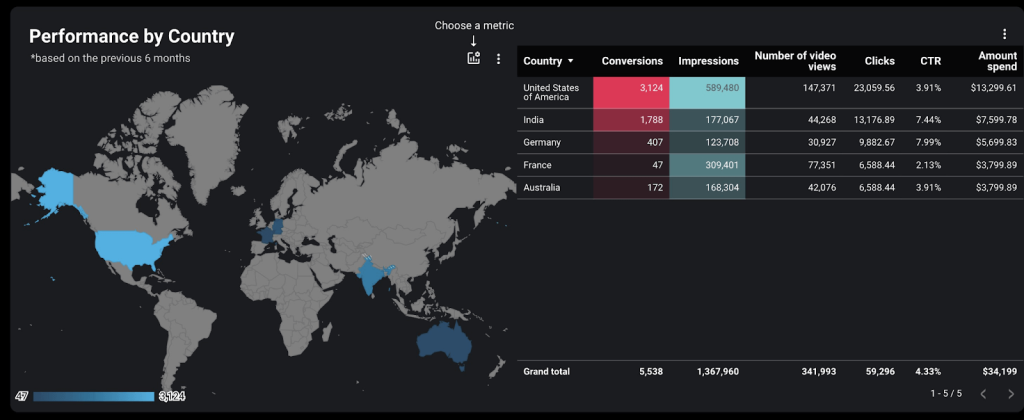
The template includes a geo map displaying performance by country. This feature makes it easy to identify which regions generate the most clicks and conversions.

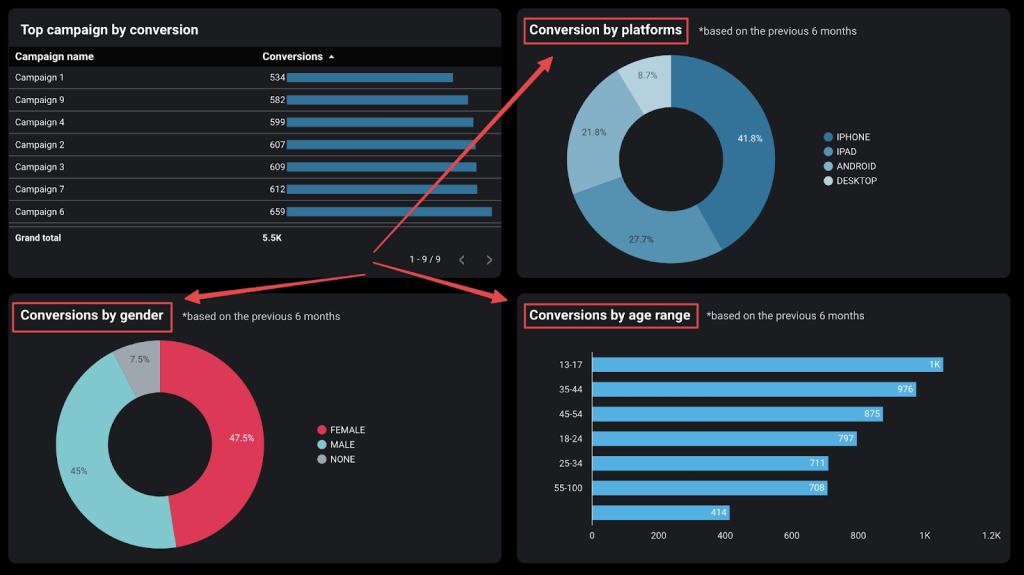
The dashboard further breaks down conversions by gender, platform, and age range. This provides a detailed view of how different demographics respond to your ads.

The template is built in Looker Studio and integrates with the Coupler.io connector to automate data imports from TikTok Ads.
Key Metrics:
- Ad spend
- Video views
- Clicks
- Reach
- Conversions
- Impressions
- CPM (Cost per Mille)
- Average video playtime
- Conversions by gender, platform, and age
- Performance by country
Cost: Free to use
For more information on how to work with your TikTok data, have a look at our article about TikTok Ads analytics.
3. TikTok report template by MetriCool
MetriCool offers a 4-page TikTok report template that provides comprehensive insights into your organic TikTok data.

You can quickly link your data and have your report ready instantly. The template features a side menu for easy navigation between pages, similar to navigating a website.
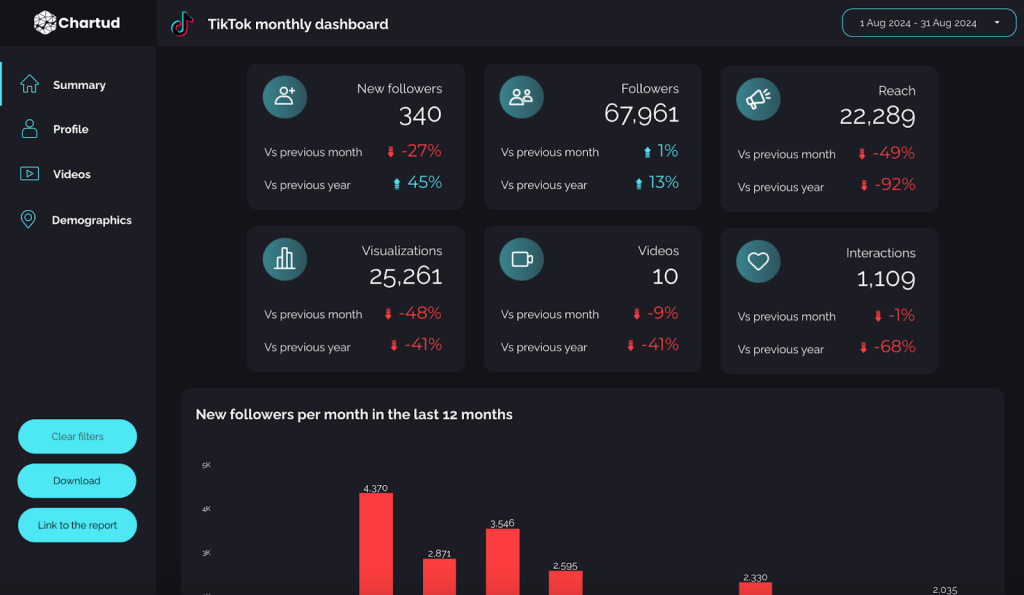
The Summary page displays key metrics such as new followers, total followers, reach, visualizations, videos, and interactions. It also compares growth results to the previous month and year, providing a quick snapshot of performance trends.
The Profile page tracks your account’s evolution over the last 12 months. The Videos page dives deep into video performance, showing views, engagement, and interactions for each video, alongside a breakdown of video impressions and average viewing time. Finally, the Demographics page displays a detailed breakdown of followers by gender and country, organized both in table and pie chart formats.
This template is fully customizable, allowing you to adjust the colors, logo, and metrics as needed. Upon purchase, you will get instructions for connecting your data sources.
Key Metrics:
- New followers
- Total followers
- Reach
- Video views
- Interactions
Cost: €49.70
4. TikTok analytics dashboard by Rows
This TikTok report template by Rows provides a comprehensive analysis of your TikTok performance with real-time updates and detailed metrics.

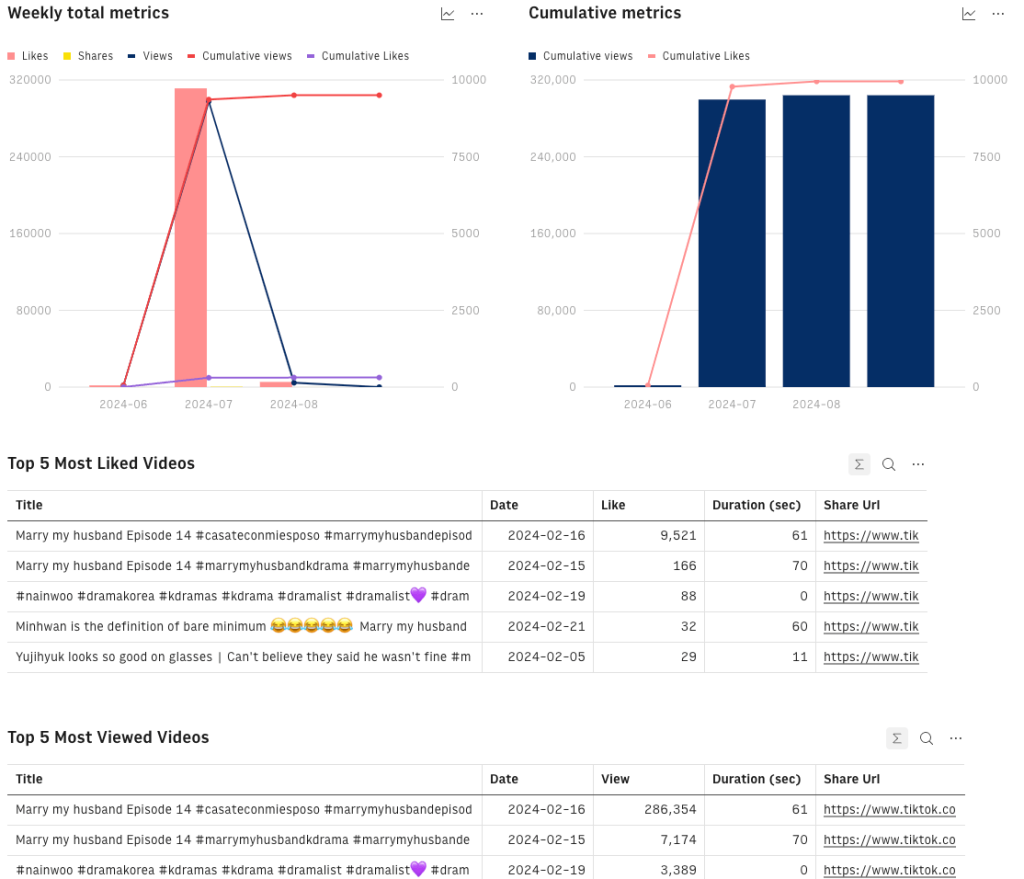
It tracks important KPIs, including follower count, likes, shares, and video views. This gives you a complete picture of your presence on TikTok. It also provides weekly and cumulative engagement insights, making it easier to spot trends over time.
In the table section, you can view the Top 5 Most Liked Videos and Top 5 Most Viewed Videos. This lets you quickly identify the content with the most interactions and engagements.
The template is available for free within the Rows tool. You can share it in the view mode or embed tables and charts into other tools that support iframes, such as Notion.
Key Metrics:
- Follower count
- Likes count
- Video views
- Weekly total metrics (likes, shares, views)
- Cumulative metrics (views, likes)
- Top liked and shared videos
Cost: Free to use
5. TikTok Ads overview report by Two Minute Reports
With this template from Two Minute Reports, you can easily track your spending and the number of clicks your ads receive.

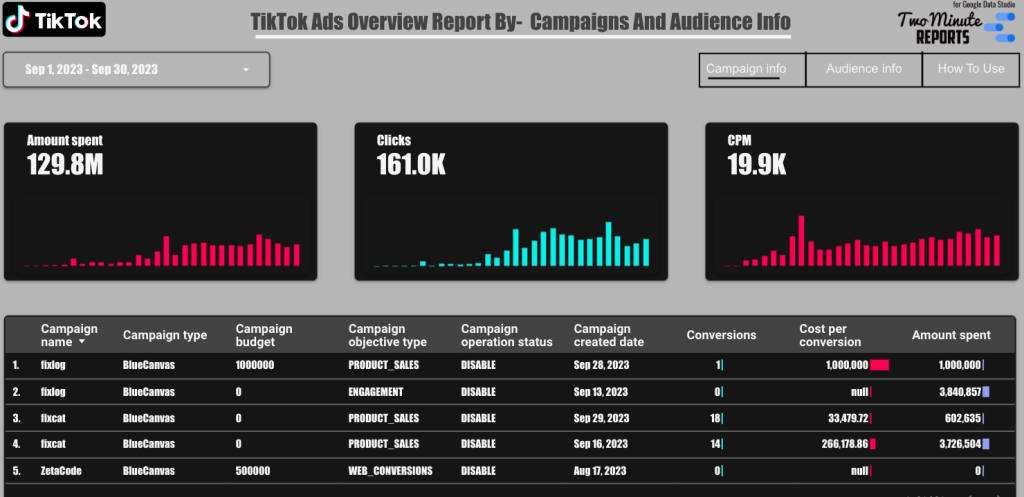
The dashboard breaks down your campaign performance by campaign budget, conversions, and cost per conversion. This enables you to quickly identify which campaigns are delivering the best results and where your ad spend is being used the most effectively.
In the Audience Info tab, you can see how your ads are performing across different genders, platforms (like Android or iPhone), and age groups. These insights can be used to tailor your ad strategy to better target specific groups, improving your ROI.
Key Metrics:
- Amount spent
- Clicks
- CPM (Cost per Mille)
- Campaign budget
- Conversions
- Cost per conversion
- Gender, platform, and age breakdown of impressions
Cost: Free to use
6. TikTok Ads dashboard by Rows
This TikTok Ads Dashboard displays the data you need to optimize your ad strategy, such as weekly performance summary, spending breakdown, and audience demographics.

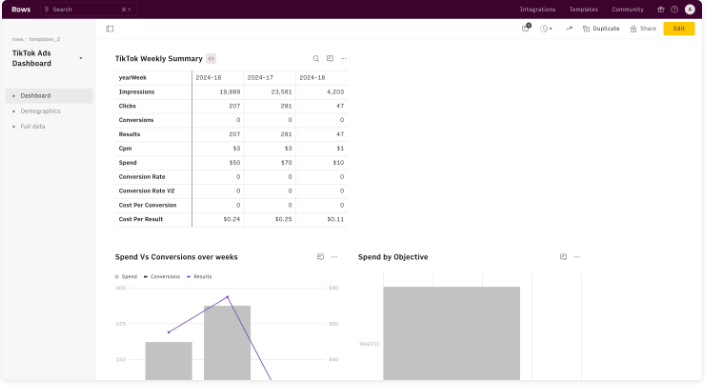
The template illustrates the relationship between your ad spend and conversion results. This makes it straightforward to spot trends and make informed decisions to maximize your ROI. The demographics section provides insights to enable you to tailor your campaigns based on your audience’s age, gender, and location.
Key Metrics:
- Impressions
- Ad spend
- Conversion rate
- Cost per conversion
- Clicks
- CTR (Click-Through Rate)
- Cost per Mille (CPM)
- Age
- Gender
- Country
Cost: Free to use
7. TikTok Ads performance overview by Two Minute Reports
This TikTok Ads Performance Overview provides an in-depth look at how your TikTok ad campaigns are performing.

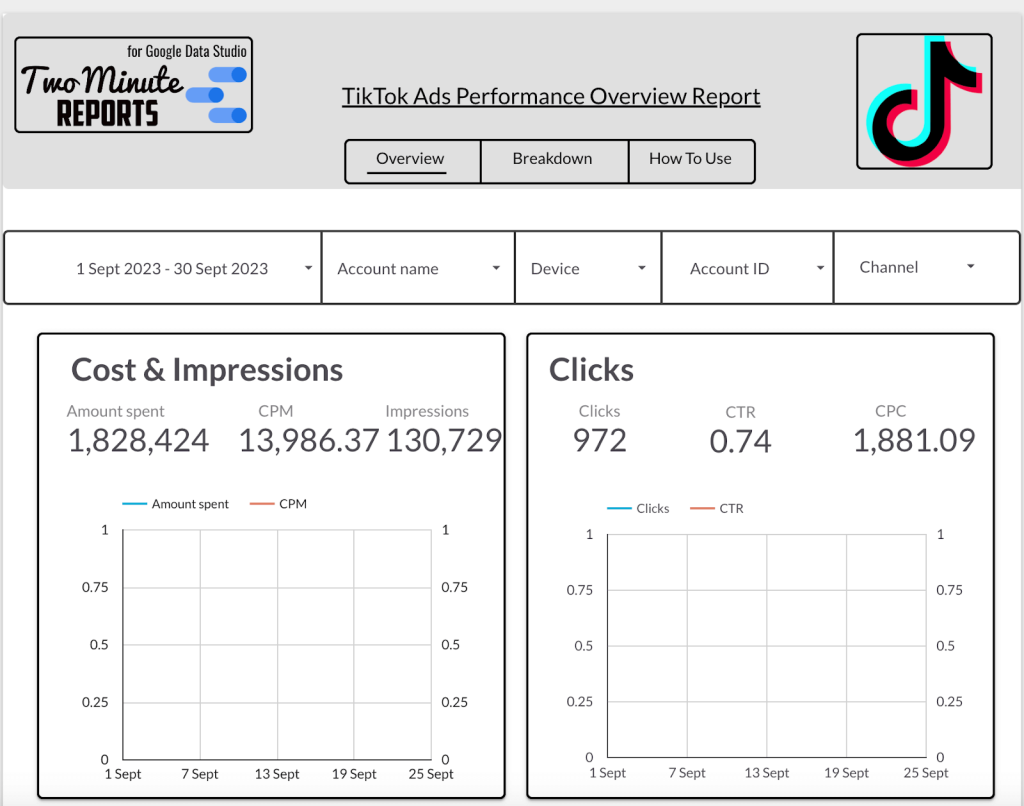
You can easily monitor key metrics such as your total ad spend, CPM, CTR, and cost per conversion. This helps you gauge how effective your ads are and where you can optimize your budget to get better results.
The report template shows demographics breakdown by age, gender, and platform, allowing you to tailor your campaign to your target audience. It also includes top-performing campaigns and a country breakdown to help you identify which countries are delivering the best results. This comprehensive view ensures you can make informed decisions to optimize your ad performance and maximize ROI.
Key Metrics:
- Amount spent
- CPM (Cost per Mille)
- Impressions
- CTR (Click-through rate)
- CPC (Cost per click)
- Conversions
- Results by country
- Top performing campaigns
Cost: Free to use
Bonus: 8. TikTok Ads budget-tracking dashboard with cross-channel connectivity by Coupler.io
This PPC budget-tracking dashboard provides a clear overview of advertising budgets across multiple PPC platforms, including TikTok Ads.

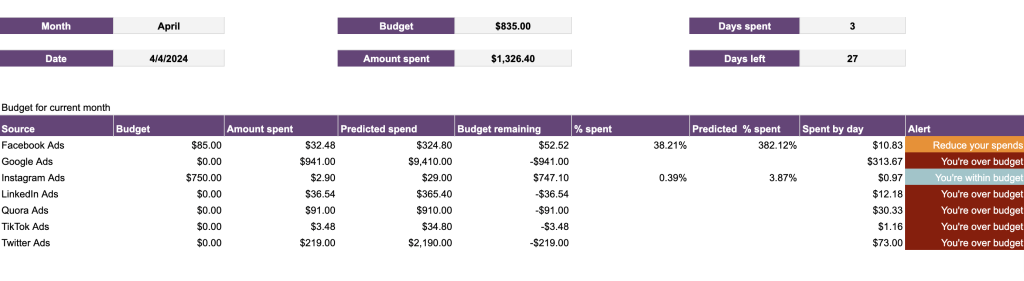
With this dashboard, you can easily track your spending trends over time. It monitors key metrics like total cost, amount spent, average monthly budget, and average monthly spend. You’ll also see how much of your budget remains and the percentage spent so far.
This template utilizes built-in custom formulas to predict future spending and alerts you when you’re nearing or exceeding your budget limit. This enables you to make timely adjustments to prevent overspending and improve your planning. Additionally, this dashboard supports up to eight different PPC platforms, allowing you to compare ad performance across channels like Google Ads, Facebook Ads, LinkedIn Ads, and TikTok. This makes it easier to identify the best-performing channels and allocate more budget where it’s the most efficient.
This template is simple to use – all you need to do is plug in your TikTok data source and set up an auto-refresh schedule. You can use it for TikTok alone or connect it to 7 other PPC channels.
Key Metrics:
- Amount spent
- Impressions
- Clicks
- CTR (Click-through rate)
- CPM (Cost per Mille)
- CPC (Cost per click)
- Budget
- Budget remaining
- Predicted spend
- Spend by day
- Percentage spent
Cost: Free to use
Key metrics to track with TikTok report templates
To get the most out of TikTok reporting templates, it’s important to focus on the key metrics that provide the most value. Below, we’ve highlighted essential metrics for both organic TikTok data and TikTok Ads, helping you track your performance.
Organic TikTok Metrics
| Metric | Description |
| Views | Tracks the number of times your video was viewed. |
| Likes | Measures how many people liked your video, indicating positive audience response. |
| Shares | Tracks how often your video is shared, showing its potential to reach a wider audience. |
| Comments | Shows the number of comments your video has received, reflecting interaction levels. |
| Follower Growth | Measures the growth in followers over time, indicating the appeal of your content. |
| Engagement Rate | Calculates the overall engagement (likes, shares, comments) as a percentage of total views. |
| Video Completion | Tracks the percentage of viewers who watch your video to the end. |
| Demographics (age, gender, country) | Provides insights into the age, gender, and location of your viewers. |
TikTok Ads Metrics
| Metric | Description |
| Amount Spent | Tracks how much you have spent on ads. |
| Impressions | Counts the number of times your ad appeared on users’ screens. |
| Clicks | Tracks the number of clicks your ad receives. |
| CTR (Click-through Rate) | Measures the percentage of people who clicked your ad after viewing it. |
| CPM (Cost per Mille) | Calculates the cost of 1,000 ad impressions. |
| CPC (Cost per Click) | Tracks how much you pay for each click on your ad. |
| Conversions | Indicates how many users completed a desired action after clicking your ad. |
How to build a dashboard using TikTok Ads report templates
Setting up your dashboard with the Coupler.io TikTok Ads template only takes a few minutes. All you have to do is:
- Open the selected template – for example, TikTok Ads dashboard, and navigate to the “Readme” tab for details.
- Follow the instructions to install and authorize the Coupler.io connector for Looker Studio.
- Once this is done, link your TikTok account for each of the data types used in the report. This step allows data to flow into your dashboard automatically on a schedule.

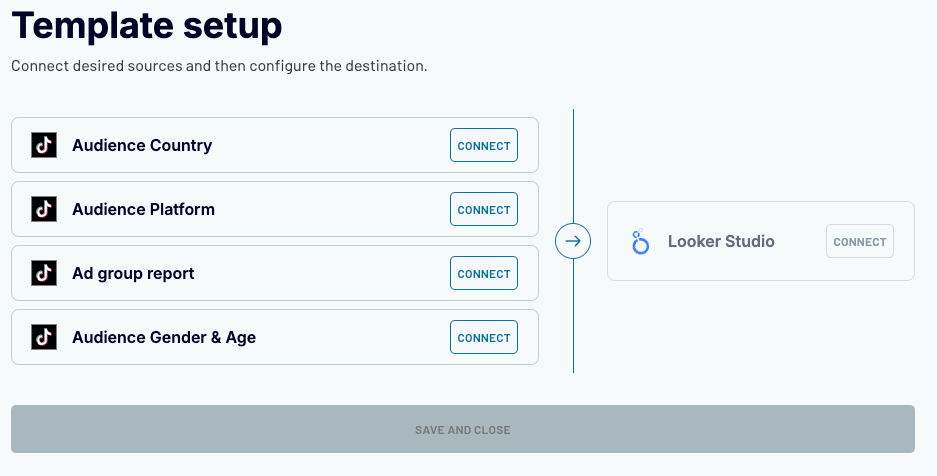
- The transformation step is pre-configured, so no changes are needed there.
- After that, follow the on-screen instructions to link the template to Looker Studio.
Once connected, you’ll have a copy of the dashboard populated with your data. If needed, you can return to Coupler.io to adjust your schedule preferences for data updates.
Building a TikTok Ads report template from scratch
If the default TikTok Ads report templates don’t meet your specific needs, you can create your own. While it requires more effort than using a pre-made template, it enables you to track the exact metrics that are most important to you.
With Coupler.io, you can automatically import your TikTok Ads or TikTok Organic data into your favorite BI tool or spreadsheet app to create custom reports that refresh data on a schedule.
Below is the 3-step process on how to create your custom TikTok Ads dashboard with Coupler.io:
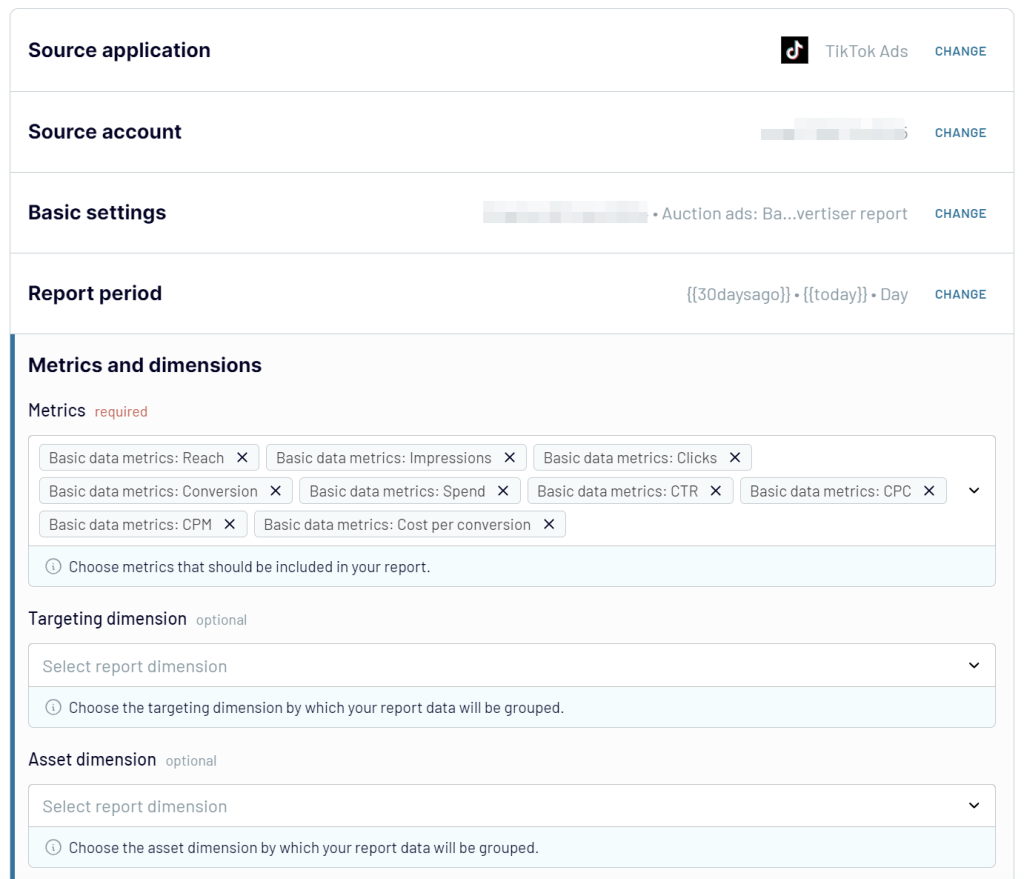
Step 1: Extract TikTok data
First, select your destination app, such as Google Sheets or Looker Studio, and click Proceed. If you need TikTok Organics data, you can change the source.

Sign up for Coupler.io for free, no card details are required.
Once logged in, connect your TikTok account. You’ll be able to choose the report type, such as Campaign or Conversion data, and specify the date range for your report.
Also, select the metrics and dimensions you need, such as ad spend, impressions, clicks, or conversions.
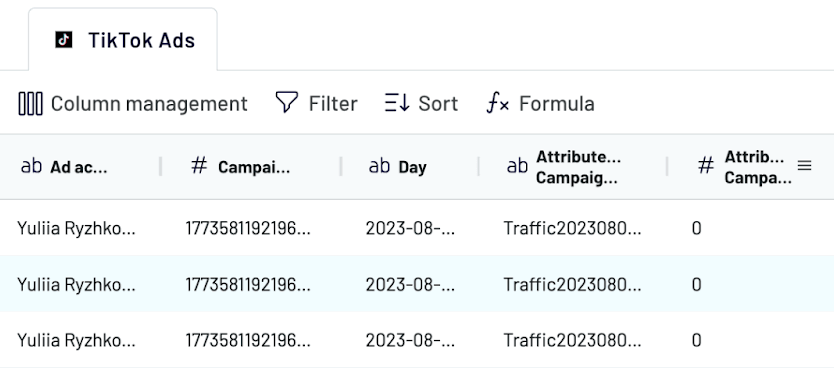
Step 2: Organize and preview data
After setting up your data import, you can preview the dataset before loading it into the destination app. Coupler.io allows you to:
- Filter your data to focus on specific campaigns or time periods.
- Rearrange columns to prioritize key metrics.
- Combine data from multiple TikTok Ads accounts or other sources.
- Add custom calculations if needed, such as cost per conversion or click-through rates.

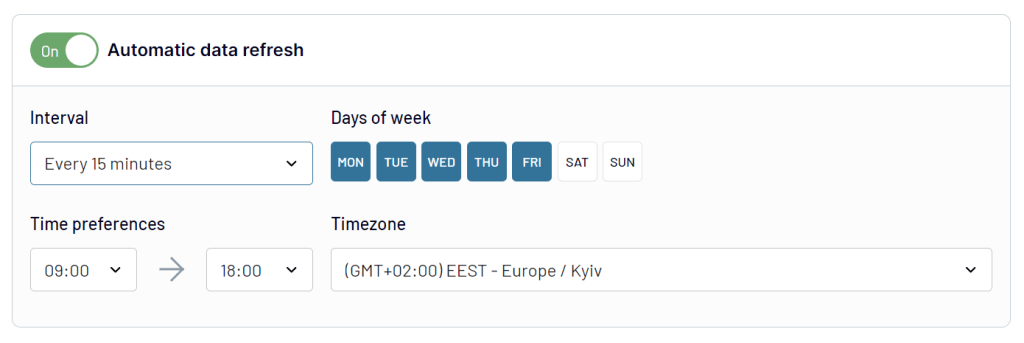
Step 3: Load data and schedule updates
Once your data is ready, follow the on-screen instructions to load it into your chosen app. You can customize your TikTok Ads dashboard by adding graphs, charts, and filters to track performance in near real time.
Coupler.io also allows you to schedule automatic data refreshes, ensuring your dashboard stays updated with the latest metrics without any manual effort.

By following these steps, you can build a TikTok Ads dashboard that’s tailored to your unique needs, helping you stay on top of your campaign performance and make data-driven decisions.
Track performance with ready-to-use TikTok reporting templates
For both companies and content creators, improving the results of your social media marketing efforts is extremely difficult without closely tracking performance metrics. With TikTok report templates, you can gain insights to:
- Identify the best types of content
- Optimize posting times
- Understand audience demographics
- Monitor ad performance
- Evaluate collaborations and partnerships
Coupler.io offers multiple free TikTok reporting dashboards to help you maximize the value of your data. It automates the process of collecting your data and loading it into a dashboard on a schedule. This allows you to then easily analyze your performance and track key metrics to improve your strategy.
Automate reporting with Coupler.io
Get started for free