Staying on top of your Xero data and reports allows you to monitor financial health, identify revenue trends, track expenses, and make informed business decisions. Let’s explore the different ways to connect your data with a BI platform for better analysis.
Methods to connect Xero to Looker Studio
- Partner connector by Coupler.io
Coupler.io is a reporting automation and analytics platform that allows you to create insightful reports from your business apps. You can use Coupler.io to pull data from over 60 sources to BI tools (Looker Studio, Power BI, etc), spreadsheets (Google Sheets and Microsoft Excel), and data warehouses (BigQuery, PostgreSQL, etc). The partner connector can automate Xero to Looker Studio connection and keep your reports refreshed.
- Manual export
The native export functionality in Xero allows you to download data in Excel or load it to Google Sheets. First, locate the data category you’re looking for and then export the data using the available file format. Next, you can proceed to Looker Studio, create a source, and import data.
- Xero API and scripting
If you’re familiar with coding or scripting, you can query the Xero API and retrieve the desired datasets from your account. The process is lengthy as you’ll have to prepare the API, get an access token, and use a script(s) in Google Apps Script.
Note that Looker Studio doesn’t support direct API connections. So, you need to send data to an intermediary app such as Google Sheets or any of the native connectors available.
How to automate Xero to Looker Studio with Coupler.io
Coupler.io offers two Xero source apps to export from – Xero and Xero Reports. Xero contains the raw transactions and displays the individual records for each entry.
To connect Xero to Looker Studio, click Proceed in the preconfigured form below.
If you’re a new user, you’ll be asked to create a Coupler account (no credit card required). Otherwise, you can log in and continue with the following steps:
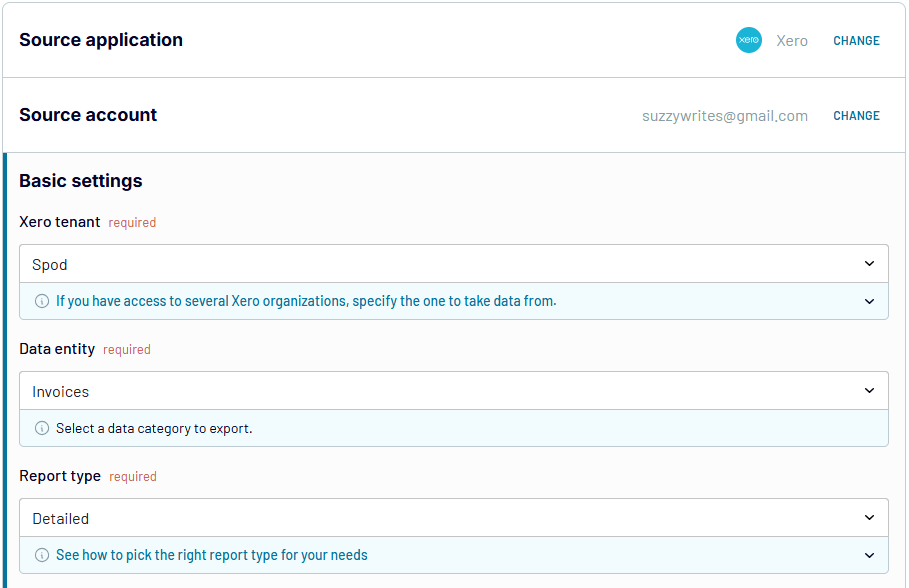
Step 1. Collect Xero data
Allow access to your Xero account, and choose the tenant and the data entity to export.
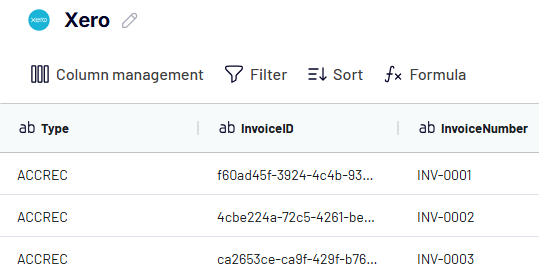
Step 2. Preview and transform
Verify your data and make any necessary changes. You can:
- Hide and edit certain columns
- Sort and filter data
- Use formulas to add new columns
Coupler.io also lets you merge data from multiple Xero accounts or combine it with related information from other business apps.
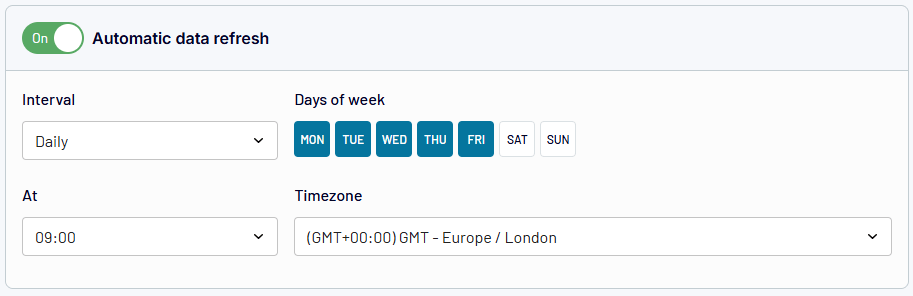
Step 3. Load and schedule
Follow the instructions to load data to Looker Studio. You’ll need to authorize the connector, after which Coupler.io will create a new data source in Looker Studio. A preview will be shown, and you can Explore or Create a report.
Return to the Coupler.io importer and Set Up a schedule. Turn on automatic data refresh and pick the interval, days of the week, and the timezone.
Coupler.io will enable the finance function automation and refresh data from your Xero account based on the set schedule. However, remember that Looker Studio only checks for fresh data every 12 hours.
Hit Save and Run to send data from Xero to Looker Studio. With the successful import, you’ll be able to create your financial report in Looker Studio.
What data can you export from Xero?
Here are the data types you can export from Xero using Coupler.io:
| Data entity | Description |
|---|---|
| Accounts | The complete chart of accounts, including assets, income, equity, liabilities, and expenses |
| Bank Transactions | All transactions involving credits, debits, and transfers in bank accounts |
| Bank transfers | Details of transfers between your bank accounts |
| Branding themes | Customized designs for your documents and emails |
| Contact groups | Groups for categorizing customers, suppliers, and other contacts |
| Contacts | Contacts and details of customers, suppliers, and other people involved |
| Credit Notes | Documents issued to reduce the outstanding amounts that customers owe |
| Currencies | The currencies used in transactions |
| Employees | Information about employees |
| Expense Claims | Employee expenses and details of each claim |
| Invoices | All invoices sent to customers |
| Items | List of products and services offered |
| Journals | Summaries of all accounting transactions |
| Linked Transactions | Related transactions, such as bills and orders |
| Manual Journals | Journal entries that are manually created |
| Organisation | Company profile and details |
| Payments | All payments made and received |
| Prepayments | Payments before goods and services have been delivered |
| Purchase orders | Orders placed for any purchases |
| Receipts | Money received from customers |
| Repeating invoices | Automated invoices that are sent to customers regularly |
| Tax rates | Tax rates applied to different transactions |
| Tracking categories | Categories for tracking financial performance |
| Users | All users with access to the Xero account and their roles or permissions |
Can you automate exports of Xero Reports to Looker Studio with Coupler.io?
Xero Reports are report templates consisting of grouped accounting data, e.g. monthly totals or account-level summaries. Coupler.io allows you to export these insights as a separate data source.
To connect Xero Reports to Looker Studio, click Proceed in the preset importer below:
Then, you’ll need to authorize your Xero account, select the report to export, preview, and load it to the chosen destination. The setup flow is pretty much similar to what we’ve described in the previous section.
Here are the report types you can choose:
| Report type | Description |
| Aged Payables by Contact | Unpaid bills by supplier and how long they’ve been outstanding |
| Aged Receivables by Contact | Overdue customer invoices and the duration of each |
| Balance Sheet | A snapshot of your financial position, including assets, liabilities, and equity at a particular point in time |
| Bank Statement | Matched records of your bank transactions and Xero entries |
| Bank Summary | An overview of bank balances and transactions during a time period |
| Budget Summary | Budgets in your Xero account |
| Executive Summary | Summary of key metrics, e.g. income, expenses, balance, profit, cash flow, etc. |
| Profit and Loss | A detailed report of income, expenses, and profit |
| Trial Balance | Summary of account balances to match the total debits with the total credits |
Is it easier to analyze raw data or grouped data?
Let’s explore the differences between Xero and Xero Reports for analysis in a BI tool.
- Xero Reports provide already summarized information (monthly sales, unpaid invoices, etc). You can interpret it, analyze the metrics, and add it to an overview report or dashboard
| Pro | Con |
|---|---|
| It allows you to make faster analyses and offers immediate insights, often at first glance. | You can’t access each individual entry and identify day-to-day trends in transactions |
- Xero shows every transaction made in your account. You can customize, dive into deeper insights, and group in many ways (weekly, customer segment, etc.)
| Pro | Con |
|---|---|
| It allows you to make an in-depth analysis and much more comprehensive reporting. | You have to clean, filter, and transform the raw accounting data before analyzing. |
Both raw and aggregated data from Xero are useful for your reports. It just depends on the time available and the kind of reporting you want to do. You may also combine them.
Ready to use dashboard templates for Xero reporting
After data integration, the visualization of financial data is essential. This requires knowing the right metrics to track and the most suitable visuals to add to the report. You can eliminate the need to create reports from scratch by using report templates. Below are some Looker Studio dashboards to consider:
Financial dashboard for Xero
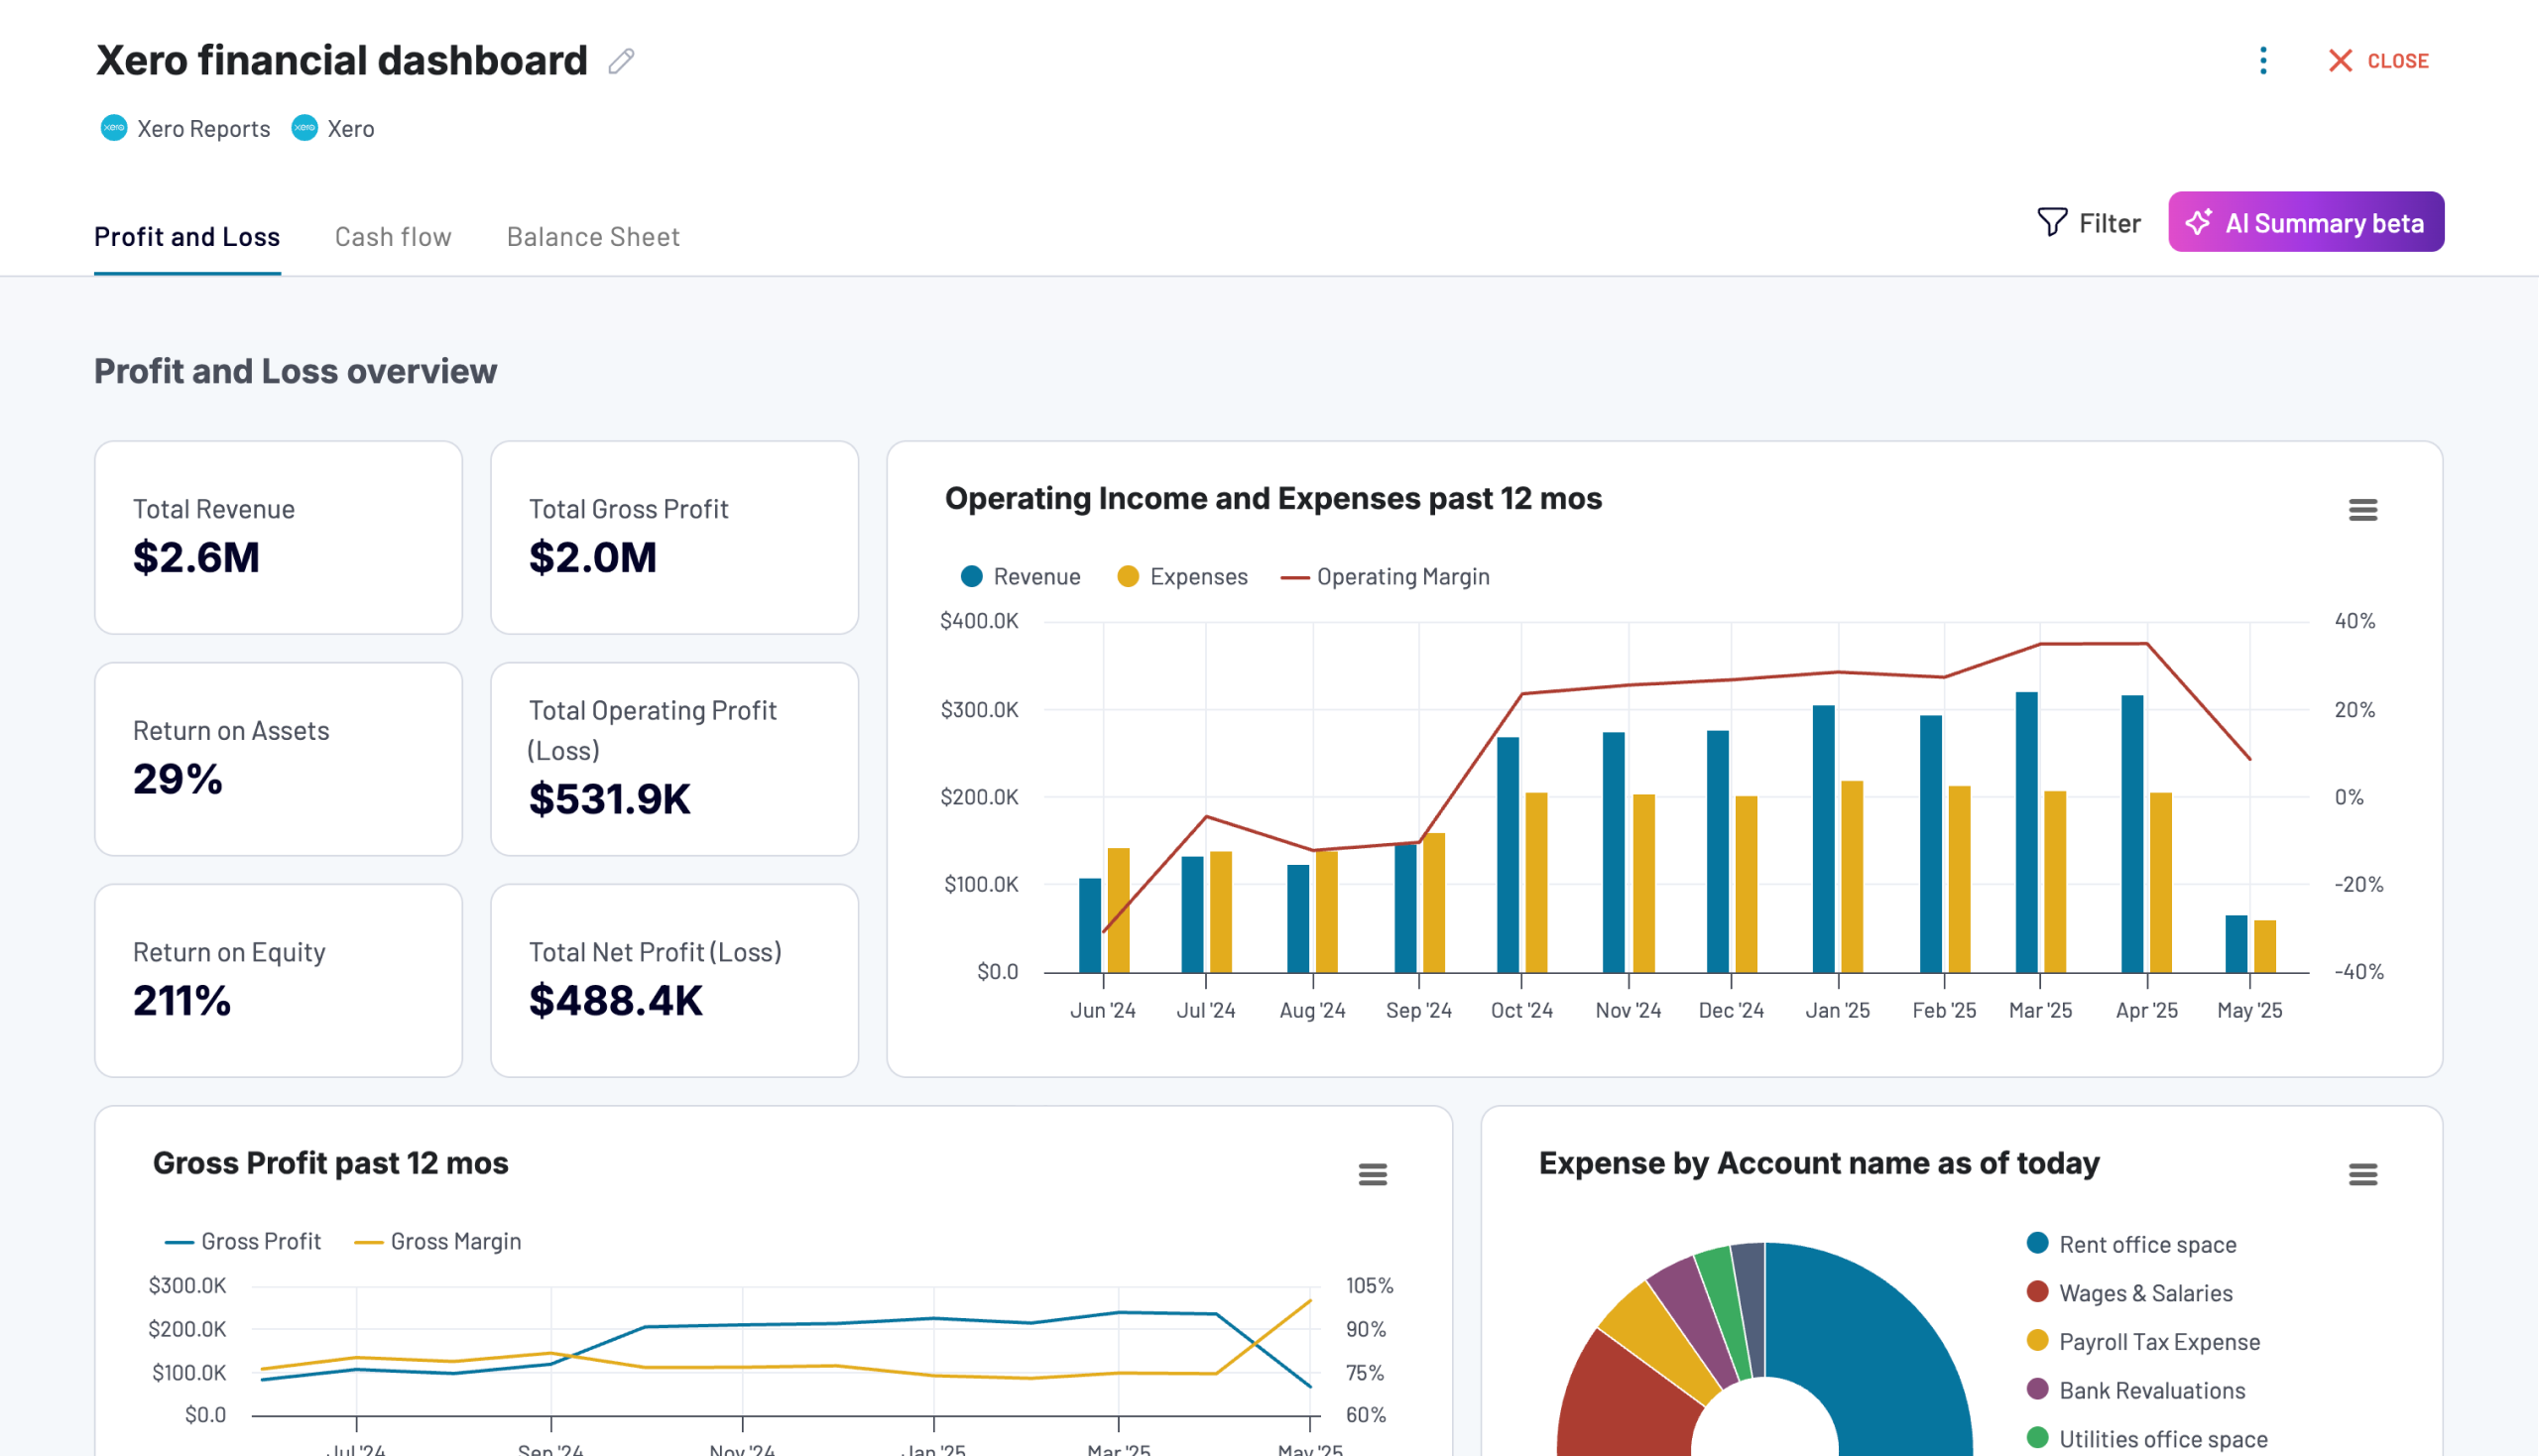
This Xero financial dashboard provides a real-time view of your company’s financial health. It tracks earnings, cash flow, and balance sheet changes in one place. You’ll get a quick view of the overall financial performance without going through multiple spreadsheets. The intuitive visualizations help you to quickly assess profitability, manage liquidity, and make informed financial decisions.
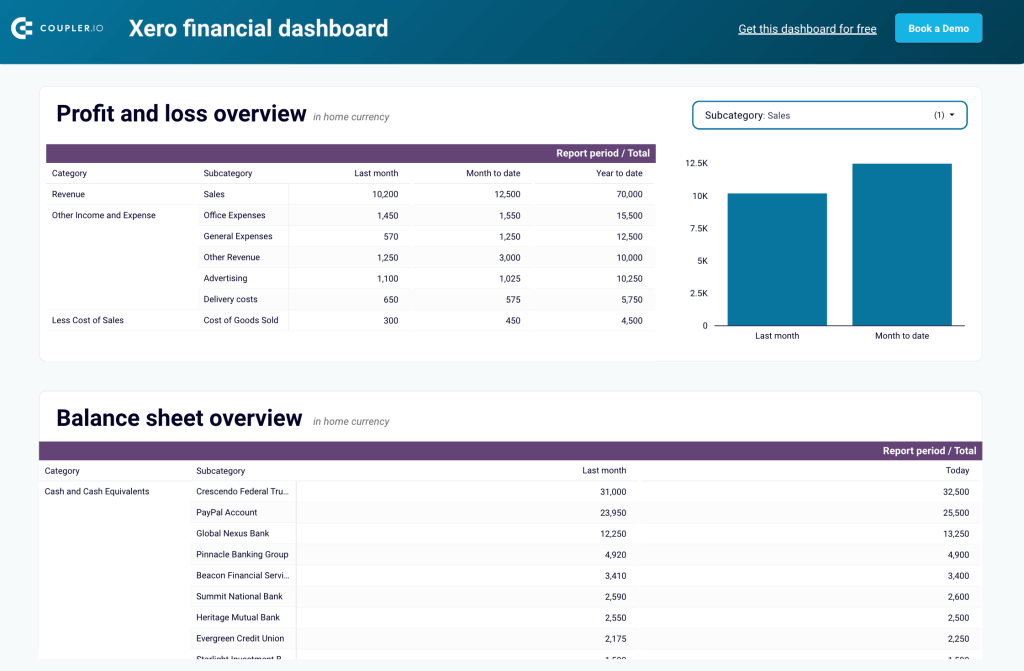
Here are the insights to expect:
- Revenue, expenses, and net profit for last month, month-to-date, and year-to-date
- Trend analysis of income and cost structure
- Assets, liabilities, and equity overview to assess financial stability
- Net cash flow changes and liquidity tracking
- Visual comparisons of profit, balance sheet, and cash position over time
To see your data in this dashboard, connect your Xero account to this Looker Studio dashboard by following the instructions in the Readme tab. The Coupler.io Looker Studio connector will ensure your dashboard stays updated automatically. The dashboard is also available in Coupler.io (with AI insights) and Google Sheets.
Xero financial dashboard
Get comprehensive financial insights from your Xero account with key performance metrics, balance sheet analysis, and cash flow projections. Quickly assess your business health and make informed financial decisions.


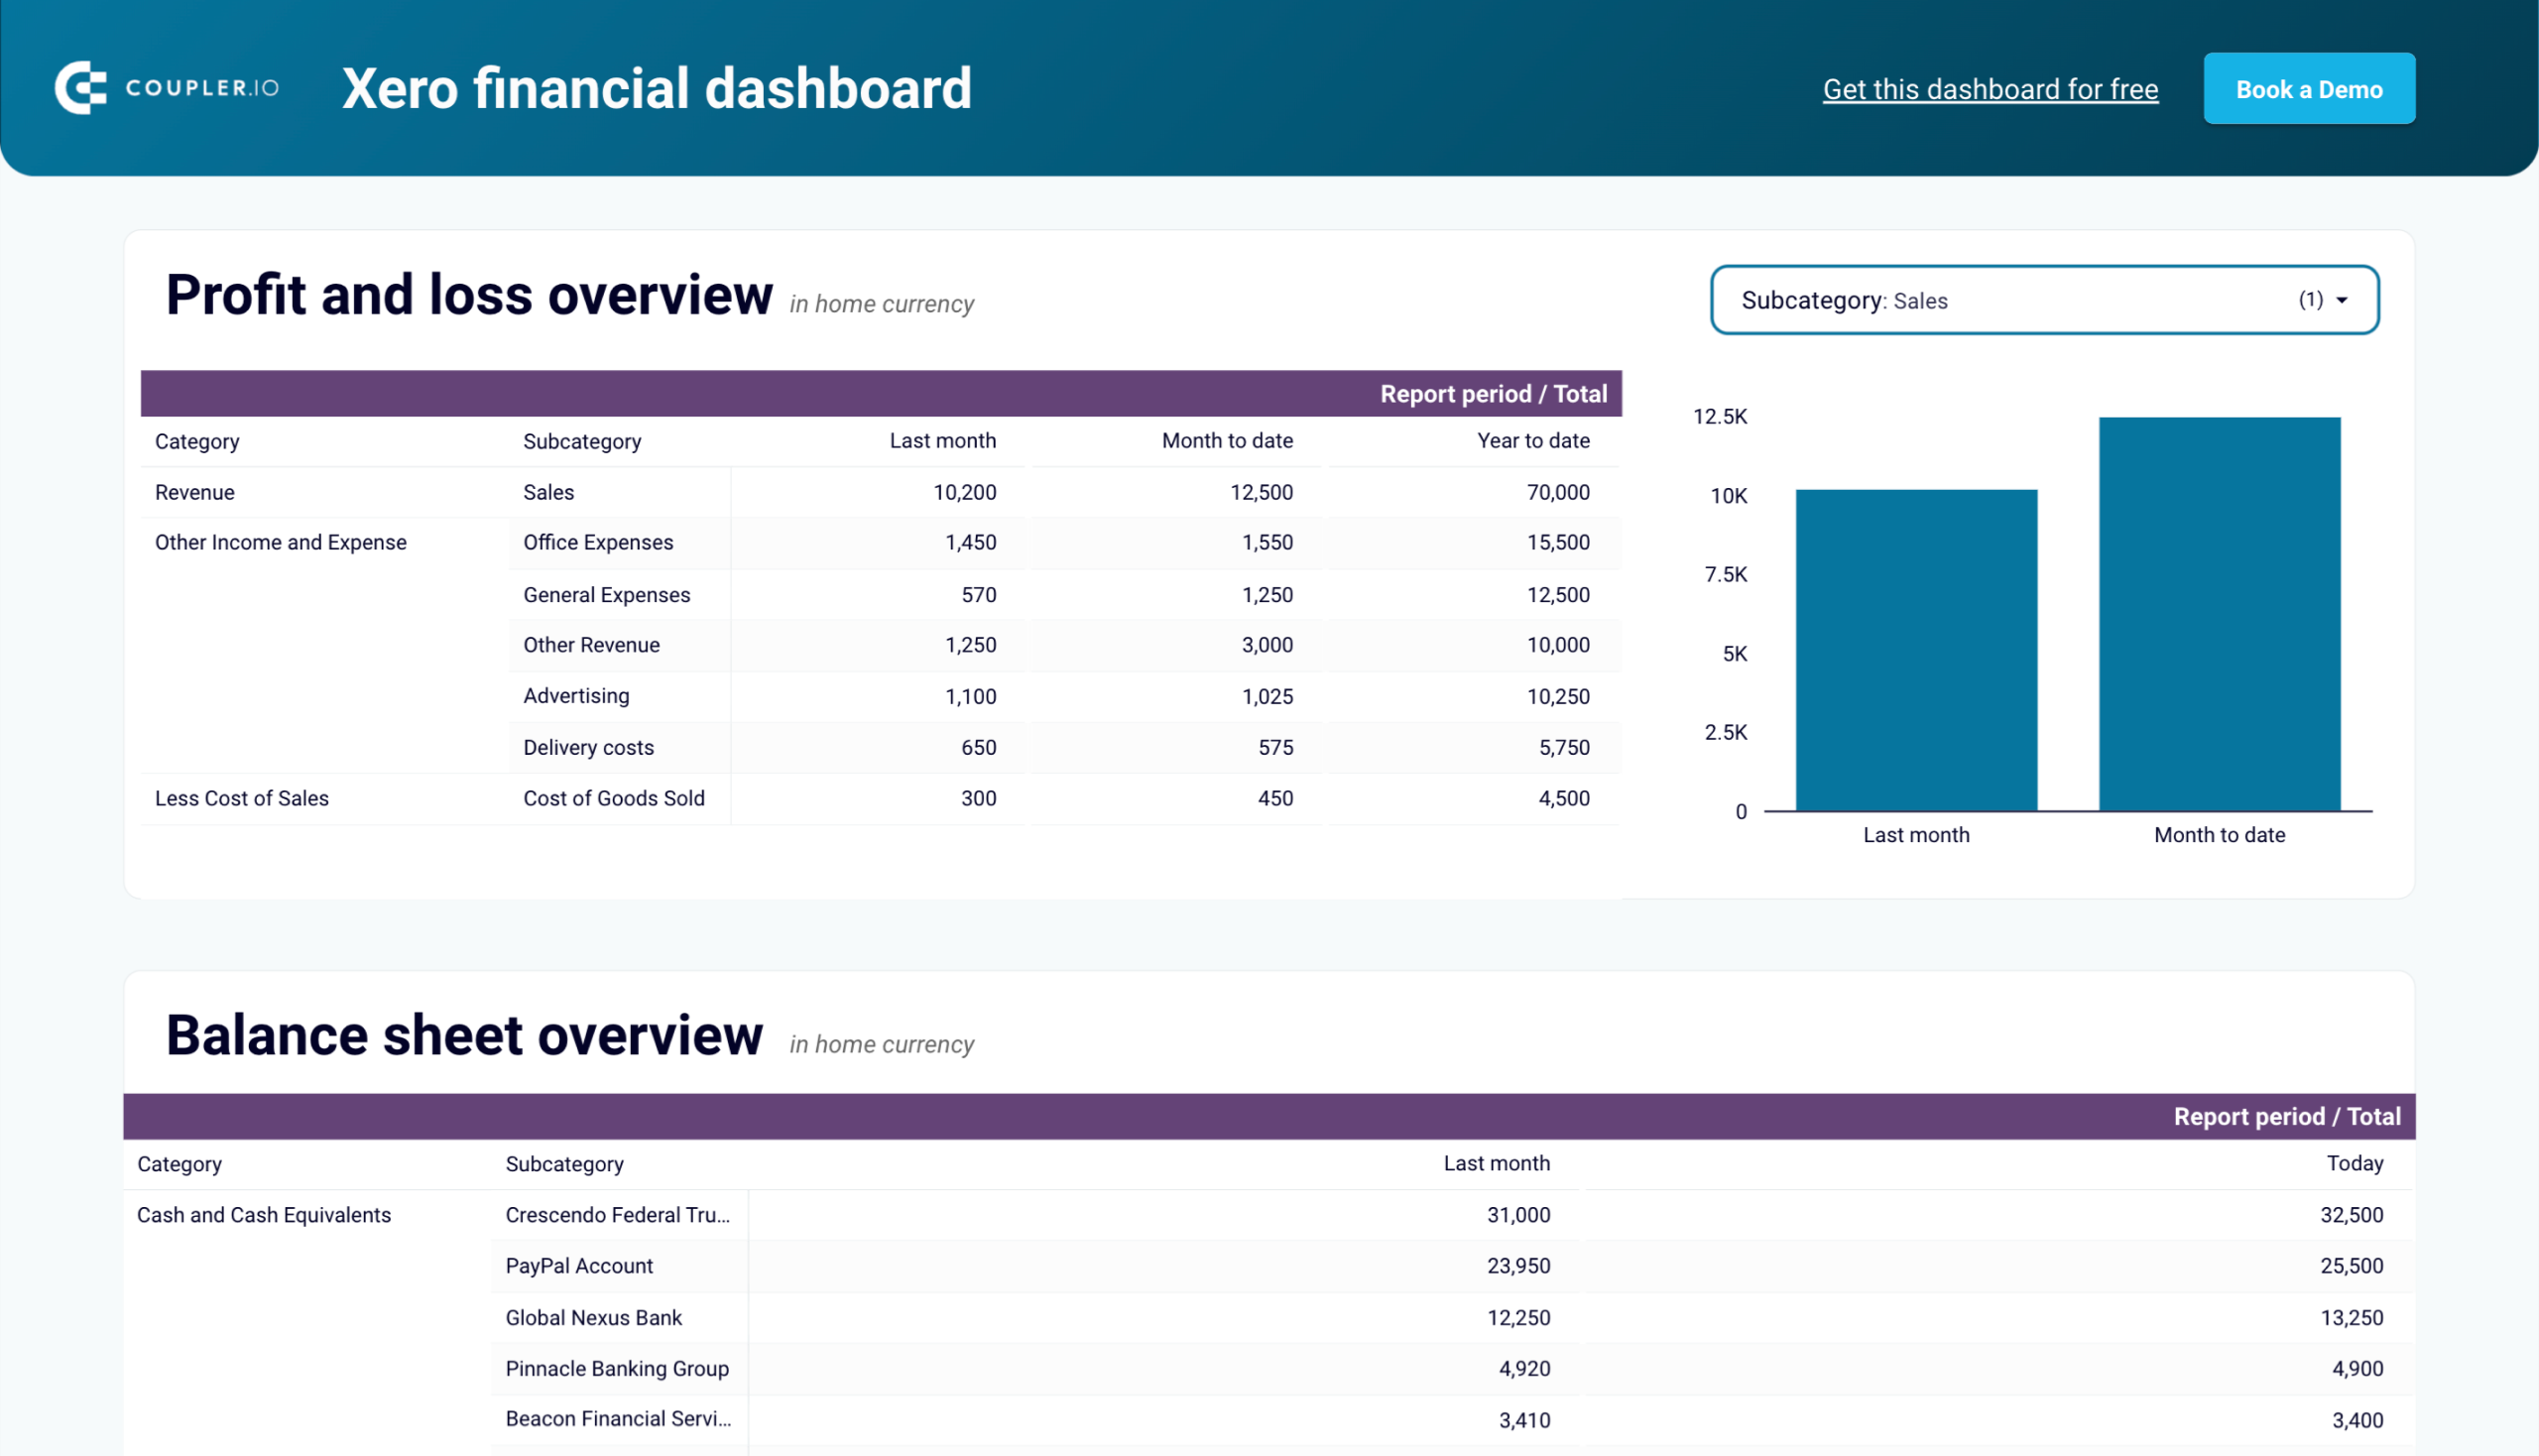
Xero financial dashboard in Looker Studio
Analyze your financial performance with a unified dashboard featuring key reports from Xero like cash flow, profit and loss, balance sheet, and others.

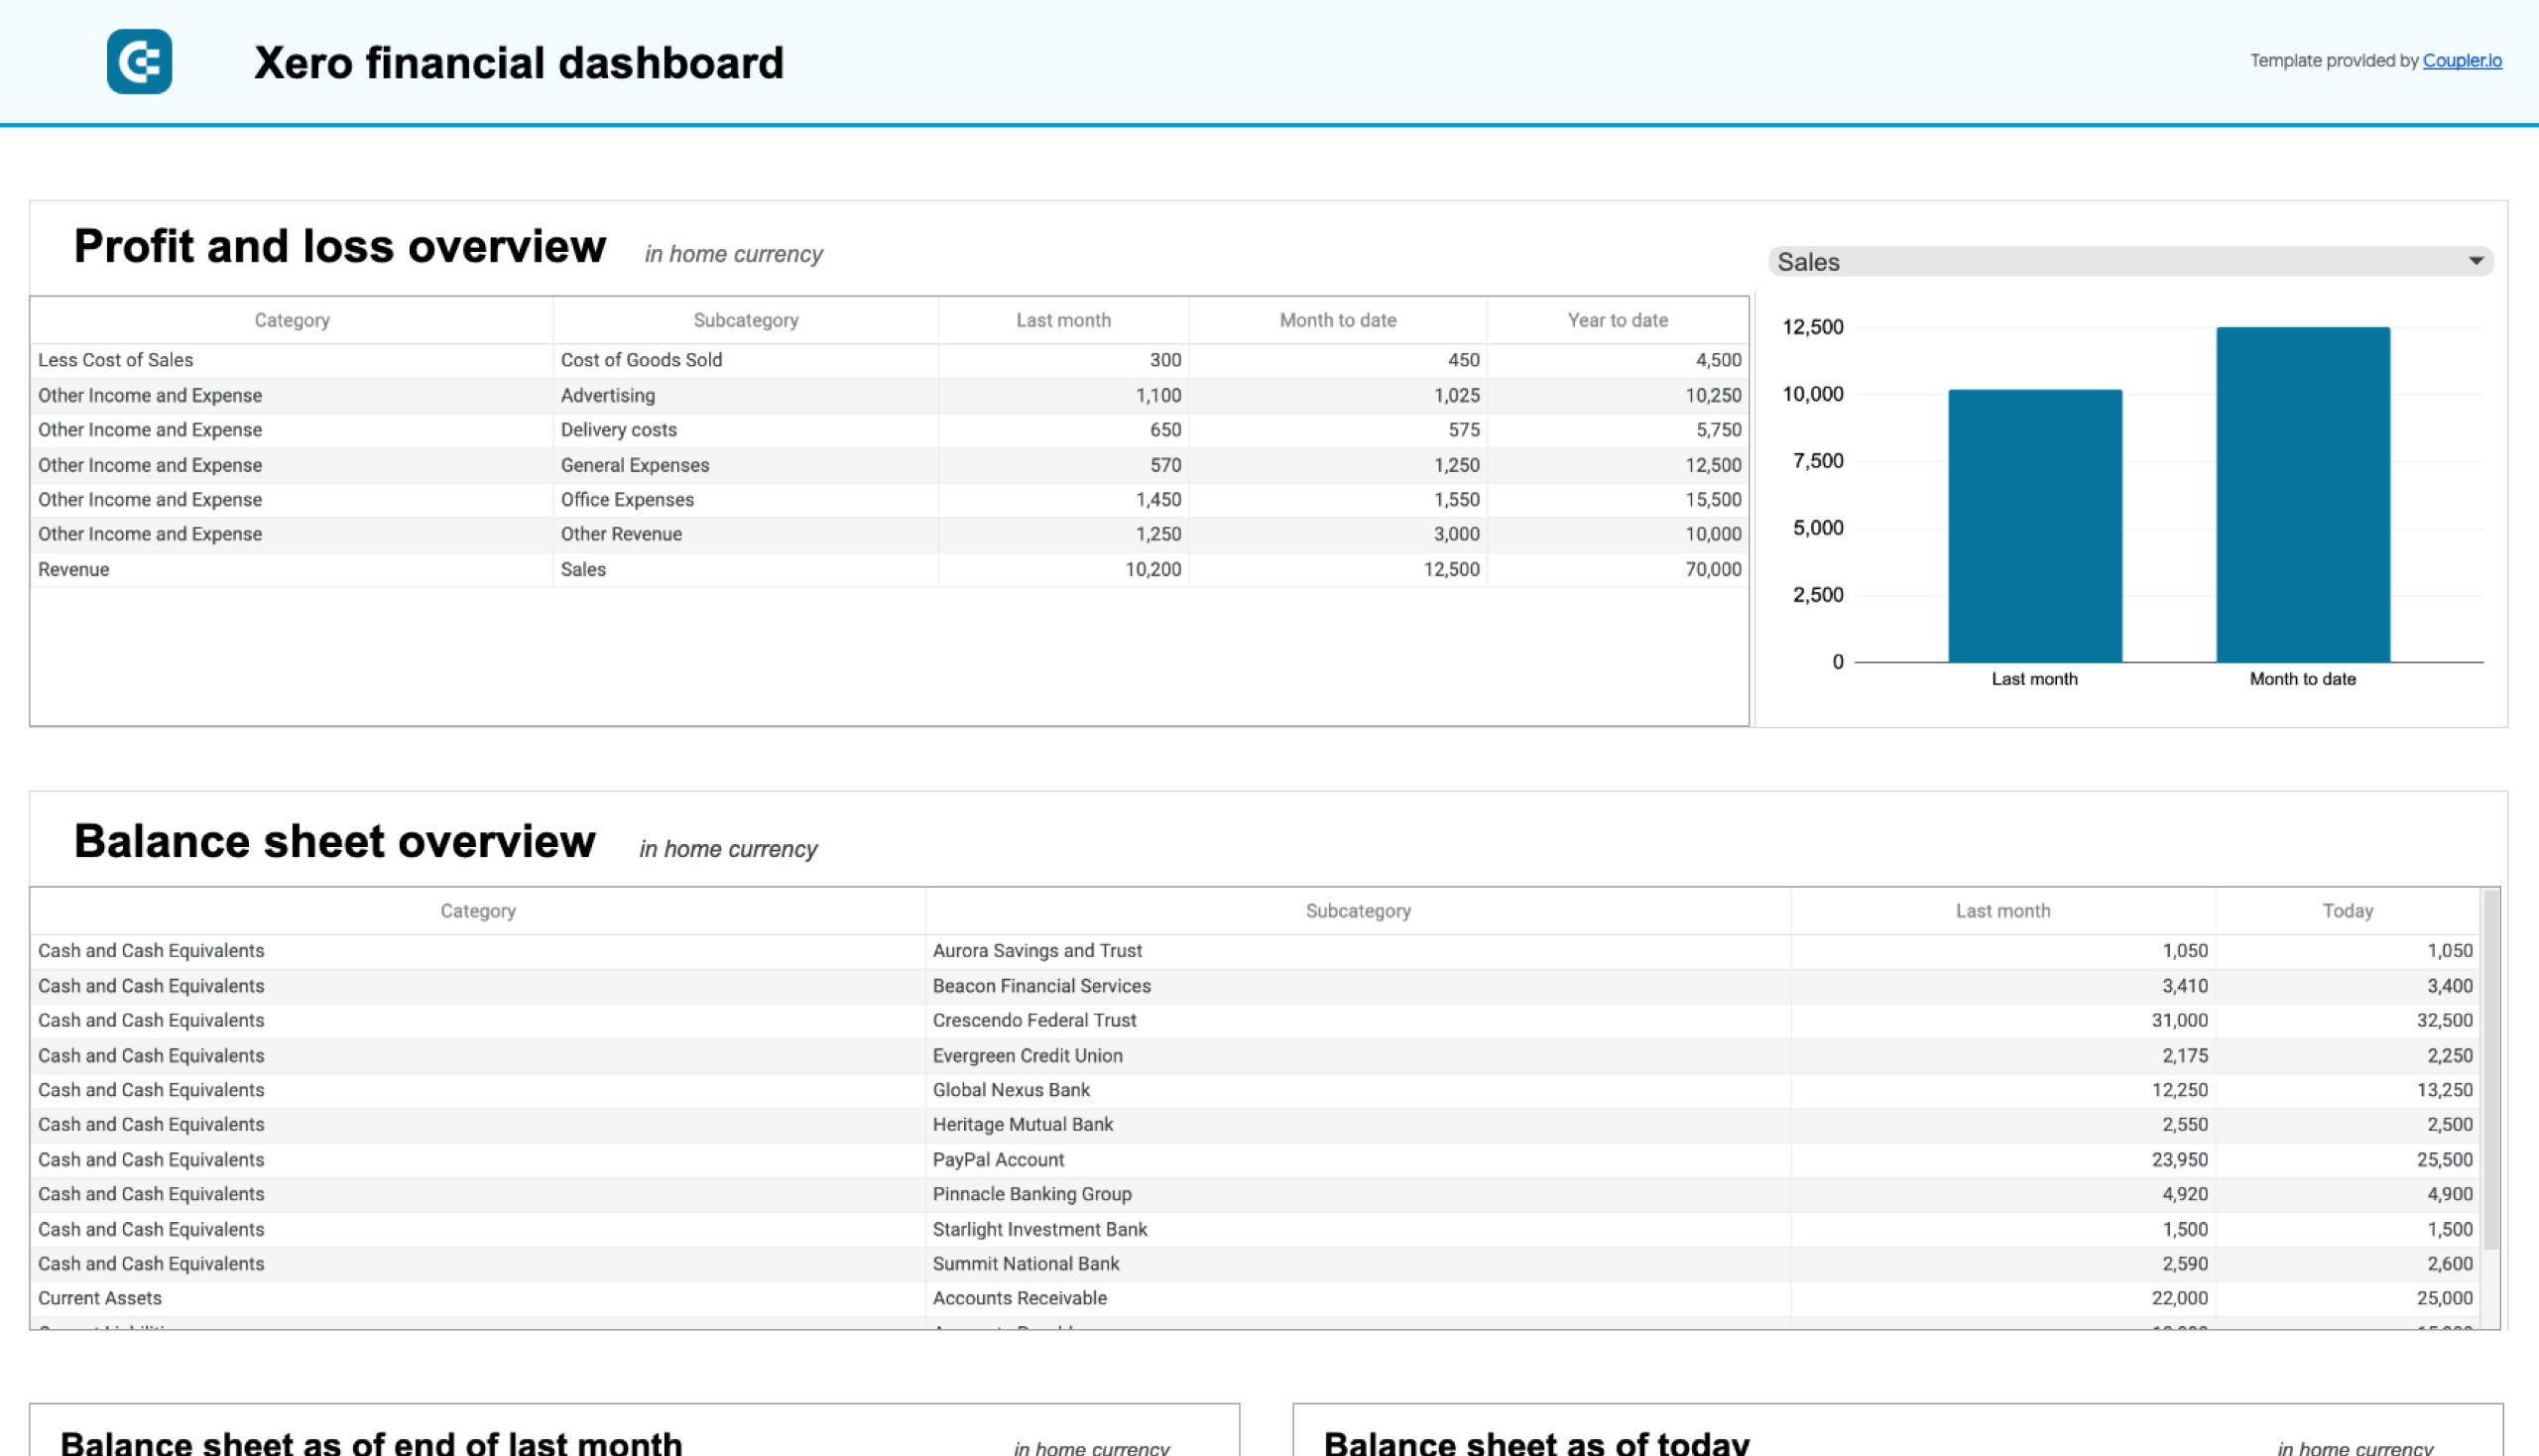
Xero financial dashboard in Google Sheets
Get instant visibility into your company’s financial health through key performance reports from Xero such as cash flow, income statement, and balance sheet.

Revenue dashboard for Xero
This dashboard offers a comprehensive view of your business income and expenses to monitor financial performance over time. You can track overall revenue trends, spot seasonal fluctuations, and identify high and low-income periods. It also highlights top customers and products by revenue, making it easy to recognize key income drivers. The Profit and Loss dashboard section provides insights into net income by comparing revenue and costs, aiding better budgeting and financial planning.
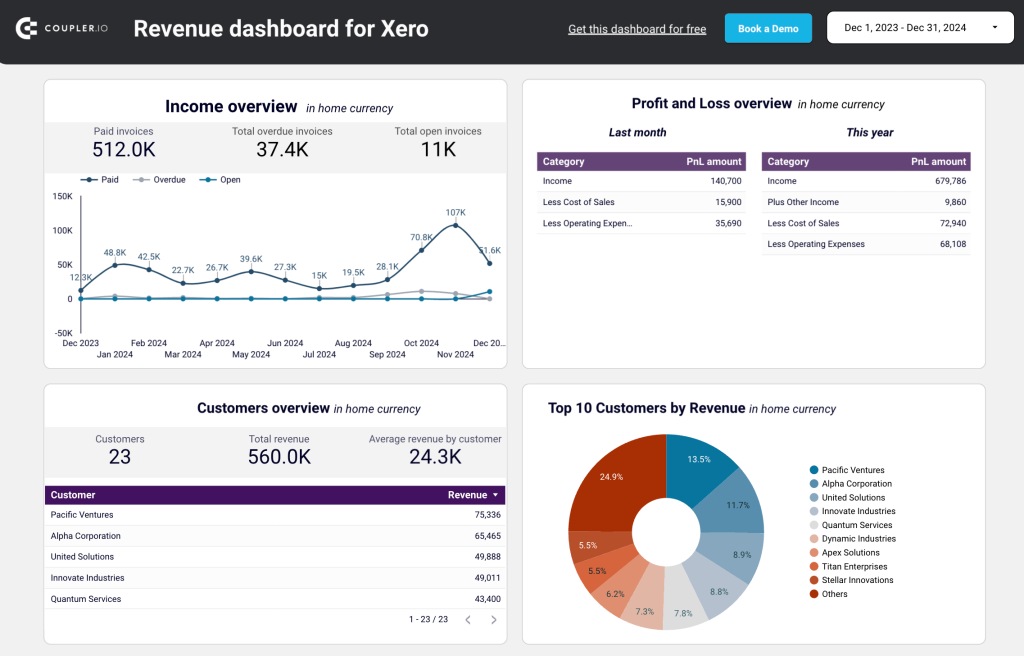
Here are the insights to expect:
- Total revenue and trends over the past 12 months
- Top 10 customers by revenue
- Top 10 products by revenue
- Profit and Loss breakdown (income, cost of sales, and operating expenses)
- Customer revenue overview
- Product revenue overview
To see your data in this dashboard, connect your Xero account to this Looker Studio dashboard by following the instructions in the Readme tab. Check out also other versions of this dashboard.
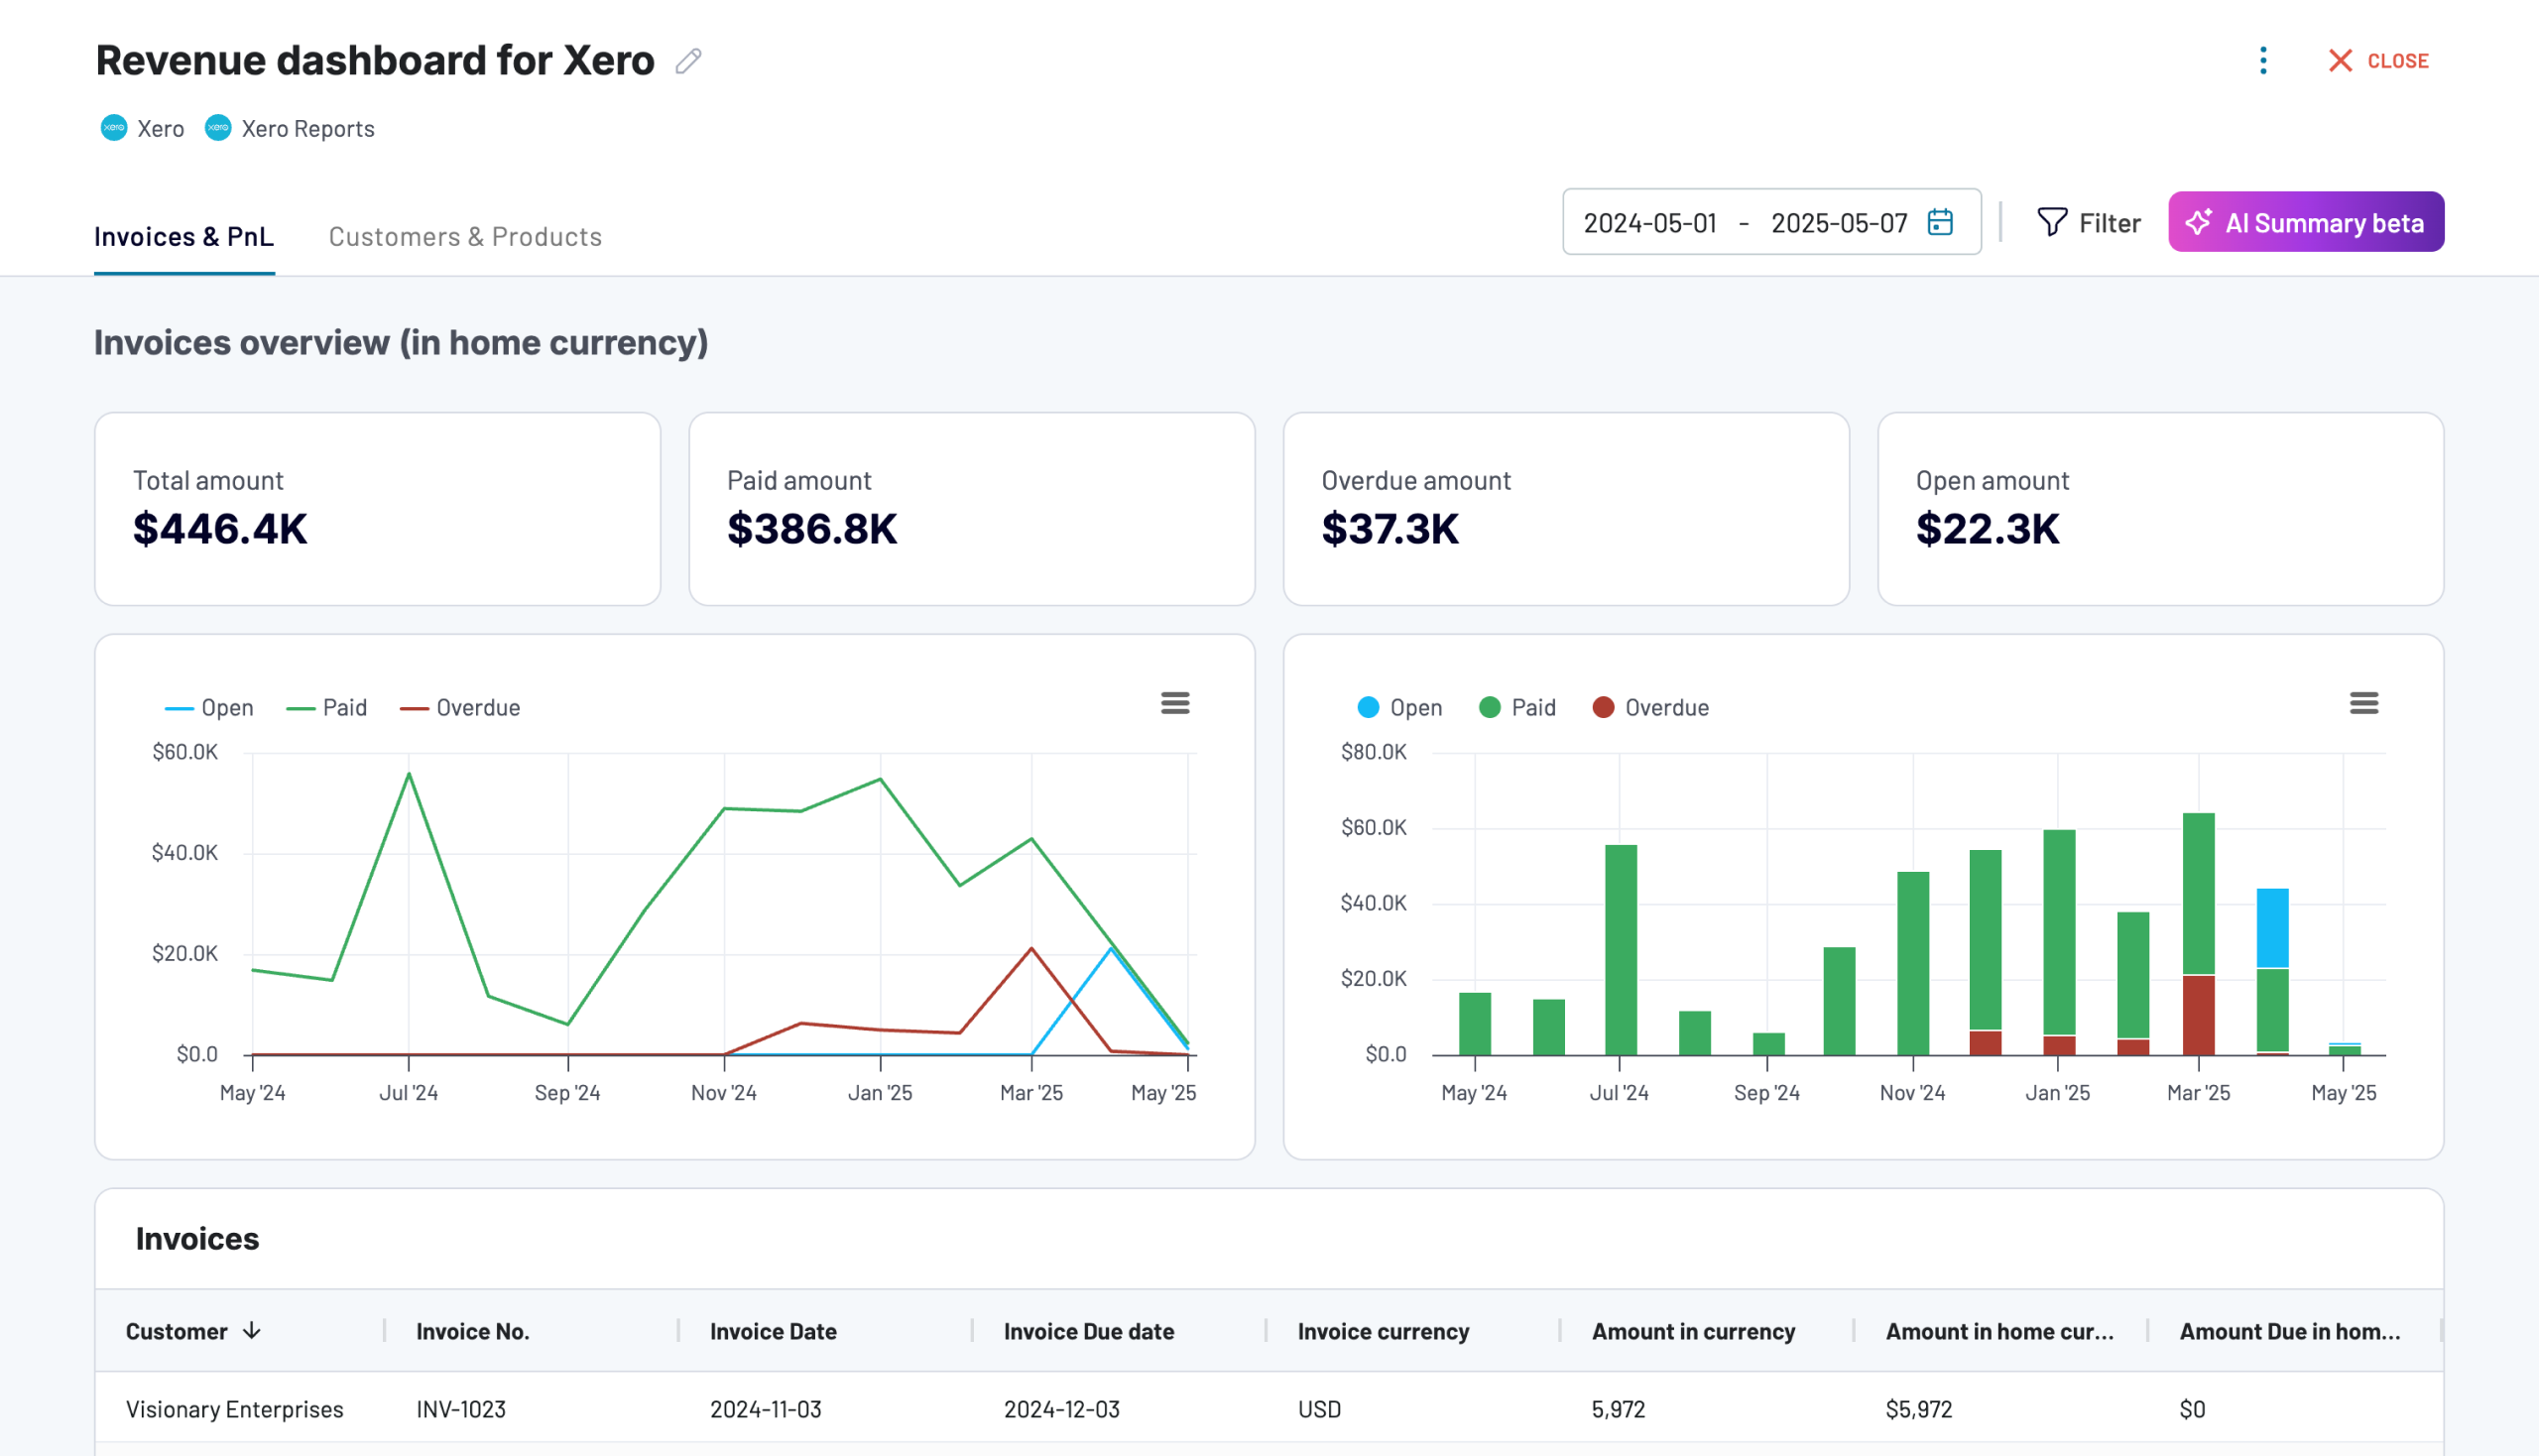
Revenue dashboard for Xero
Analyze revenue streams, customer spending patterns, and product performance with data automatically synced from Xero. Gain actionable insights into sales trends, top-performing products, and high-value customers to drive growth strategies.
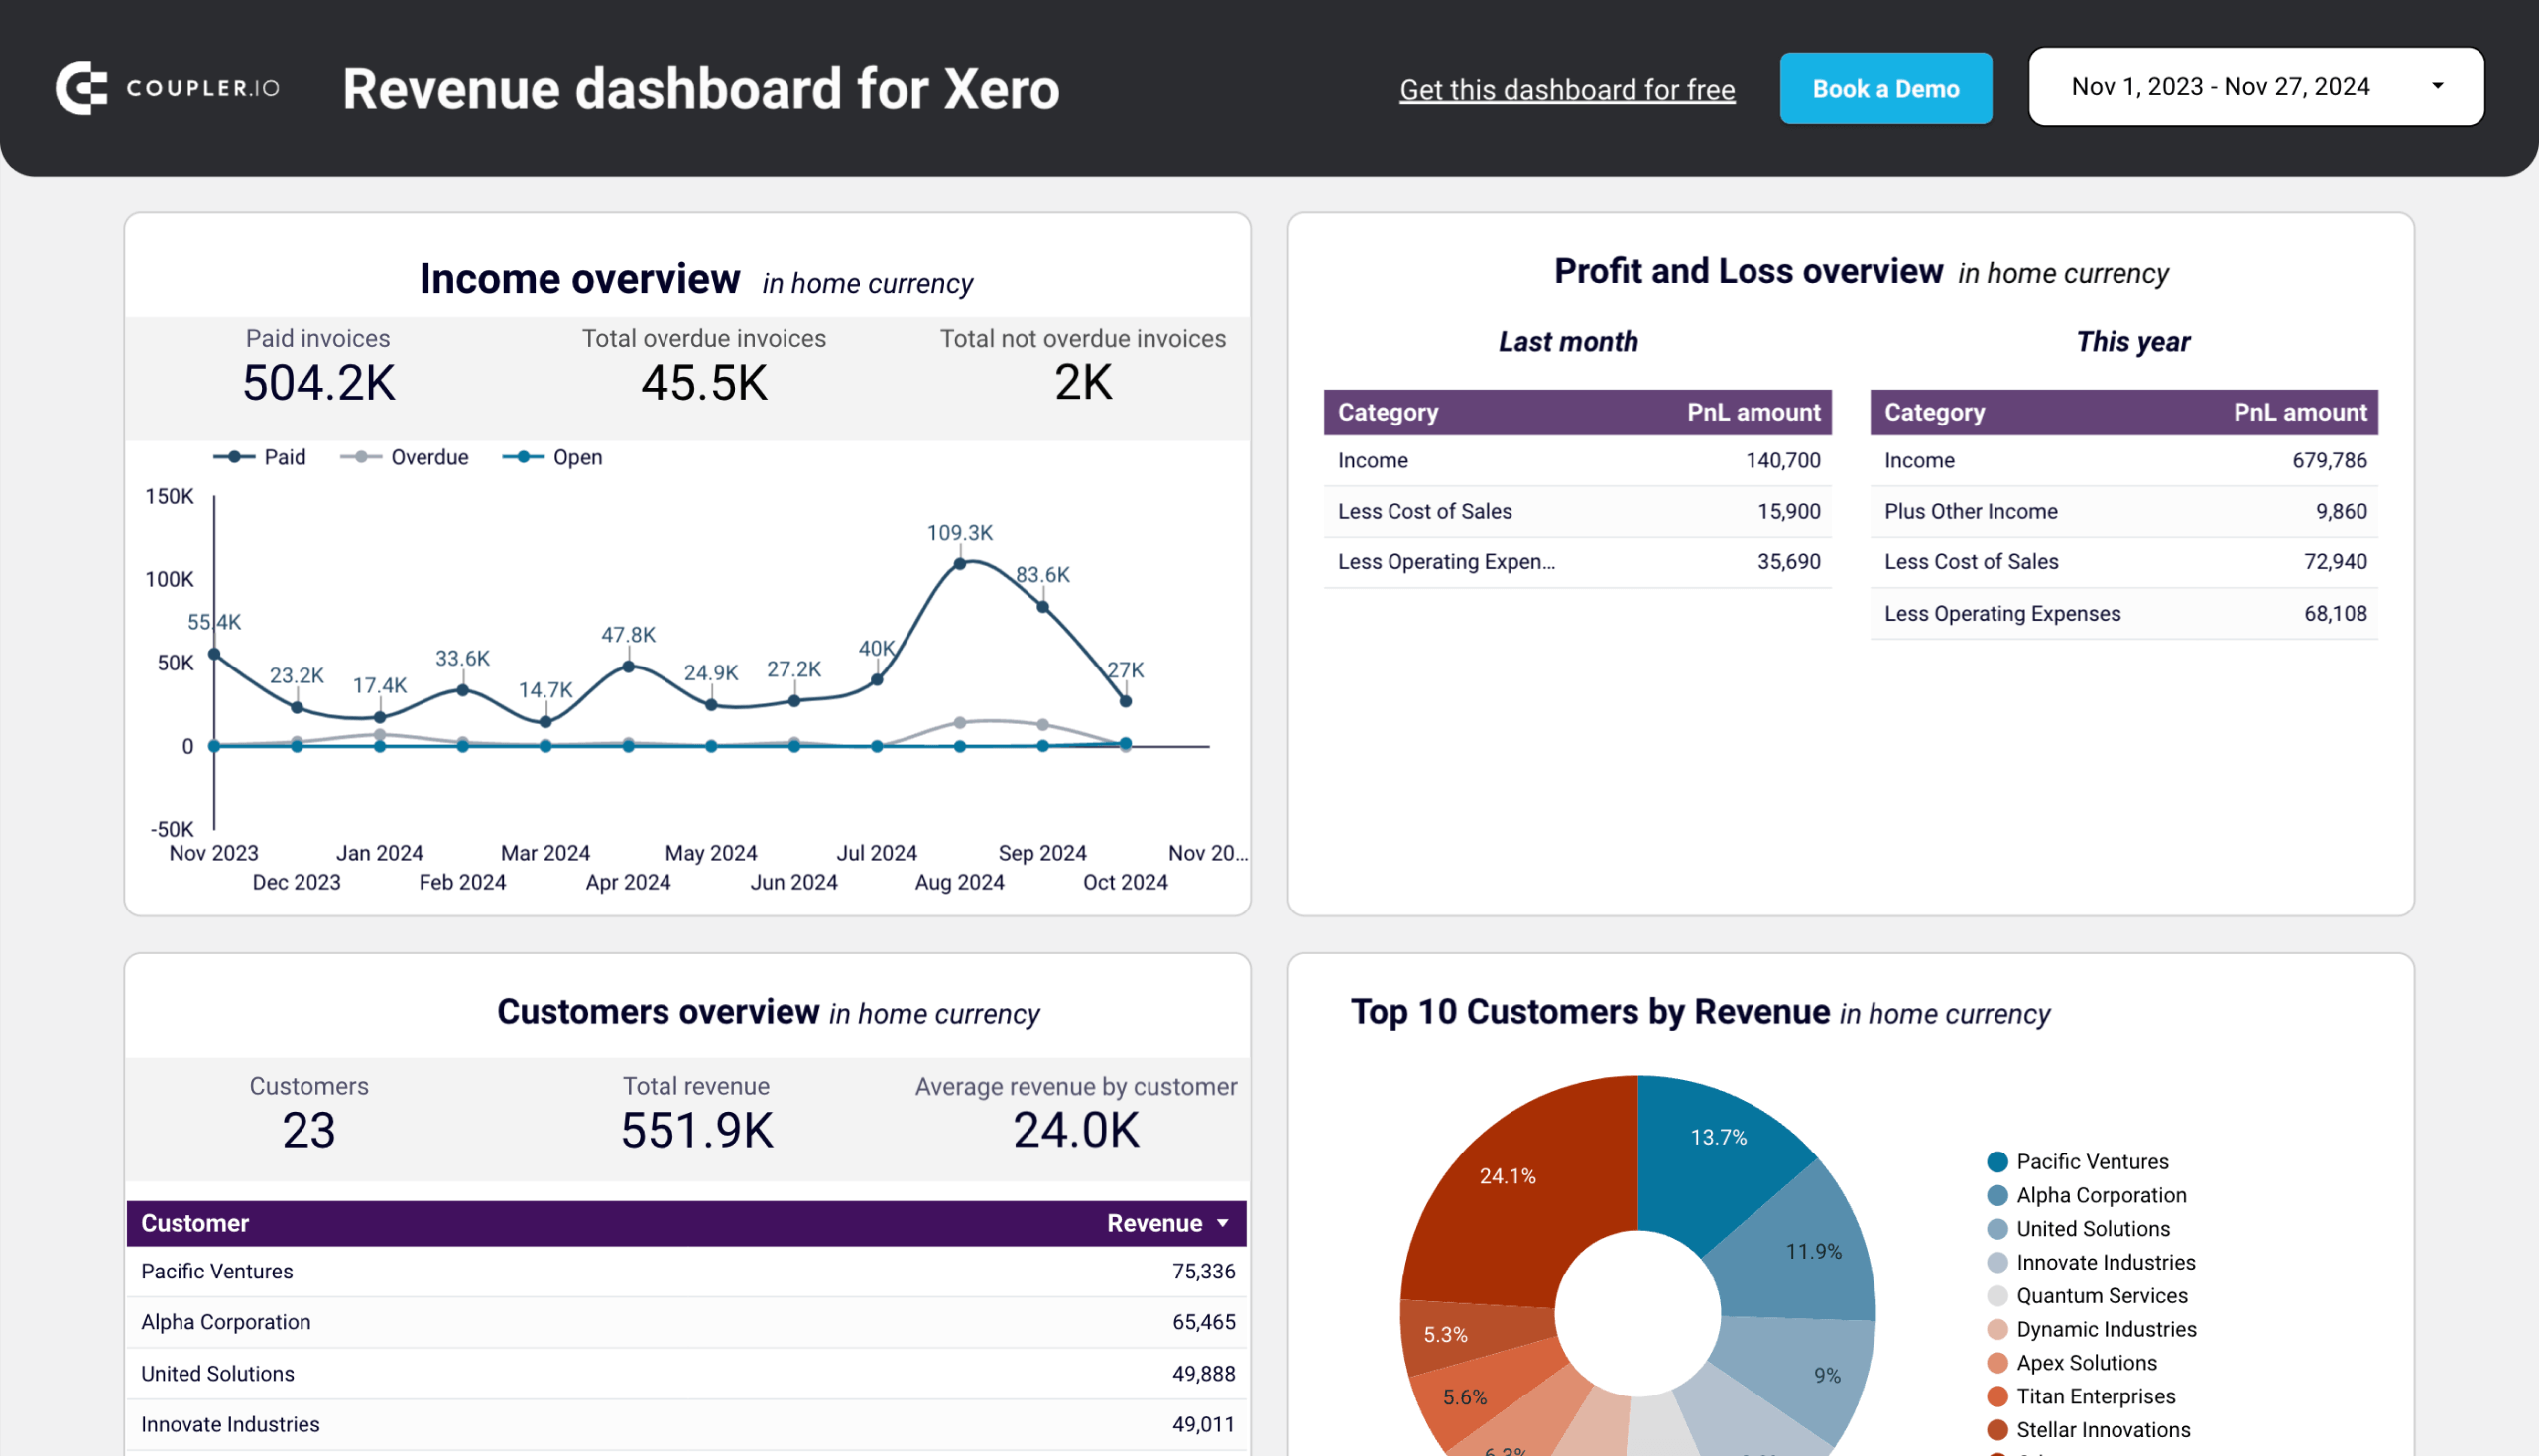
Revenue dashboard for Xero in Looker Studio
Get an overview of your profit and loss, products, and customers through a set of reports collected from Xero.
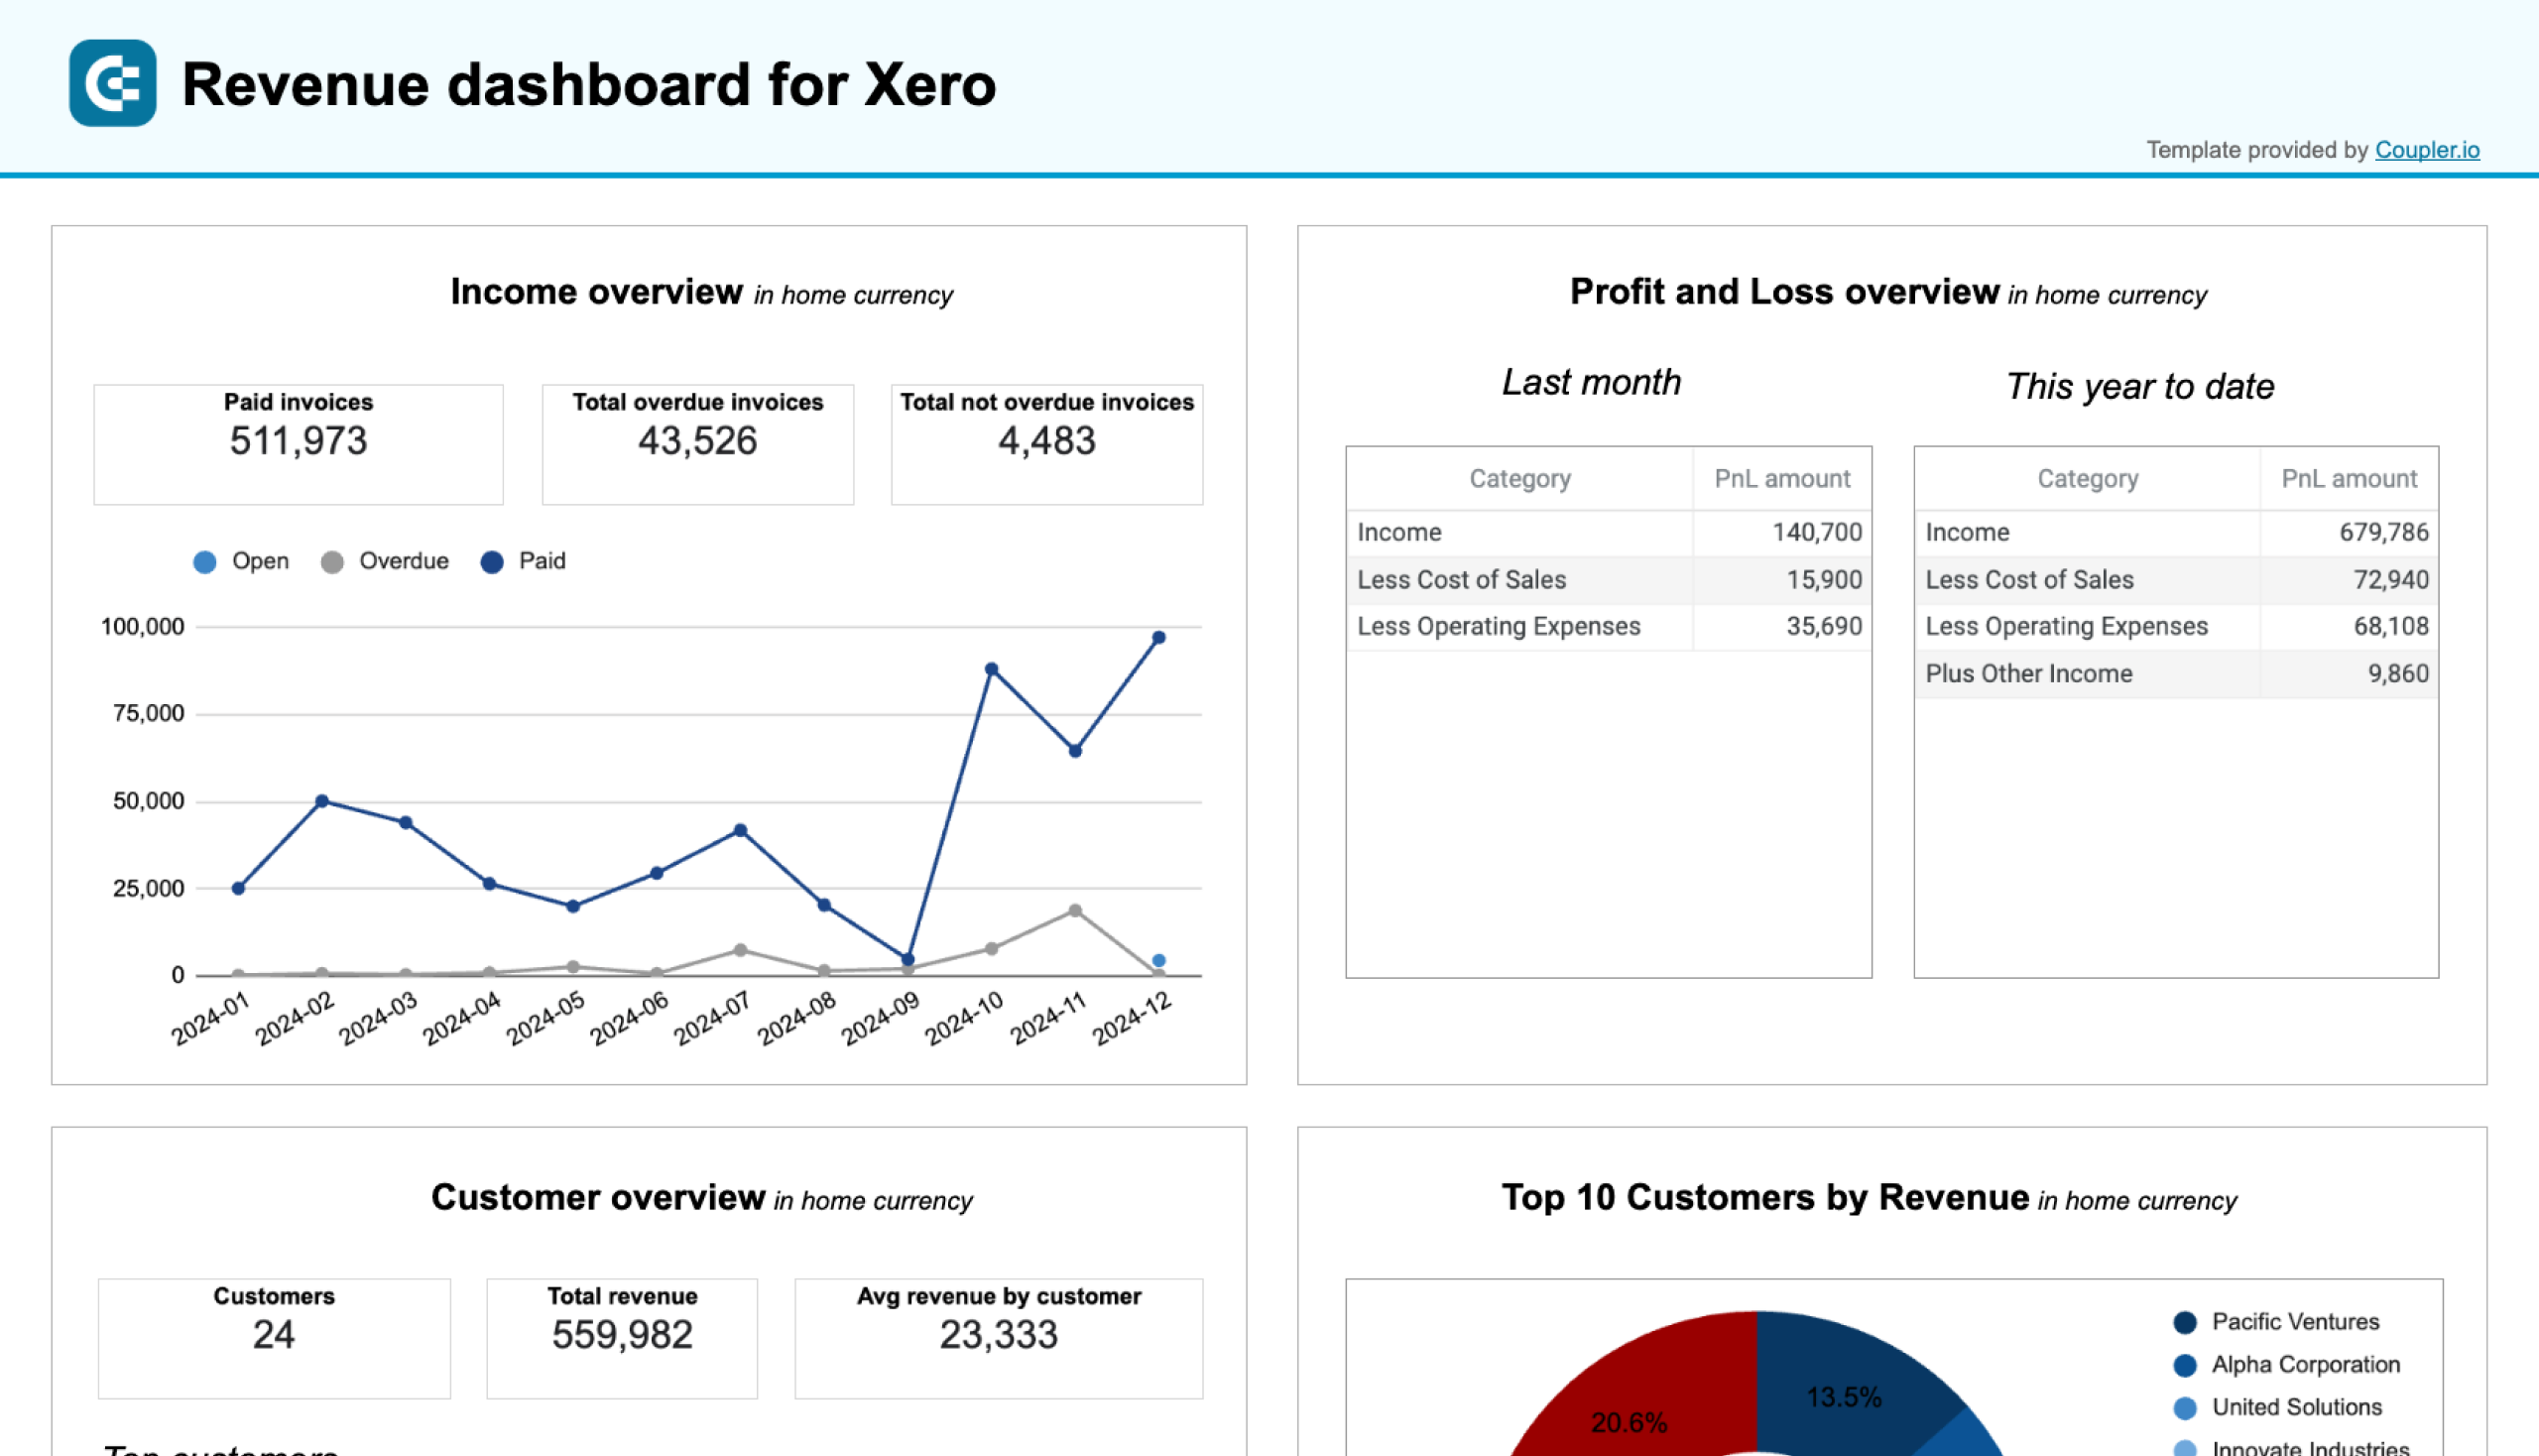
Revenue dashboard for Xero in Google Sheets
Track your revenue, costs, and customer insights with a comprehensive dashboard connected to your Xero account.
Accounts receivable dashboard
The accounts receivable dashboard provides an in-depth analysis of accounts receivable turnover and offers a clear picture of invoices and outstanding client balances. It displays a breakdown of paid, unpaid, and overdue invoices to determine payment behaviors from customers. It helps to inform decisions such as payment follow-ups and cashflow management.
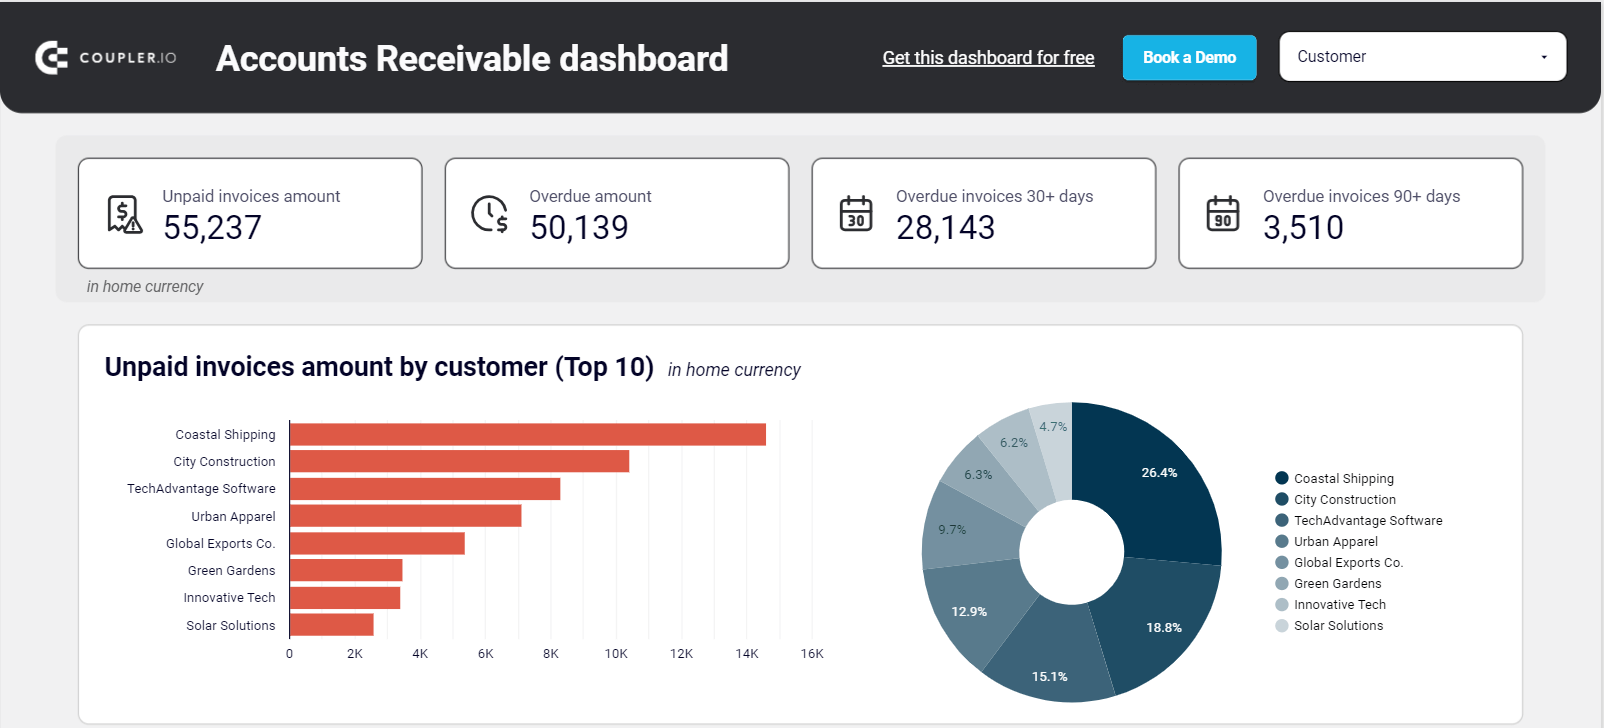
Here are the insights to expect:
- Total unpaid invoices
- Total overdue amount
- Aging of overdue invoices
- Top customers with unpaid invoices
- Accounts Receivable (AR) summary
- Paid invoices by customer
- All customer invoices
To copy the template, go to the Readme and use the instructions to connect your Xero account. The Looker Studio connector by Coupler.io allows the dashboard to refresh automatically.
Accounts payable dashboard
With the accounts payable dashboard, you get a clear overview of the bills received from vendors and suppliers. You can monitor the total amount due, view specific details on unpaid bills, and identify any bills that have been overdue. Additionally, it shows paid bills, payment history, and a list of vendor bills. It allows you to categorize bills and choose the order in which you’d like to settle them.
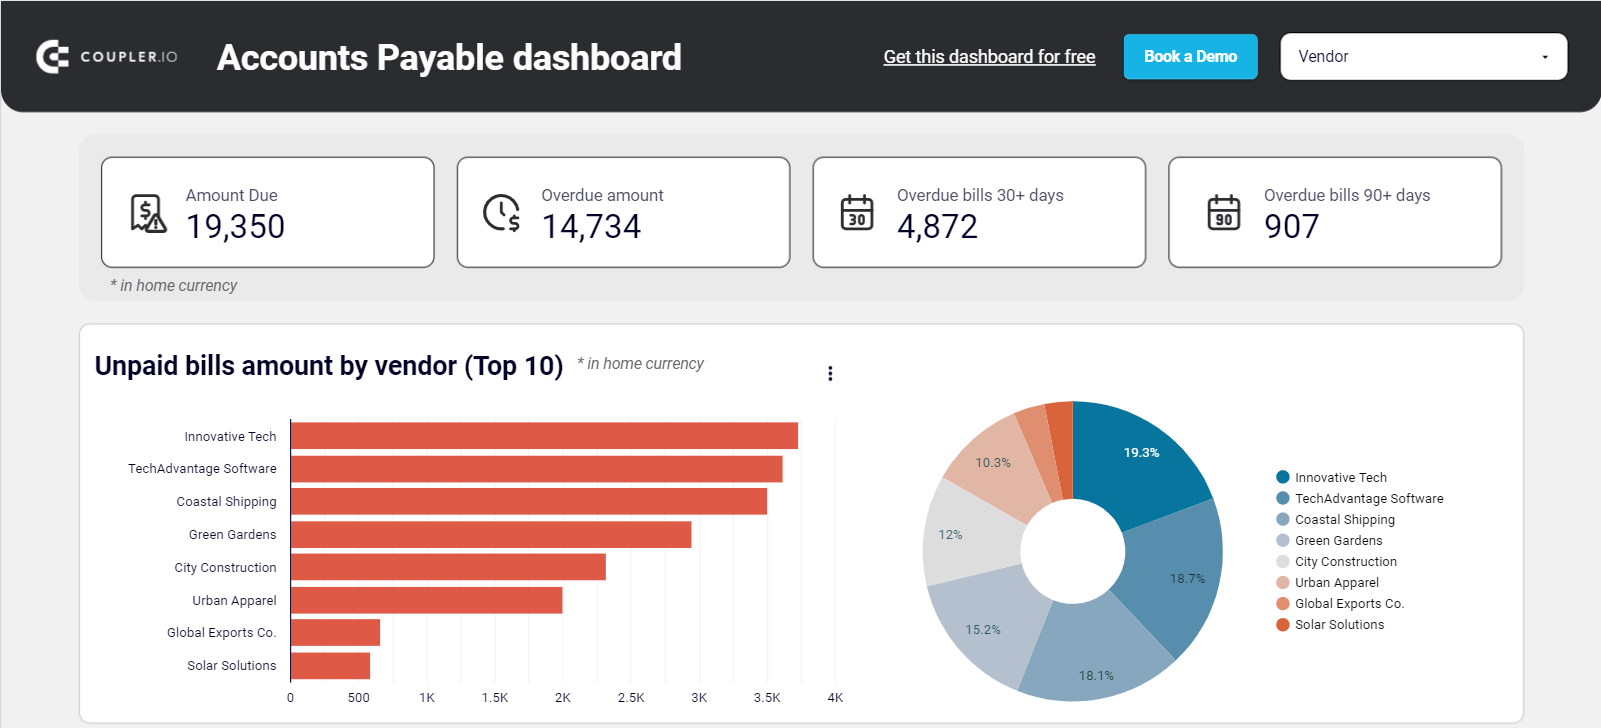
Here are the insights to expect:
- Total amount payable
- Overdue amount
- Overdue bills by days
- Top 10 unpaid bills by vendor
- AP Aging (Summary & Unpaid bills)
- Bank summary for the current month
- Summary of all vendor bills
The instructions on the Readme can help to copy and connect Xero to the Looker Studio template. Set the importer up and specify a schedule for automatic updates.
Check out all free cash flow dashboards and balance sheet dashboard templates by Coupler.io.
Manual Xero export to Looker Studio
There are different sections for Xero data and Xero reports, so you will need to find and download them separately. Below, we explain how to do each.
How to export data from Xero
- Go to the preferred category on the dashboard, e.g., Bills
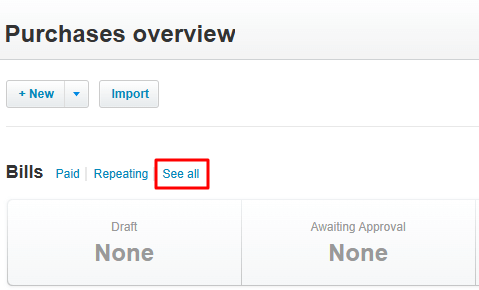
If there’s no export button, click See all to open the full page.
- Click the three-dot menu on the right side and select Export Bills.
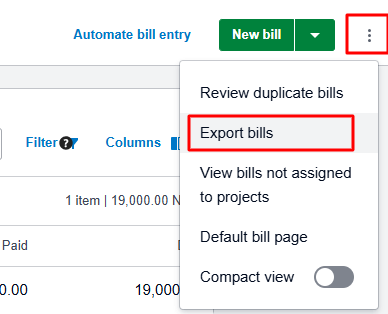
After you click, your Xero data will be saved to your device in CSV format.
How to export Xero Reports
- Navigate to Accounting > Reports.
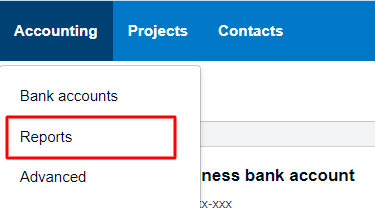
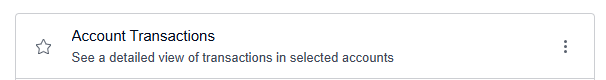
- Choose the exact report you want to export e.g. Account transactions.
- Select the required options and add the necessary filters.
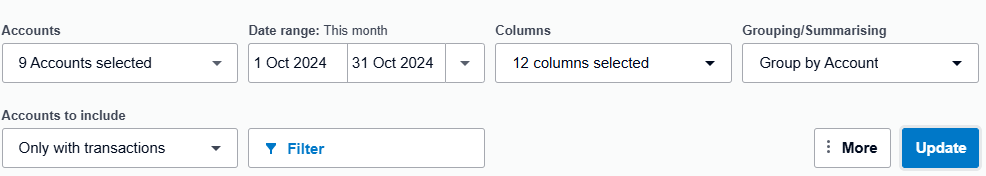
Make sure to click Update to save changes and see a preview of your report.
- The Export button is at the bottom-right of the page.
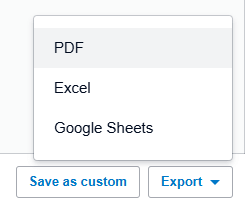
Pick any of the available file formats to download your Xero Report.
How to load data into Looker Studio
- Create a new data source using the plus symbol.
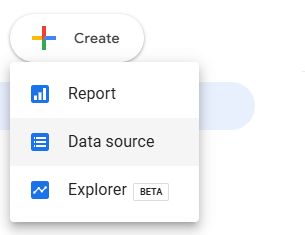
- Select any of the native connectors, e.g., file upload.
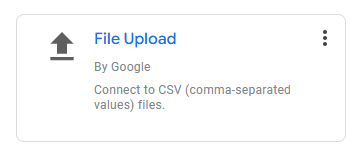
Then, you can import the file to your data source in Looker Studio.
What do you need to perform a custom Xero integration with an API?
You can make a Xero to Looker Studio integration using the API and some technical skills. The first step is to prepare the Xero API and get an access token. Then, you can use a custom script in Google Apps Script to export data from Xero. This helps to integrate apps for free and offers complete flexibility, but it can be very tedious to set up. Let’s discuss what you need to do:
The Xero API
- Go to developer.xero.com, and log in with your Xero details.
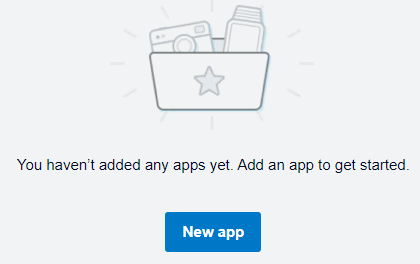
On the homepage, you can create a New app if you don’t have any yet.
- Navigate to Explorer and click Connect your Xero organisation.
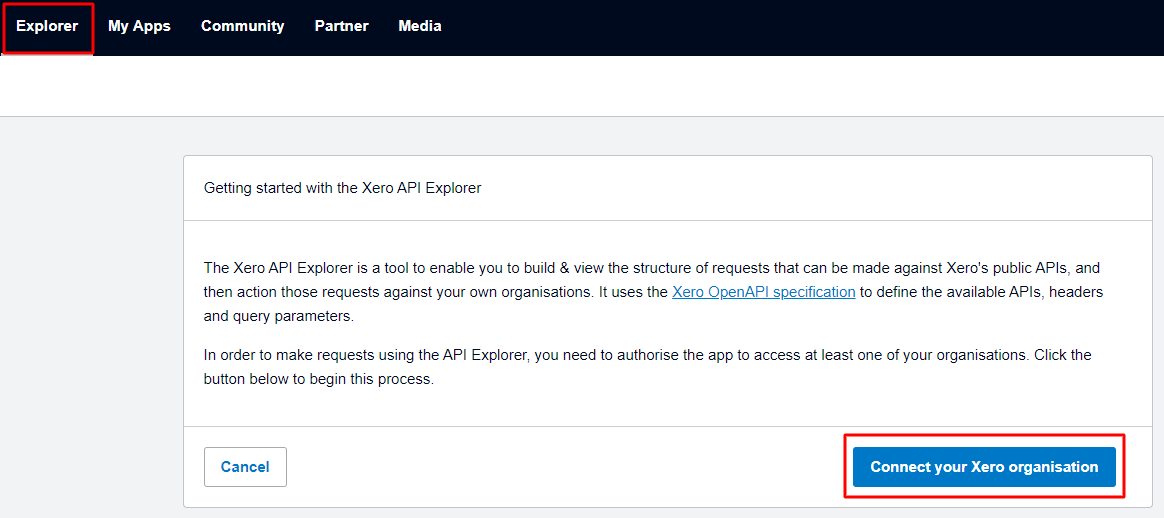
Be sure to Allow Access on the next page.
- Select the API, Endpoint, and Operation to generate your link.
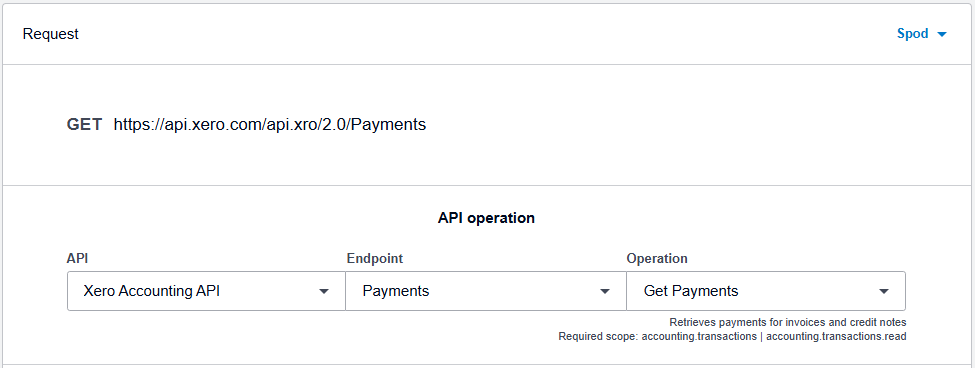
The Xero Accounting API has endpoints for all Xero data, and there’s one for Reports. Once you choose a data entity, you’ll select the operation to perform, e.g., Get Payments. If you want Reports, you’ll pick the report type under Operation, e.g., Get Report Trial Balance. You can copy your endpoint URL as soon as it is generated.
Access token for authorization
- Go to My Apps > Configuration to see your connection details.
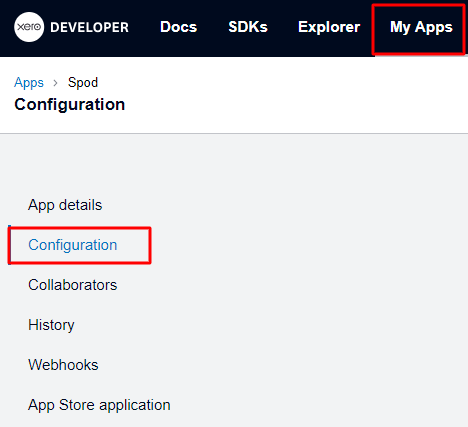
You’ll see the Redirect URL, Client id, and Client secret.
- Go to the Xero Authorization server using a URL such as
https://login.xero.com/identity/connect/authorize?response_type=code&client_id=YOURCLIENTID&redirect_uri=YOURREDIRECTURI&scope=openid
profile email accounting.transactions&state=123
Replace the values for client id, redirect uri, scope, and state (optional). Xero will redirect back, and you should see a temporary code being added to the redirect uri.
- Make a POST request to Xero’s token endpoint
POST https://identity.xero.com/connect/token
The header
authorization: "Basic " + base64encode(client_id + ":" + client_secret)
Content-Type: application/x-www-form-urlencoded
Request body
grant_type=authorization_code
&code=xxxxxx
&redirect_uri=https://myapp.com/redirect
Provide the values for client id, client secret, and code.
The response will contain an access token, expiry time, and a refresh token. Place the access token in the authorization header when making the API call. The token expires after 30 minutes, but you can use the refresh token to get a new one. You can check out the Xero Authorization Code Flow for a more detailed explanation of the entire process.
Google Apps Script
The platform allows you to run JavaScript code and create simple applications. Looker Studio doesn’t allow users to import using scripts, so you’ll have to send the data to an intermediary app such as Google Sheets and then add it to a report in Looker Studio.
You can use Apps Script to handle auth and also fetch data. It involves writing a script to get the access token and using necessary info such as the client id, client secret, and redirect uri. Then, you’ll use a script, the access token, and API endpoint to fetch data.
However, you can also use an API platform like Postman to get the access token. You’ll create a request, go to the Authorization tab, select OAuth2.0, and include the details for authentication. Then, you can simply use Google Apps Script to extract Xero data.
Which method to choose to load data from Xero to Looker Studio
Exporting data from Xero to Looker Studio is only needed for reporting and analytics. You can create custom dashboards featuring useful metrics and performance indicators.
The manual export is okay for one-time exports and is more suitable for sharing data. While it can be used for building reports, the process must be repeated each time you wish to update the information.
Creating a custom integration with API is not advisable for non-technical users. But it can be your choice if you have a data analyst on the team.
Coupler.io provides a simple yet powerful solution for automating Xero reporting. You can easily connect Xero to Looker Studio and create your reports from scratch or use the available templates. Additionally, it supports other source and destination apps. For instance, you can export Xero to Google Sheets or collect data from QuickBooks, Shopify, Salesforce, and more. So, you won’t need to look for other connectors to report on other data. Coupler.io is a one-stop shop for data analytics that will make your business reporting faster and more efficient.
Automate financial reporting with Coupler.io
Get started for free


