YouTube provides plenty of analytical data about your channel’s audience, revenue, and content. However, it still may not be sufficient for a 3D view of your video performance. To gain more insights into your channel, build custom reports in Power BI. But first of all, you need to connect YouTube Analytics to Power BI, and we’ll show you the best way to do this.
The ways to connect YouTube Analytics to Power BI
Even though Microsoft Power BI has built-in data connectors for some services, there is no YouTube on the list. So, you can opt for one of the following options to connect YouTube Analytics to Power BI.
- Coupler.io
It is a no-code reporting automation solution that turns raw data into meaningful reports. Coupler.io lets you connect YouTube to Power BI and schedule data refresh with just a few clicks. In addition to automation, you can organize your data on the go and blend it with information from other channels or even sources, all within one app.
| Pros | Cons |
|---|---|
| – No coding is required – Data loading on schedule – Data filtering and transformation – Possibility to blend data from several YouTube channels – Pre-configured Power BI template dashboards | No real-time data updates (only a 15-minute interval is the fastest option) |
- Manual data load from YouTube Analytics to Power BI
YouTube provides the possibility to download analytics data in a CSV file. However, this is not as complete as within the YouTube account since the data from each tab (Content, Audience, etc.) is downloaded in a separate CSV file. They can be used in Power BI, of course, but you’ll need to update them manually each time new analytics data arrives.
| Pros | Cons |
|---|---|
| – Easy to implement – Free of charge. | – Time-consuming process – Error-prone – Limited YouTube Analytics data available |
- Custom API integration
The YouTube Reporting and YouTube Analytics APIs let you retrieve data to automate your reporting tasks. So, you can create a custom integration to load data from YouTube Analytics to Power BI. However, this method requires technical expertise and coding skills to make requests to YouTube Analytics API and load data to Power BI.
| Pros | Cons |
|---|---|
| Integration flexibility | Requires sufficient knowledge and skills in the technical field |
How to set up a YouTube Analytics Power BI integration with Coupler.io
Step 1. Gather data from YouTube Analytics
To start collecting data with the Power BI connector, click Proceed in the form below. This will allow you to sign up for Coupler.io for free with no credit card required.

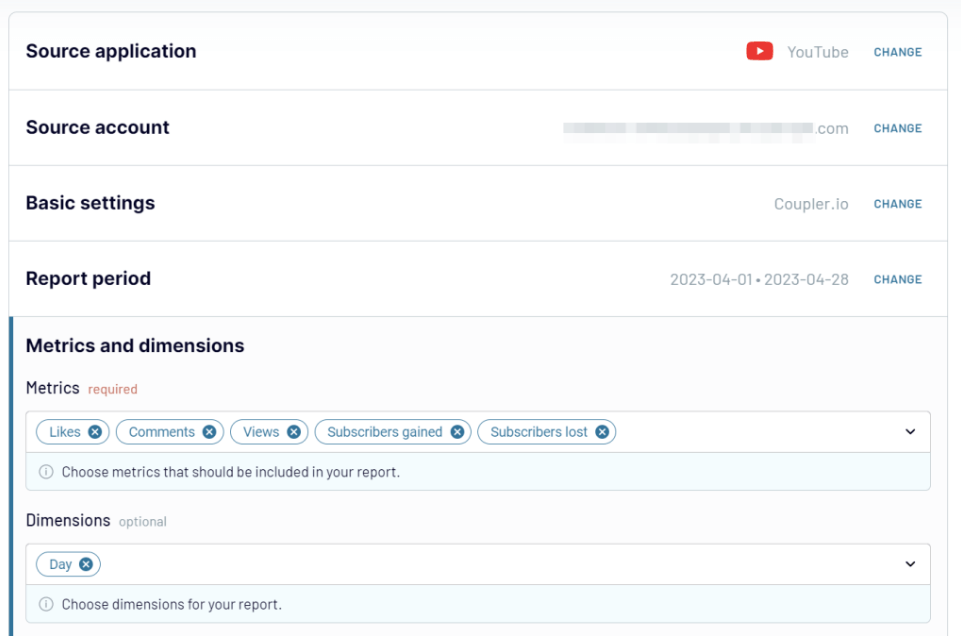
After signing up to Coupler.io for free, connect your YouTube account and specify the desired reporting parameters (report period, metrics, dimensions, etc.).

Step 2. Transform data
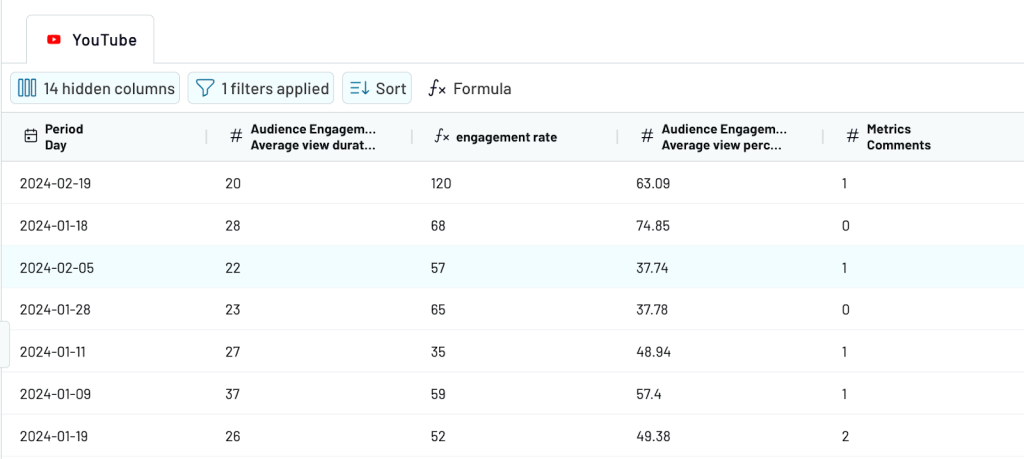
At this stage, you can elaborate on data and perform a set of actions to improve its quality. Coupler.io offers the following data transformation options:
- Hide columns to remove data that provides no value for further analysis.
- Filter data to get a specific dataset based on certain criteria. For instance, you might extract data only for those videos with more than 2000 likes.
- Sort data by indicating specific criteria to make it look more organized.
- Apply formulas to create columns with aggregated values.

Step 3. Load data and schedule refresh
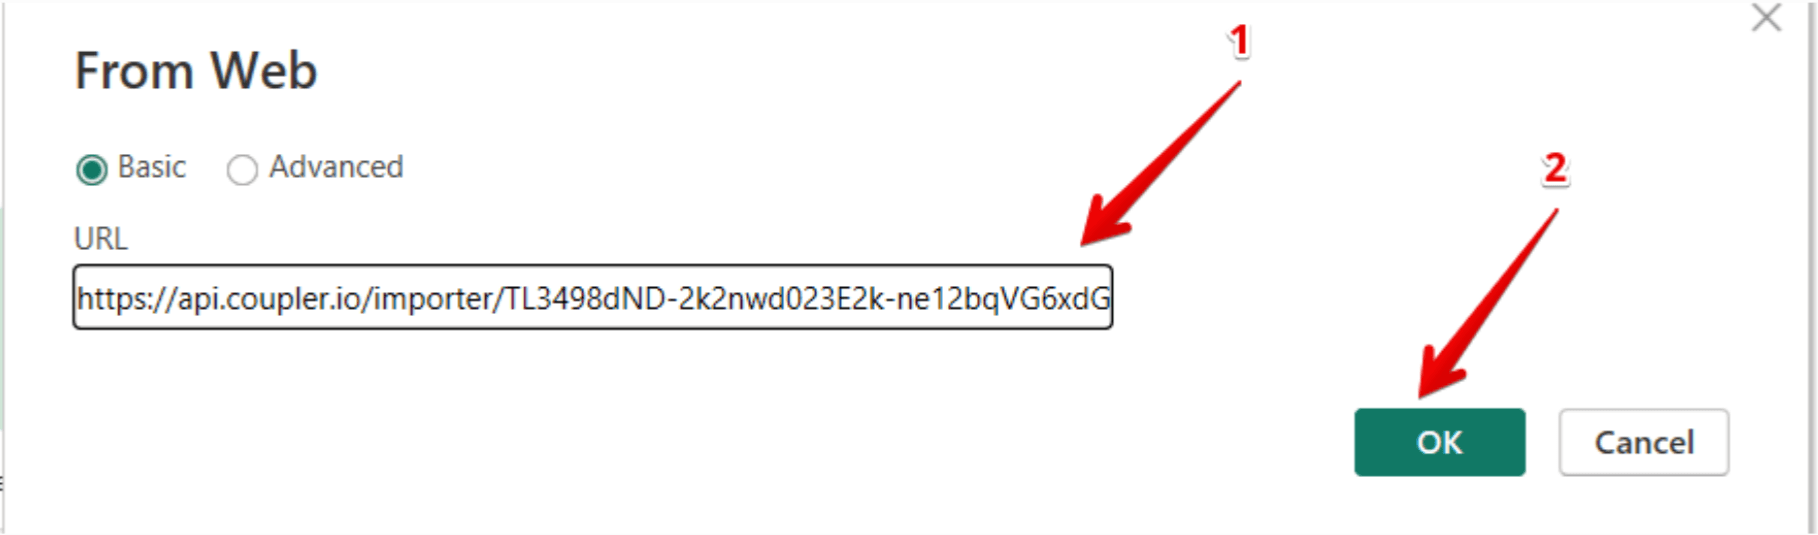
Once your data looks the way you want, follow the in-app instructions to load it into Power BI. You’ll need to generate a link and paste it into Power BI Desktop.

BTW, Coupler.io also lets you connect YouTube Analytics to Looker Studio.
Enable the Automatic data refresh and configure the schedule to automate data exports from YouTube Analytics to Power BI. The minimum interval is 15 minutes, the maximum is once a month.

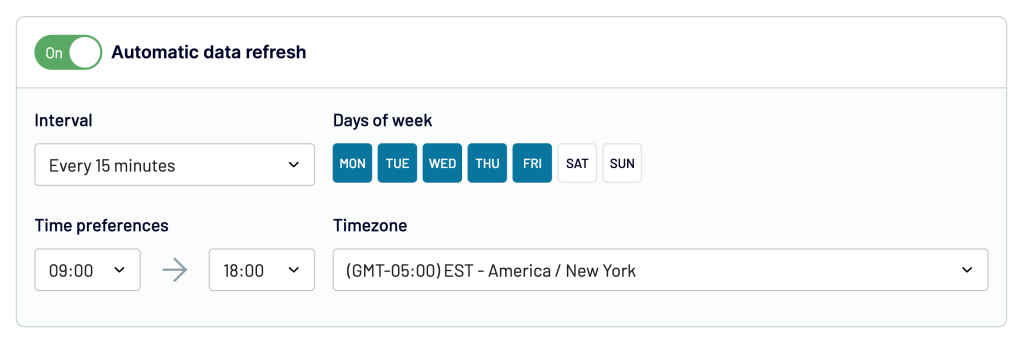
Save and run the importer to start sending YouTube Analytics data to Power BI. With scheduled import, everything is done automatically so that Power BI always has up-to-date data. Such an approach promotes quality reporting on your YouTube channel performance and creates a stable ground for strategy review.
What insights you can extract from your YouTube analytics data
An image is worth 1000 words, and this applies to data analysis. Power BI offers dozens of visuals that can shed light on your YouTube channel performance.
Choosing the right visual type is also important. Check out some examples of charts on YouTube analytics data and the insights they reveal.
Overview of the channel’s content performance
Views, likes, comments, shares, and average view duration are the key metrics describing your video content. Bar charts illustrate the dynamics of how these metrics change over time. This helps to track your YouTube channel growth as well as discover the peak view days and plan video publication on certain days of the week.

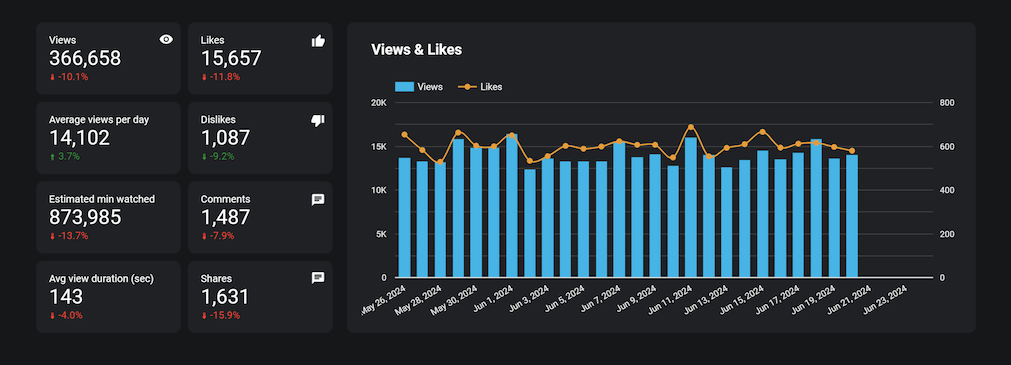
The graphs showing the correlation between views and shares, for instance, provide a clear vision of user engagement.
Top videos, keywords, and external sources
Bar and pie charts are ideal for illustrating the top-performing videos, keywords, and sources leading users to your videos. Top videos by views provide insight into which type of content and topics interest your audience the most. For instance, the top keywords chart gives you a hint on how to name your videos to get the attention of viewers on the web.

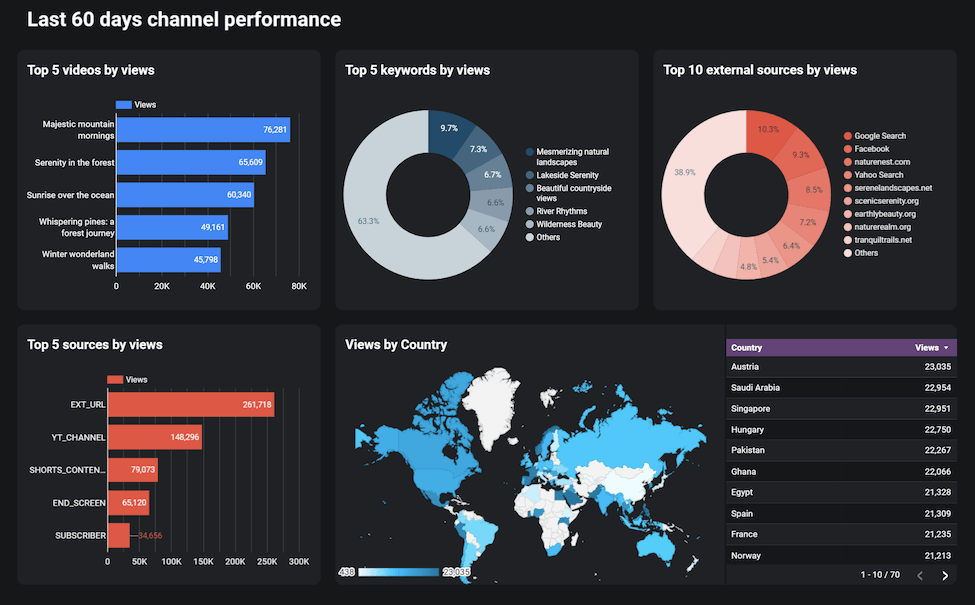
The heatmap chart provides details on views around the world, highlighting the countries with the biggest audiences. That way, you may create a bunch of videos for viewers from a certain country, considering cultural aspects, for instance.
Subscriber dynamics
Line charts are good for depicting your channel’s audience growth. While the increasing number of subscribers is always a positive thing, it’s necessary to pay attention to lost subscribers and analyze why that’s happening. If you see that more people started to unsubscribe from your channel on certain dates, see which content was published during that period.

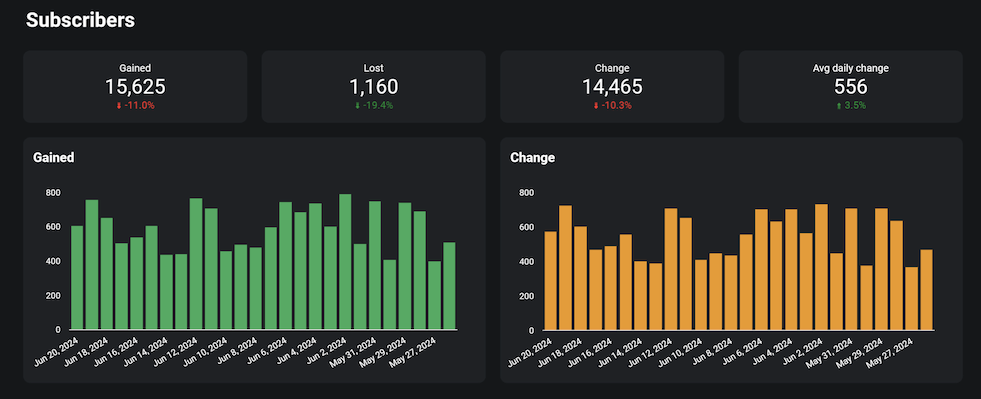
If that was something that doesn’t correspond to your channel leitmotiv or you made a contradictory statement in one of your videos, then an avalanche of unsubscribes might be associated with that.
Video content performance breakdown
This part interlaces with the top viewed videos chart above. You can observe preferred types of content on your channel again.

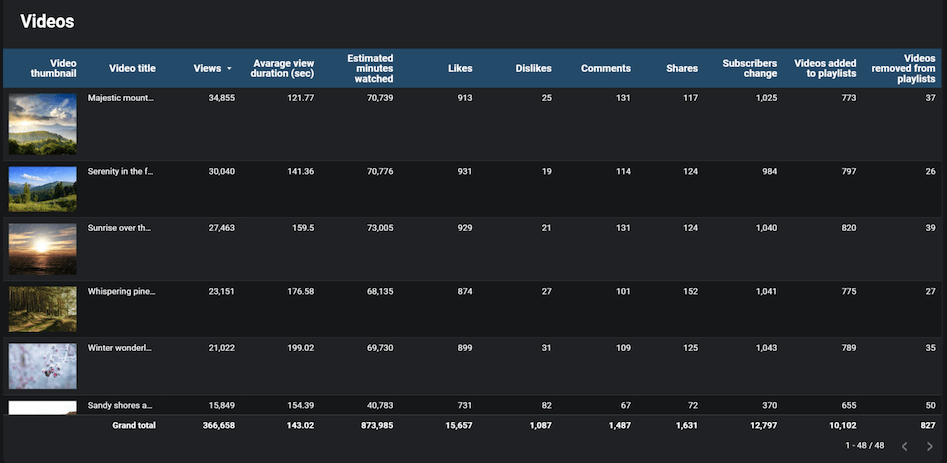
However, it’s also worth focusing on the least-performing videos here. This reveals topics your audience isn’t interested in, so you can adjust your YouTube strategy and remove similar topics from the to-do list.
All the insights above have been introduced with the help of our YouTube Analytics dashboard. However, it was designed in Looker Studio. If you’d like to have the same dashboard template in Power BI, then get in touch and let us know. In the meantime, feel free to check out our dashboard templates for Power BI.
How to manually load data from YouTube Analytics to Power BI
Before automation tools, such as Coupler.io, appeared on the tech market, data was gathered manually. Such an approach might still be the best option in some cases. For instance, if you need to make YouTube channel analytics reports once a quarter, a manual method would be good. It would also be suitable for those who use an online version of Power BI.
Here are the steps to export YouTube Analytics data to Power BI:
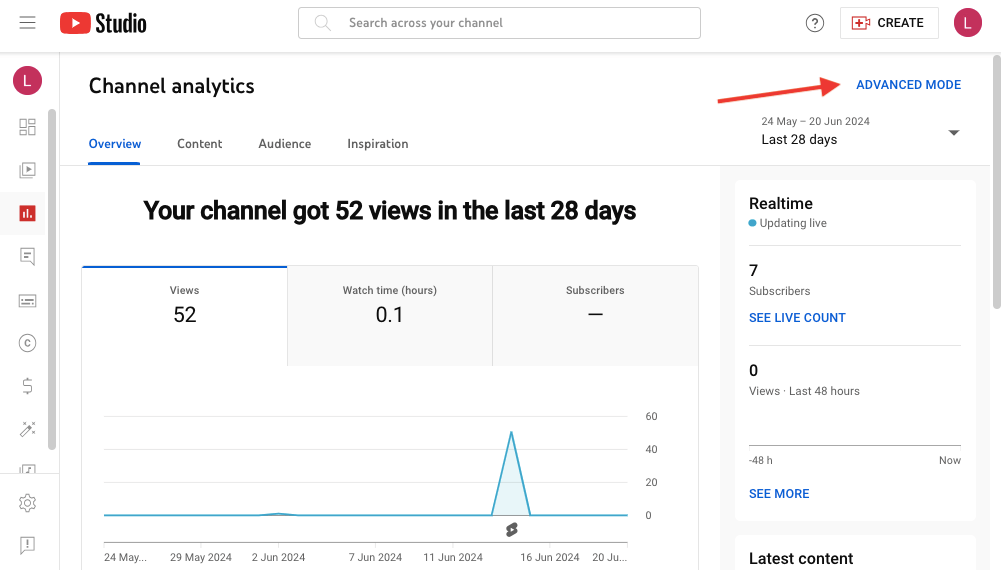
- In your YouTube Studio, go to the Analytics tab and click on Advanced Mode.

- Click on the Export current view button.

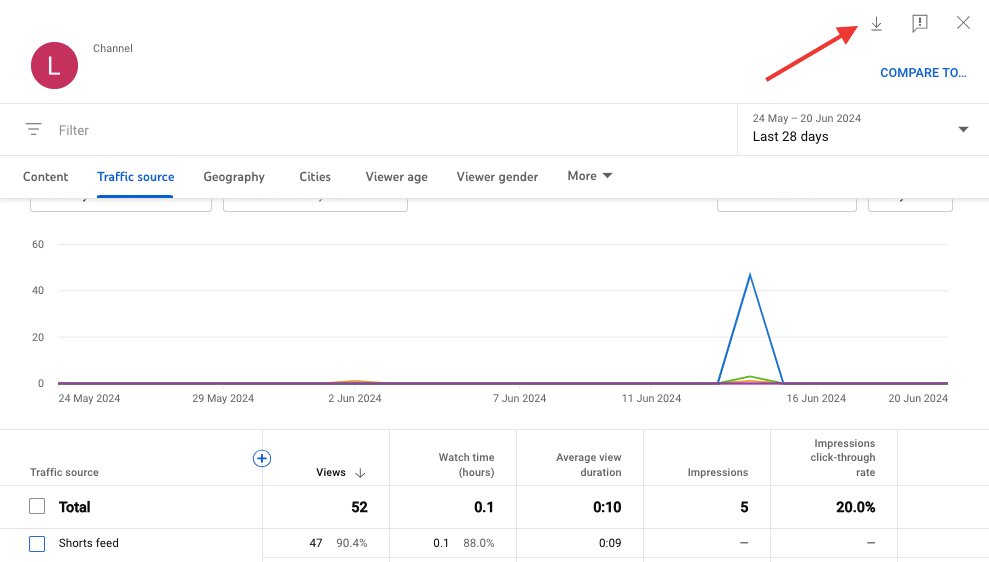
NOTE: You’ll have to download different CSV files, each for a different view (content, traffic source, geography, viewer age, etc.).
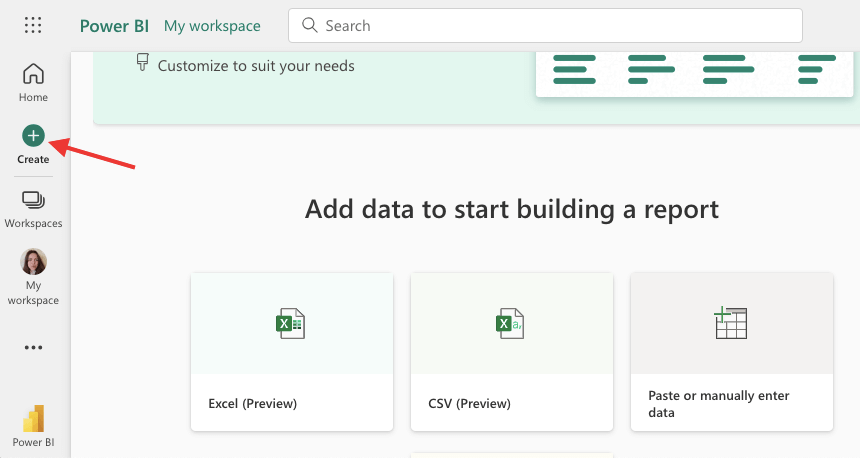
- If you’re using an online version of Power BI, log into your account and click Create on the left panel. Then select CSV (Preview), pick up the CSV file with YouTube Analytics data from your computer, and follow further instructions for loading data.

In the Power BI desktop, go to Get Data -> Text/CSV and select the file needed.
It took us more than 20 minutes to load data manually into Power BI. This method is obviously time-consuming and prone to human error.
Which method to connect YouTube Analytics to Power BI should you choose
In this article, we have explained in detail two methods for connecting YouTube Analytics and Power BI. The manual approach is rather slow and error-prone, though it has its areas of implementation. You can use it for creating a monthly or quarterly report. Manual integration might also be suitable when you need to focus only on certain metrics rather than on the whole picture of the YouTube channel performance.
Meanwhile, data integration with Coupler.io is a fast solution that automates data extraction, transformation, and loading. It’s enough to set up the data pipeline once and not have to worry about how to get the recent data for your Power BI reports. This connection is extremely convenient and attractive as Coupler.io allows businesses to concentrate on data exploration and YouTube strategy elaboration rather than having to spend time on monotonous tasks.
Automate data export from YouTube with Coupler.io
Get started for free